Abstract
Soluble MUC1 (sMUC1) levels are elevated in many MUC1+cancers. We and others have shown that MUC1 is expressed on multiple myeloma (MM) plasma cells and B cells. In this study, we measured sMUC1 levels in bone marrow (BM) plasma from 71 MM patients and 21 healthy donors (HDs), and in peripheral blood (PB) plasma from 42 MM patients and 13 HDs using an immunoassay that detects the CA27.29 epitope of MUC1. sMUC1 levels were found to be significantly greater (mean 31.76 U/mL, range 5.69 to 142.48 U/mL) in MM patient BM plasma versus HD BM plasma (mean 9.68 U/mL, range 0.65 to 39.83 U/mL) (P < .001). Importantly, BM plasma sMUC1 levels were related to tumor burden because sMUC1 levels were significantly higher for MM patients with active disease (34.62 U/mL, range 5.69 to 142.48 U/mL) versus MM patients with minimal residual disease (16.16 U/mL, range 5.7 to 56.68 U/mL) (P = .0026). sMUC1 levels were also elevated in the PB plasma of MM patients (32.79 U/mL, range 4.15 to 148.84 U/mL) versus HDs (18.47 U/mL, range 8.84 to 42.49) (P = .0052). Lastly, circulating immunglobulin M (IgM) and IgG antibodies to MUC1 were measured in 114 MM patients and 31 HDs, because natural antibodies to MUC1 have been detected in patients with other MUC1-bearing malignancies. These studies demonstrated lower levels of circulating IgM (P < .001) and IgG (P = .078) antibodies to MUC1 in MM patients compared with HDs. Our data therefore show that in MM patients, sMUC1 levels are elevated and correlate with disease burden, whereas anti-MUC1 antibody levels are decreased.
Introduction
MUC1 is a highly glycosylated transmembrane protein that is normally present on the luminal surface of secretory glands.1 In contrast to healthy glandular tissues, many adenocarcinomas (breast, ovary, pancreas, and lung) express a hypoglycosylated form of MUC1.1 A soluble form of MUC1 (sMUC1, CA 15.3, CA27.29 antigen) has been detected in breast milk, peripheral blood, urine, and supernatants from cultures of MUC1+ cancer cell lines and primary cancer cells.1-4 sMUC1 appears to represent a truncated form of MUC1 that lacks the cytoplasmic domain of membrane bound, full-length MUC1.5 The mechanism by which sMUC1 is formed needs to be clarified but may result from alternative splicing of the MUC1 gene product, leading to the production of a secreted form of MUC1,6 or from proteolytic cleavage of full-length, membrane-bound MUC1 by an undefined mechanism.5 Increased levels of sMUC1 have been found in peripheral blood (PB) plasma and serum of patients with adenocarcinomas,7-13 which correlate with tumor burden.10-13 Assays for the detection of sMUC1 (CA15.3, CA27.29) have been cleared by the US Food and Drug Administration (FDA) for use in monitoring disease activity in patients with breast cancer.
The function of MUC1 remains to be defined. From an immunologic standpoint, both an immunostimulatory14-16 and an immunoinhibitory17,18 role have been proposed for membrane-bound MUC1. For sMUC1, an immunoinhibitory role has been ascribed because sMUC1 inhibits human T-cell proliferation19,20 and natural killer cell activity in vitro.21 These studies suggest that sMUC1 may be an important immunosuppressive agent in patients with MUC1-bearing malignancies, as evidenced by the poor response to active specific immunotherapy in patients with metastatic adenocarcinomas who have highly elevated sMUC1 levels.22 Therefore, determining sMUC1 levels in multiple myeloma (MM) patients may be important from an immunobiologic standpoint.
We and others have shown that MUC1 is expressed on the cell surface of most MM cell lines, MM patient plasma cells and circulating B cells, and plasmacytomas.14,23-26 In contrast to the hypoglycosylated form of MUC1 expressed on adenocarcinomas, MUC1 on most MM cell lines, MM patient plasma cells, and circulating B cells is expressed as a more underglycosylated or core protein form.26 In addition, sMUC1 has also been detected in PB plasma of MM patients by the use of a noncommercial enzyme-linked immunosorbent assay (ELISA).14 In this study, we determined whether sMUC1 levels are elevated in MM patients using an FDA-cleared immunoassay that recognizes the CA27.29 MUC1 epitope.13 We show that the CA27.29 epitope is present on most MM cell lines, fresh MM patient plasma cells, and circulating MM patient B cells, and that sMUC1 is present in the supernatants of MM cell lines in culture. We further demonstrate that sMUC1 levels are elevated in both bone marrow (BM) and PB plasma of MM patients in comparison to healthy donors (HDs), and that BM sMUC1 levels are associated with tumor burden in MM patients. In addition to examining sMUC1 levels, we also determined whether natural antibodies to MUC1 circulated in MM patients because both immunoglobulin M (IgM) and IgG anti-MUC1 antibodies are present in patients with various MUC1-bearing malignancies.27-30 Moreover, natural anti-MUC1 antibodies may be protective, because the survival of ovarian and early breast cancer patients is favorably influenced by the presence of a humoral response to MUC1.27,28 Interestingly, levels of IgM anti-MUC1 antibodies, as have been reported in ovarian cancer patients, were inversely correlated with sMUC1.27
Patients, materials, and methods
Patients
PB and/or BM aspirates were obtained from MM patients and HDs after informed consent. MM patients included those at diagnosis, during therapy, in relapse, and with minimal residual disease (MRD). MM patients with MRD were defined as having 5% or less plasma cells on BM biopsy, along with trace or undetectable monoclonal proteins. Patients with active disease (AD) had 10% or more plasma cells, along with detectable monoclonal serum and/or urine proteins. No cases of nonsecretory MM patients were analyzed.
Antibodies
The B27.29 monoclonal antibody (mAb), which targets the CA27.29 MUC1 epitope,31 was obtained from Bayer Diagnostics (Walpole, MA). VU-3C6 and VU-4H5 mAbs32 were purified at our institution from hybridomas kindly provided by Dr J. Hilgers (Vrije Universiteit, Amsterdam, The Netherlands); the epitopes targeted by these mAbs have been extensively characterized.31,33,34AR20.5 is a murine IgG1 mAb that binds to the DTRAP epitope on the VNTR region of MUC1 and recognizes both core and glycosylated MUC1.35 AR20.5 was kindly provided by Altarex, Inc (Edmonton, Alberta, Canada). B4-FITC (CD19) mAb was obtained from Coulter (Hialeah, FL). Anti-CD38 (Leu17-PE) mAb was purchased from Becton Dickinson (San Jose, CA). FMC44 (CD45RA) mAb was conjugated to fluorescein isothiocyanate (FITC) or phycoerythrin (PE), and antimouse Ig (goat antimouse Ig [H+L]-FITC) was purchased from Southern Biotechnology (Birmingham, AL). The mAb MsIgG1 (Coulter) was used as an isotype control.
Cell lines and culture conditions
ARH-77, HL-60, RPMI 8226, U-266, and ZR-75-1 cell lines were obtained from the American Type Culture Collection (Rockville, MD). OCI My-5 cells36 were kindly provided by Dr H. A. Messner (Ontario Cancer Institute, Ontario, Canada); IL-6 transfected S6B45 MM cells37 were kindly provided by Dr T. Kishimoto (Osaka University, Osaka, Japan). MM.1S cells38 were kindly provided by Dr Steven Rosen (Northwestern University, Chicago, IL). MM cells (except for OCI My-5 cells) and HL-60 cells were cultured in RPMI 1640 medium (Gibco, Grand Island, NY). OCI My-5 MM cells were cultured in Iscove's Modified Dulbecco's Medium (Gibco). ZR-75-1 breast cancer cells were cultured in Dulbecco's Modified Eagle's Medium. All media contained 10% fetal bovine serum (FBS) (Hyclone, Logan, UT) and was supplemented with L-glutamine, penicillin, and streptomycin (Gibco).
Phenotypic analyses of cell lines and immunofluorescence
MM and other tumor cell lines were characterized by flow cytometry for cell surface MUC1 expression. The 106 cells were incubated with either anti-MUC1 or isotype control mAbs (5.0 μg) for 45 minutes at 4°C. Cells were then washed with phosphate-buffered saline (PBS) and incubated for 45 minutes with 2.0 μg of goat antimouse fluorescein-conjugated mAb (Coulter). Cells were next washed and fixed with 1% formaldehyde PBS. Staining intensities were defined by comparing differences in log fluorescence for anti-MUC1 mAbs versus isotype control mAb by the use of the following criteria: (0), no difference; (weak,+), less than1 log-fold difference; (moderate,++), 1 or greater but less than 2 log difference; and (strong,+++), 2 or greater log difference.
Phenotypic analysis of patient cells
BM or PB aspirates were collected into heparinized vacutainer tubes and centrifuged over a Ficoll-Hypaque gradient (Pharmacia, Sweden). PB mononuclear cells (MCs) from MM patients and HDs were examined by 2-color immunofluorescence using B4-FITC and either B27.29, AR20.5, VU-4H5, or VU-3C6 mAbs, or an isotype-matched control mAb. Cells were washed and then stained with goat antimouse Ig conjugated to quantum red (Sigma, Mississauga, Ontario, Canada) as previously described.26 MUC1 expression on BM plasma cells from MM patients and HDs was identified by multicolor immunofluorescence by gating for cells that were CD38hi CD45RA−/lowith moderate-to-high forward light scatter.26
Soluble MUC1 immunoassay
BM or PB aspirates were collected into heparinized vacutainer tubes and centrifuged. Collected plasma was quickly frozen and maintained in a −80°C freezer, and thawed at the time of assay. sMUC1 levels were determined by use of ACS:180 BR assay (Bayer Diagnostics), an automated competitive immunoassay that detects the CA27.29 epitope of MUC1.13 Briefly, the ACS:180 BR assay uses direct chemiluminescent technology to detect and quantitate sMUC1. The murine mAb B27.29 used in this assay binds to the CA27.29 epitope present on the variable number of tandem repeats (VNTR) region of MUC1.31 33 B27.29 is labeled with acridium ester, permitting chemiluminescence. sMUC1 in a sample competes with solid phase-bound purified MUC1 derived from culture supernatants of ZR-75-1 breast cancer cells. An inverse relationship exists between the amount of sMUC1 present in a patient's sample and the amount of relative light units (RLUs) detected. RLUs are converted to units per milliliter by plotting RLUs against a standard curve calibrated for each run using highly purified sMUC1. The range of sMUC1 detection for the ACS:180 BR assay is 3.5 to 450 U/mL.
Tissue culture studies
For detection of sMUC1 in tissue culture studies, CA27.29+ RPMI 8226 and S6B45 MM cells, CA27.29-HS Sultan MM cells, and CA27.29+ZR-75-1 breast cancer cells were grown in human plasma. sMUC1 released from ZR-75-1 breast cancer cells is detected by the ACS:BR180 assay, and highly purified sMUC1 from this cell line is used as a calibrator for this assay. Human plasma was used as a culture medium in this detection assay, because the ACS:BR180 assay detects only sMUC1 in serum or plasma, but not in medium alone. To validate this assay, we measured sMUC1 in supernatants of MM cell lines and ZR-75-1 breast cancer cells grown in either medium or human plasma. sMUC1 was only detectable in supernatants when CA27.29+ cells were grown in human plasma. Growth of MM and ZR-75-1 breast cancer cells was similar in human plasma and in RPMI medium plus 10% FBS, evidenced by trypan blue and propidium iodide staining. Culture supernatants were collected after 48 hours of cell growth, and frozen at −80°C until sMUC1 levels were determined. Plasma alone from the same lots was assayed for baseline measurement of sMUC1.
MUC1 antibody assays
Circulating antibodies to MUC1 were determined by use of an ELISA, as previously described.28,36 Briefly, a 60-mer peptide corresponding to 3 tandem repeats of the MUC1 peptide conjugated to bovine serum albumin (BSA) is adsorbed in alternate rows with BSA-only adsorbed wells in 96-well plates. After overnight adsorption, wells were incubated with BSA to block nonspecific adsorption sites. Serum samples were diluted 1:100 (for IgG determinations) and 1:500 (for IgM determinations) and incubated overnight. Immunoglobulins bound to peptides were detected by horseradish peroxidase-conjugated rabbit antihuman IgG or IgM (DAKO A/S, Glostrup, Denmark) diluted 1:10 000. Tetramethylbenzidine was used as a substrate and the reaction was quantified at 450 nm in an ELISA reader. Each serum sample was tested separately for IgM and IgG antibodies. Assays for each sample were performed in duplicate, and results calculated as the mean difference between readings in optical density (OD) units in experimental and control wells. A 4-point standard curve was made for each plate using the HuHMFG1 (1, 05, 0.25, and 0.125 μg/mL) and 2F8 (100, 30, 15, and 5 ng/mL), antibodies for the IgG and IgM determinations, respectively. An arbitrary value of “1” was ascribed to the lowest concentration of the standard antibody and the value of the samples tested was calculated within each plate in relation to the standard curve by least-square regression analysis. The samples with values falling outside the linear region of the curve were retested at higher dilutions. Soluble MUC1 levels were concurrently determined in samples analyzed for IgM and IgG anti-MUC1 antibodies by use of the Enzymum-Test CA15.3 assay (Boerhringer Mannheim, Tutzing, Germany).13
Biostatistics
The statistical significance of differences in measured values was determined with the 2-tailed Student t test using the Microsoft Excel program. A P-value of .05 or less was considered significant. Average values are expressed as mean ± standard deviation.
Results
Expression of the CA27.29 MUC1 epitope on multiple myeloma cell lines
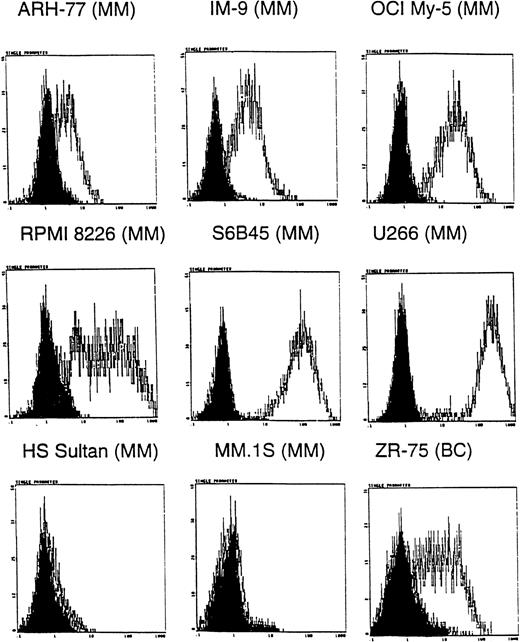
Because many anti-MUC1 mAbs show specificity for certain MUC1 forms31,33 and MM plasma and B cells are known to express MUC1 core protein epitopes,26 we first determined whether the CA27.29 MUC1 epitope was expressed on MM cells. Expression of CA27.29 was determined on 8 MM cell lines, ZR-75-1 breast cancer cells, and HL-60 promyelocytic leukemia cells using indirect flow cytometric analysis. ZR-75-1 breast cancer cells, known to express the CA27.29 epitope, were used as a positive control31; HL-60 cells, which lack MUC1,26 were used as a negative control. As shown in Figure 1, 6 of 8 MM cell lines (ARH-77, IM-9, OCI My-5, RPMI 8226, S6B45, U-266, but not HS Sultan and MM.1S cells) expressed the CA27.29 MUC1 epitope. The intensity of CA27.29 expression was strong on S6B45 and U-266 MM cells; moderate on IM9, OCI My-5, and RPMI 8226 MM cells; and weak for ARH-77 MM cells. CA27.29 was moderately expressed on ZR-75-1 cells (Figure 1) and absent on HL-60 cells (not shown).
Expression of CA27.29 MUC1 epitope on human MM cells.
Human MM (ARH-77, IM9, OCI My-5, RPMI 8226, S6B45, U-266, HS Sultan, and MM.1S) and breast cancer (ZR-75-1) cell lines were examined for expression of the CA27.29 MUC1 epitope by flow cytometry. Shaded peaks denote isotype control staining.
Expression of CA27.29 MUC1 epitope on human MM cells.
Human MM (ARH-77, IM9, OCI My-5, RPMI 8226, S6B45, U-266, HS Sultan, and MM.1S) and breast cancer (ZR-75-1) cell lines were examined for expression of the CA27.29 MUC1 epitope by flow cytometry. Shaded peaks denote isotype control staining.
Expression of the CA27.29 MUC1 epitope on multiple myeloma patient plasma cells and B cells
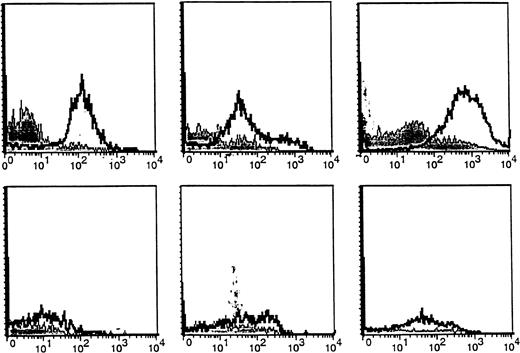
We next compared expression of the CA27.29 MUC1 epitope on freshly obtained BM plasma cells from MM patients versus HDs. BM plasma cells (CD38hi 45RA−/lo scattermod/hi) from MM patients and HDs were analyzed for MUC1 expression using 4 MUC1 directed antibodies: B27.29, AR20.5, VU-4H5, and VU-3C6.18As can be seen in Table 1, 67% ± 15% of BM plasma cells from 5 MM patients expressed CA27.29, whereas fewer (38%-54%) patient BM plasma cells expressed the MUC1 epitopes targeted by AR20.5, VU-4H5, and VU-3C6 mAbs. Importantly, significantly fewer (13% ± 3%, P = .04) HD BM plasma cells expressed CA27.29, relative to patient BM plasma cells. Intensity of CA27.29 expression on patient and HD BM plasma cells is shown in Figure2. CA27.29 expression was moderately to strongly expressed on patient BM plasma cells and weakly expressed or absent on HD plasma cells.
Expression of MUC1 epitopes on multiple myeloma and healthy B-lineage cells in blood and bone marrow
| . | Percentage of cells expressing MUC1 epitopes . | |||
|---|---|---|---|---|
| B27.29 . | AR20.5 . | VU-4H5* . | VU-3C6* . | |
| MM patient cells | ||||
| MM plasma cells (BM) (5) | 67 ± 15† | 54 ± 20† | 55 ± 12† | 38 ± 13† |
| Range | 21-88 | 14-80 | 17-78 | 8-84 |
| MM B cells (PBMCs) (12) | 70 ± 6‡ | 75 ± 4‡ | 85 ± 3 | 57 ± 9 |
| Range | 36-93 | 57-88 | 58-95 | 15-98 |
| Healthy donor cells | ||||
| Plasma cells (BM) (3) | 13 ± 3 | 12 ± 9 | 6 ± 2 | 1 ± 0.4 |
| Range | 8-45 | 2-31 | 1-12 | 1-2 |
| B cells (PBMCs) (4) | 4 ± 1 | 1 ± 0.5 | 49 ± 10 | 64 ± 12 |
| Range | 1-8 | 1-2 | 25-74 | 33-90 |
MUC1 expression on BM plasma cells (CD38hi45RA−/lo scattermod/hi) and PB B cells (CD19+) was determined by flow cytometric analysis using 4 mAbs: B27.29, AR20.5, VU-4H5, and VU-3C6. Values reflect the percentage (mean ± standard error) of plasma cells or B cells that express the MUC1 epitope identified by these mAbs.
MM indicates multiple myeloma; BM, bone marrow; PBMCs, peripheral blood mononuclear cells.
As per Treon et al.26
P < .05 for comparison of MUC1 epitopes for MM patient plasma cells with HD plasma cells.
P < .05 for comparison of MM patient B cells with healthy donor B cells.
Expression of the CA27.29 MUC1 epitope on MM patient and HD BM plasma cells.
CA27.29 expression on bone marrow plasma cells (CD38hi45RA−/lo scattermod/hi) from 3 representative MM patients (upper panels) and 3 representative healthy donors (lower panels) are shown. CA27.29 expression on plasma cells was determined by multiparameter flow cytometry. Shaded peaks denote isotype control staining.
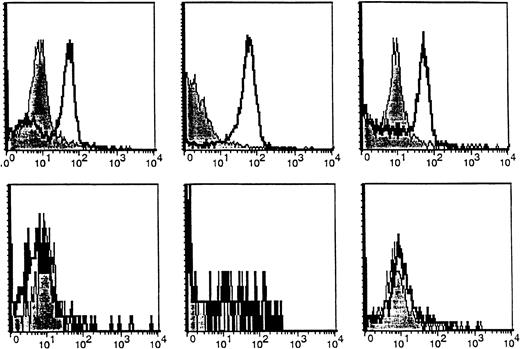
B cells from MM patients and HDs were also examined for CA27.29 expression. In our previous report,26 MM patients and HDs were found to express MUC1 on many of their circulating B cells (49%-64%), evidenced by staining with the VU-4H5 and VU-3C6 mAbs. CA27.29 expression on MM patient B cells (70% ± 6%) was significantly greater than on HD B cells (4% ± 1%) (P = .007). Hence, these studies demonstrate that the majority of MM patient plasma cells and B cells express CA27.29, whereas most HD plasma cells and B cells lack CA27.29 expression. As shown in Figure 3, CA27.29 expression on MM patient B cells was moderate to strong, whereas CA27.29 expression was either weak or absent on HD B cells.
Expression of the CA27.29 MUC1 epitope on MM patient and HD B cells.
CA27.29 expression on peripheral blood B cells (CD19+) from 3 representative MM patients (upper panels) and 3 representative healthy donors (lower panels) are shown. CA27.29 expression on PB B cells was determined by multiparameter flow cytometry. Shaded peaks denote isotype control staining.
Detection of soluble MUC1 in multiple myeloma and breast cancer cell cultures
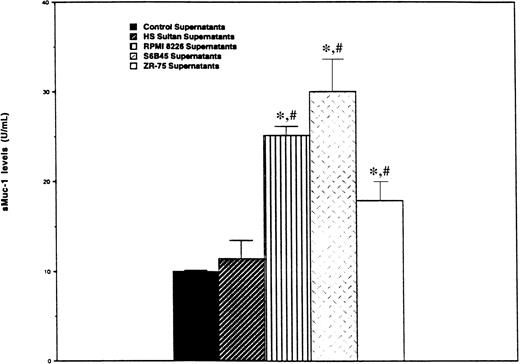
We next determined whether MM cells, like ZR-75-1 breast cancer cells, release sMUC1 that is detected by the ACS:BR180 immunoassay. CA27.29+ RPMI 8226 and S6B45 MM cells, as well as CA27.29-HS Sultan MM cells, were cultured in human plasma for 48 hours, and sMUC1 levels determined in supernatants taken from these cultures. Supernatants from CA27.29+ ZR-75-1 breast cancer cells cultured in human plasma were used as positive controls, and human plasma from the same lot used to determine baseline sMUC1 levels. As can be seen in Figure 4, sMUC1 was detected in the culture supernatants of CA27.29+ RPMI 8226 (25.20 ± 0.96 U/mL) and S6B45 (30.00 ± 3.61 U/mL) MM cells, and in the supernatants of CA27.29+ ZR-75-1 breast cancer cells (17.92 ± 2.11 U/mL). In contrast, sMUC1 levels from CA27.29-HS Sultan cells (11.45 ± 2.06 U/mL) were similar to control plasma (9.97 ± 0.16 U/mL) (P = .314) (Figure4). sMUC1 levels were significantly lower in both control plasma (P < .003) and in HS Sultan culture supernatants (P < .02) than in culture supernatants of either RPMI 8226 and S6B45 MM cells, or ZR-75-1 breast cancer cells.
Detection of sMUC1 release in MM cell line culture supernatants using the CA27.29 immunoassay.
CA27.29+ RPMI 8226 and S6B45 MM cells; CA27.29+ZR-75-1 breast cancer cells, and CA27.29-HS Sultan MM cells were cultured in human plasma. Supernatants were collected after 48 hours of culture, and sMUC1 levels determined using the CA27.29 immunoassay. Human plasma from the same lots was used as control supernatants to determine baseline sMUC1 levels. Experiments were performed in triplicate, and standard deviation bars are displayed. *P < .002 versus sMUC1 levels of control supernatants;#P < .03 versus sMUC1 levels in HS Sultan cell culture supernatants.
Determination of sMUC1 levels in multiple myeloma patient bone marrow plasma and correlation with tumor burden
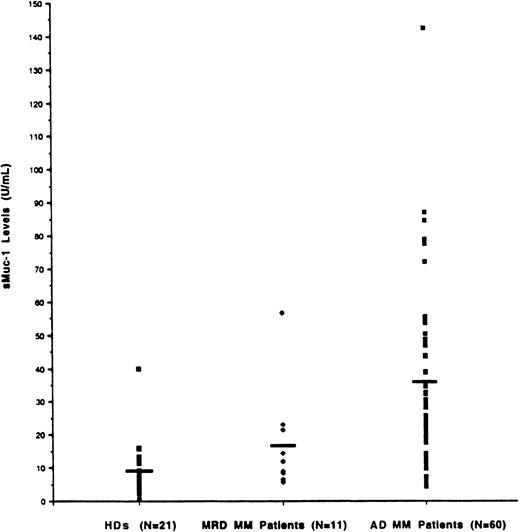
Because tumor cells in MM predominate in the BM, we initially set out to measure sMUC1 levels in the BM plasma from both MM patients and HDs. As seen in Figure 5, sMUC1 levels were significantly higher in MM patient BM plasma (mean 31.76 U/mL, range 5.69-142.48 U/mL) compared with HD BM plasma (mean 9.68 U/mL, range 0.65-39.83 U/mL) (P < .001). BM plasma sMUC1 was also significantly higher in MM patients with active disease (34.62 U/mL, range 5.69-142.48 U/mL) than in MM patients with MRD (16.16 U/mL, range 5.7-56.68 U/mL) (P = .0026). sMUC1 was 16 U/mL or less in 95% of HDs and 73% of MM patients with MRD. In contrast, 80% of MM patients with active disease had BM sMUC1 levels of greater than 16 U/mL.
Determination of sMUC1 levels in MM patients BM plasma and relationship to tumor burden.
sMUC1 levels were determined in BM plasma samples taken from 60 MM patients with active disease (AD), 11 MM patients with minimal residual disease (MRD), and 21 HDs. Mean BM sMUC1 levels were significantly elevated in MM patients with AD (31.76 U/mL) compared with MM patients with MRD (16.16 U/mL; P < .001) and HDs (9.68 U/mL;P < .001).
Determination of sMUC1 levels in multiple myeloma patient peripheral blood plasma
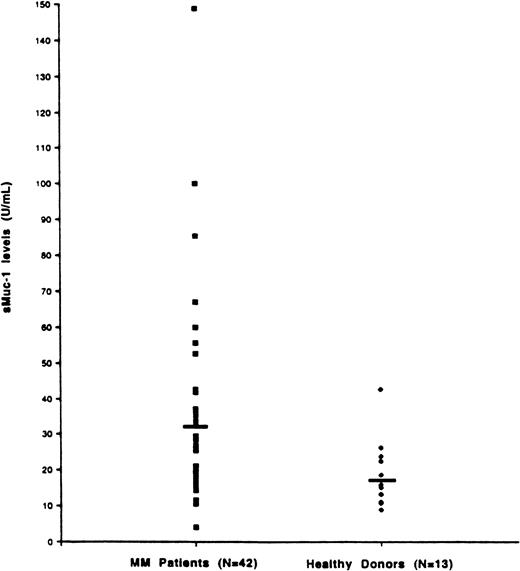
sMUC1 levels were next assessed in PB plasma samples taken from both MM patients and HDs. As seen in Figure6, sMUC1 levels were higher in the PB plasma of MM patients (32.79 U/mL, range 4.15-148.84) when compared with the PB plasma of HDs (18.47 U/mL, range 8.84-42.49 U/mL) (P = .0052). To determine the relationship of sMUC1 levels in both PB and BM plasma in MM patients, sMUC1 levels were measured in 15 MM patients in whom PB and BM plasma were obtained simultaneously (Figure 6). These studies demonstrated that sMUC1 levels were higher for BM plasma (43.40 U/mL, range 7.23-142.48 U/mL) than in PB plasma (31.63 U/mL, range 4.15-148.84 U/mL); however, these differences did not reach statistical significance (P = .167), and it remains possible that small blood vessel breakage occurring during the BM biopsies may have led to BM sample dilution by PB. When intrapatient differences were examined, 9 of 15 MM patients (60%) exhibited higher BM versus PB sMUC1 levels, whereas the remaining 6 of 15 MM patients (40%) had higher PB versus BM sMUC1 levels.
Determination of sMUC1 levels in MM patients PB plasma.
sMUC1 levels were determined for PB samples taken from 42 MM patients and 13 HDs. Mean PB sMUC1 levels were significantly elevated for MM patients (32.79 U/mL) compared with HDs (18.47 U/mL) (P = .005).
Determination of sMUC1 levels in MM patients PB plasma.
sMUC1 levels were determined for PB samples taken from 42 MM patients and 13 HDs. Mean PB sMUC1 levels were significantly elevated for MM patients (32.79 U/mL) compared with HDs (18.47 U/mL) (P = .005).
Detection of anti-MUC1 antibodies in multiple myeloma patients
Because anti-MUC1 antibodies circulate in patients with other MUC1-bearing malignancies, we next determined the levels of IgM and IgG anti-MUC1 antibody levels in both MM patients and HDs. Both IgM and IgG antibodies to MUC1 were detected in MM patients; however, the mean levels of both IgM- and IgG-circulating antibodies were lower than those detected in HDs (Table 2). Concurrently, we also measured sMUC1 levels by using the CA15.3 assay in the same MM patient and HD samples that were used to determine anti-MUC1 antibody levels. Analogous to our results with the CA27.29 assay, sMUC1 were significantly higher in MM patients versus HDs (P < .001), and mean sMUC1 levels were inversely related to mean anti-MUC1 antibody levels among MM patients and HDs (Table 1).
Circulating anti-MUC1 antibody and soluble MUC1 levels in myeloma patients and healthy donors
| . | MUC1 IgM (OD) . | MUC1 IgG (OD) . | sMUC1 (U/mL) . |
|---|---|---|---|
| MM patients (n = 113) | |||
| Mean | 0.266 ± 0.265* | 0.360 ± 0.292† | 20.7 ± 17.1‡ |
| Median | 0.175 | 0.271 | 18.3 |
| Range | 0.033-1.479 | HD-1.238 | 2.2-125.5 |
| Healthy donors (n = 31) | |||
| Mean | 0.651 ± 0.290 | 0.462 ± 0.276 | 10.7 ± 6.3 |
| Median | 0.608 | 0.440 | 9.0 |
| Range | 0.230-1.521 | 0.147-1.442 | 2.4-27.4 |
OD indicates optical density; MM, multiple myeloma.
P < .001 when compared with healthy donor values.
P = .078 when compared with healthy donor values.
P < .001 when compared with healthy donor values.
Discussion
We and others have previously reported that MM patient plasma cells14,23-26 and B cells26 express MUC1. Reports of elevated sMUC1 levels in patients with MUC1-bearing adenocarcinomas7-13 prompted us to measure this factor in MM patient BM and PB plasma using an immunoassay that detects the CA27.29 epitope of MUC1. The CA27.29 epitope was identified on most MM cell lines (75%), MM patient plasma cells (67%), and MM patient circulating B cells (70%), but only expressed on a minority of HD plasma cells (13%) and circulating B cells (4%).
The predominant expression of CA27.29 on MM cells may facilitate detection of MM-associated versus healthy cell-derived sMUC1, as has been reported in patients with adenocarcinomas.38Expression of the CA27.29 epitope on MM plasma cells and B cells may also be important in understanding clonality in MM. Prior studies have shown that circulating MM patient B cells have identical IgH rearrangements and similar chromosomal abnormalities, N-ras mutations, and CD45RO isoforms as autologous plasma cells, suggesting that these circulating B cells (termed clonotypic B cells) are within the malignant clone.39-46 The finding that CA27.29 is expressed on circulating MM patient B cells and plasma cells, coupled with its absence on HD B cells and plasma cells, further suggests that circulating B cells in MM patients are different than healthy B cells and may therefore be within the malignant clone.
In addition to detecting the CA27.29 epitope on MM cell lines, as well as MM patient plasma cells and B cells, we also identified this antigen in the culture supernatants of CA27.29 epitope–positive RPMI 8226 and S6B45 MM cells. These studies therefore show that the ACS:BR180 immunoassay, which is FDA cleared, is capable of detecting sMUC1 released by MM cells. Using this immunoassay, we showed that sMUC1 is detected at significantly higher levels in the BM and PB plasma of MM patients versus HDs. These findings were confirmed with the CA15.3 assay that targets the 115D8 and DF3 MUC1 antigen, the latter of which is widely expressed on MM cells.26 These findings are also consistent with the earlier reports of Takahashi et al,14 who measured sMUC1 levels in MM patients and HDs using the MUSE11 mAb. We demonstrated 3-fold higher mean levels of sMUC1 in the BM plasma of MM patients versus HDs using the CA27.29 assay. Importantly, we then correlated sMUC1 levels with extent of disease. MM patients with active disease showed significantly higher mean levels of BM plasma sMUC1 when compared with MM patients with minimal disease or HDs. Given our demonstration of CA27.29 on MM plasma cells and B cells, these higher levels of sMUC1 in active MM patients may reflect a greater burden of MM cells (MM plasma cells, MM B cells, or both). Although these malignant cells may be the source of sMUC1, it also remains possible that MM cells trigger release of sMUC1 from other cells which contribute, at least in part, to the elevated sMUC1 levels found in MM patients. Our finding that sMUC1 levels are elevated in concomitant BM and PB plasma patient samples suggests that measuring PB sMUC1 may have clinical utility, which must be assessed in future large prospective clinical trials.
Interestingly, sMUC1 levels were negatively correlated to anti-MUC1 antibody levels, particularly for IgM anti-MUC1 antibody levels in MM patients. Richards et al27 have similarly reported an inverse relationship of sMUC1 levels to IgM anti-MUC1 antibody levels in ovarian cancer patients. Because sMUC1 may circulate in complex with anti-MUC1 antibodies,9 decreased circulating antibodies to MUC1 in MM patients may result from immune complex formation and deposition, from binding to MUC1-bearing tumor cells, or from diminished normal immunoglobulin synthesis, which is commonly observed in MM patients. It is also possible that a diminished humoral response to MUC1 in MM patients may result from prior chemotherapy exposure, as suggested by the recent works of Vose et al47 and Kaminski et al48 with the 131I-conjugated murine monoclonal antibody, tositumomab. A greater than 10-fold increase in incidence of human antimurine antibody (HAMA) production to tositumomab was observed in patients receiving this agent as primary therapy versus postchemotherapy.47 48 Lastly, it remains possible that the extent of MUC1 underglycosylation may be insufficient on MM cells to permit cryptic epitope exposure and antibody formation, thereby accounting for diminished MUC1 antibody response in MM patients.
In summary, we have detected the CA27.29 MUC1 epitope on a majority of MM cell lines, MM patient cells, and MM B cells. Using an FDA-cleared CA27.29 immunoassay, we have shown that sMUC1 levels are elevated in the BM and PB plasma of MM patients, and that BM sMUC1 levels are related to MM disease burden. In contrast, anti-MUC1 antibody levels were decreased in MM patients. Ongoing studies are examining the immunobiologic role that sMUC1 and anti-MUC1 antibodies play in MM.
Supported by an American Society of Clinical Oncology Young Investigator Award (S.P.T.), the International Myeloma Foundation (S.P.T.), the Multiple Myeloma Research Foundation (S.P.T.), the Alberta Cancer Board Research Initiatives Program (L.M.P./A.R.B.), and the Doris Duke Distinguished Clinical Research Scientist Award (K.C.A.).
The publication costs of this article were defrayed in part by page charge payment. Therefore, and solely to indicate this fact, this article is hereby marked “advertisement” in accordance with 18 U.S.C. section 1734.
References
Author notes
Kenneth C. Anderson, Division of Hematologic Malignancies, Dana Farber Cancer Institute, 44 Binney St, Boston MA 02115; e-mail: kenneth_anderson@dfci.harvard.edu.

This feature is available to Subscribers Only
Sign In or Create an Account Close Modal