Key Points
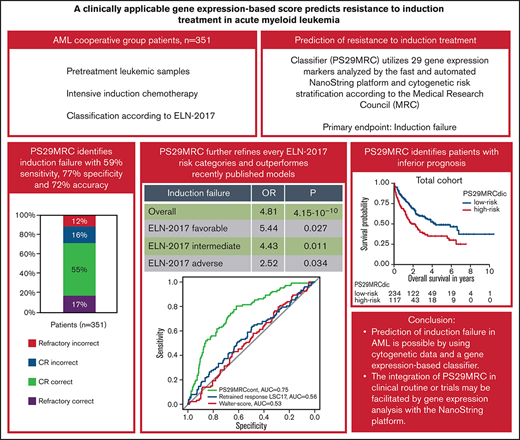
Prediction of induction failure in AML is possible using cytogenetic data and a gene expression–based classifier.
Integration of PS29MRC in the clinical routine or trials may be facilitated by gene expression analysis with the NanoString platform.
Abstract
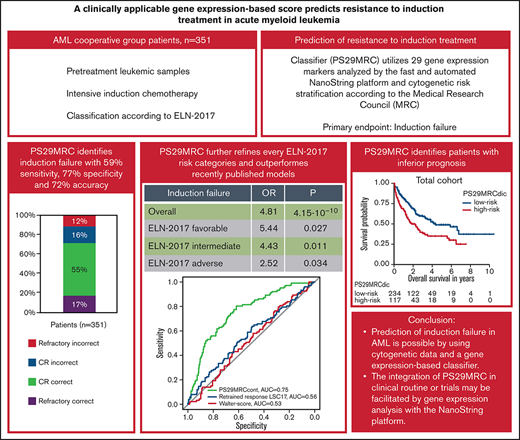
Prediction of resistant disease at initial diagnosis of acute myeloid leukemia (AML) can be achieved with high accuracy using cytogenetic data and 29 gene expression markers (Predictive Score 29 Medical Research Council; PS29MRC). Our aim was to establish PS29MRC as a clinically usable assay by using the widely implemented NanoString platform and further validate the classifier in a more recently treated patient cohort. Analyses were performed on 351 patients with newly diagnosed AML intensively treated within the German AML Cooperative Group registry. As a continuous variable, PS29MRC performed best in predicting induction failure in comparison with previously published risk models. The classifier was strongly associated with overall survival. We were able to establish a previously defined cutoff that allows classifier dichotomization (PS29MRCdic). PS29MRCdic significantly identified induction failure with 59% sensitivity, 77% specificity, and 72% overall accuracy (odds ratio, 4.81; P = 4.15 × 10⁻¹⁰). PS29MRCdic was able to improve the European Leukemia Network 2017 (ELN-2017) risk classification within every category. The median overall survival with high PS29MRCdic was 1.8 years compared with 4.3 years for low-risk patients. In multivariate analysis including ELN-2017 and clinical and genetic markers, only age and PS29MRCdic were independent predictors of refractory disease. In patients aged ≥60 years, only PS29MRCdic remained as a significant variable. In summary, we confirmed PS29MRC as a valuable classifier to identify high-risk patients with AML. Risk classification can still be refined beyond ELN-2017, and predictive classifiers might facilitate clinical trials focusing on these high-risk patients with AML.
Introduction
Despite recent advances and the introduction of novel drugs, most patients with acute myeloid leukemia (AML) who are treated with curative intent receive physically demanding intensive chemotherapy consisting of cytarabine and anthracyclines.1 The majority of these patients achieve complete remission (CR), but 20% to 40% of younger patients and 40% to 60% of older patients do not respond to the initial treatment.1,2 About half of patients with primary refractory disease (RD) die within 6 months.3 Because patient outcomes remain poor, even with salvage therapy followed by allogeneic stem cell transplantation, treatment of patients with RD is extremely challenging.4 The ability to predict primary RD would prevent patients with AML from undergoing ineffective intensive treatment.
Several prognostic markers for patients with AML that provide information about the overall outcome and help to guide treatment decisions are routinely used in the clinic. The 2017 European Leukemia Network (ELN-2017) guidelines classify patients into “favorable,” “intermediate,” and “adverse” risk groups.1 With regard to the effect of a therapeutic intervention, some predictive classifiers are primarily geared toward forecasting RD. The model published by Walter et al integrates clinical information, laboratory data, and molecular genetic analysis of patients at initial diagnosis.5 Age, cytogenetics according to the Medical Research Council (MRC), and NPM1/FLT3-ITD status were the most significant predictive covariates.5,6 Another predictive model by Ng et al is derived from the prognostic 17-gene leukemia stem cells score (LSC17).7 Gene expression analysis of 6 retrained response LSC17 genes was performed using the NanoString platform.7 The retrained response LSC17 signature proved to be of predictive value.5,7 However, these existing predictors are not refined or specific enough to be sufficient for clinical use. Therefore, more precise classifiers are necessary to guide treatment decisions and facilitate clinical trials aimed at this high-risk population of AML patients.
We recently published a predictive classifier based on the analysis of cytogenetic data and 29 gene expression markers (Predictive Score 29 Medical Research Council; PS29MRC).8 Prediction of RD at initial diagnosis of AML can be achieved with high accuracy using PS29MRC (77%). The classifier was developed using cohorts analyzed by gene expression microarrays (n = 856) and validated in a cohort measured by RNA sequencing (n = 250). Because prompt and reproducible gene expression analysis is vital for PS29MRC to be incorporated into trials or the clinical routine, we identified the 29 gene expression markers in this study using the fast and automated NanoString platform, which is already used for the risk calculation of recurrence in breast cancer.9 The NanoString method is based on direct digital detection of messenger RNA (mRNA) molecules of interest using target-specific color-coded probe pairs.10 Even mRNA samples with less-than-ideal quality can be measured precisely and in a short period of time.10 We set out to transfer PS29MRC to a clinically applicable platform and validate its predictive performance and prognostic value in an independent multicenter cohort of patients who recently underwent intensive treatment.
Patients and methods
Patients and inclusion criteria
This study included 384 intensively treated patients who were enrolled in the multicenter German AML Cooperative Group (AMLCG) Registry (DRKS00020816) between 2009 and 2019. Only adult patients (≥18 years) with newly diagnosed AML (de novo or secondary to myelodysplastic syndromes or therapy-related) and material available for analysis were included. The diagnosis of AML was made according to the World Health Organization (WHO) 2008 criteria.11 Patients with acute promyelocytic leukemia or extramedullary disease without systemic involvement were excluded. All patients were treated with intensive front-line induction therapy: sequential high-dose cytarabine and mitoxantrone (n = 226, 59%), cytarabine and anthracyclines (7 + 3; n = 121, 31%), and other intensive regimens such as thioguanine, cytarabine, and daunorubicin and/or cytarabine and mitoxantrone [TAD-HAM, HAM(-HAM); n = 37, 10%].12 Second induction or salvage treatment following AMLCG recommendations was given whenever possible in case of RD after the first induction cycle. Cytogenetic and genetic analyses and measurement of the FLT3-ITD allelic ratio were performed centrally, as recently reported.12 Following its approval, 15 patients received the FLT3 inhibitor midostaurin during induction treatment.13 The AMLCG Registry was approved by the ethics committee of Technische Universität Dresden (EK 98032010) and is registered in the German Clinical Trials Register (DRKS00020816). Written informed consent was obtained from all participants. Ethic committees of the participating institutions approved all protocols, and patients were treated according to the Declaration of Helsinki.
Sample collection, RNA purification, and measurement of gene expression
Pretreatment leukemic marrow samples (n = 320; 83%) or blood samples (n = 64, 17%) were processed using a Ficoll-Paque gradient and stored at −80°C at the Laboratory for Leukemia Diagnostics, University Hospital of Munich. The median percentage of marrow and blood blasts was 68.5% (range, 9-97%) and 11.5% (range, 0-98%), respectively. Samples with detectable blasts in marrow or blood were processed further. RNA was isolated using a QIAcube robotic workstation, according to the RNeasy protocol (QIAGEN, Hilden, Germany). The quality and concentration of total RNA were assessed using a NanoDrop ND-1000 spectrophotometer (Thermo Fisher Scientific, Wilmington, DE). Samples with a concentration > 20 ng/µL and purity with an A260/A280 ratio of 1.5 to 2.3 were used for further analysis (n = 373).
For NanoString gene expression profiling, a customized set of barcoded probes containing the 29 genes of interest was used for analysis (CodeSet). Six positive controls, spiked-in at fixed proportional concentrations, and 8 negative controls, used to assess background and nonspecific binding, were included as recommended by the manufacturer (NanoString Technologies, Seattle, WA). The 4 housekeeping genes (ABL, GAPDH, PGK1, RPS27) were also part of the CodeSet (for details see supplemental Table 1).
The analyses were performed on an nCounter FLEX Analysis System, which is approved for clinical diagnostics applications, such as the US Food and Drug Administration–approved Prosigna test.9 Hybridization between target mRNA and reporter-capture probe pairs was performed according to the NanoString protocol. The hybridized samples were then processed by a fully automated nCounter Prep station robot.10 After placing the cartridge in the nCounter Digital Analyzer, data were collected by taking magnified images of the immobilized fluorescent reporters with a CCD camera.10
Results from digital data acquisition were processed using nSolver 4.0 Analysis Software (NanoString Technologies). Raw data were evaluated using several quality control metrics to measure imaging quality, oversaturation, and overall signal/noise ratio. Gene expressions of all samples meeting quality control metrics (n = 368) were log transformed and normalized using the default settings.
In a pilot study, we performed gene expression analysis using NanoString on a cohort of 48 pretreatment leukemic samples from our previous study, allowing us to compare gene expression values measured by Affymetrix microarrays with those analyzed by the novel platform on the same data set (supplemental Figure 1).8 To transfer the previously defined optimal cutoff value onto the score calculated using NanoString expression values, we created dichotomous scores for NanoString data using different cutoff values and compared their classification concordance with the original score. The optimal cutoff was chosen as the one maximizing the concordance between the 2 scores (new cutoff = 0.4). Of note, the outcome of patients was not used for recalculating the score; only gene expression data measured by the 2 platforms on the same patient cohort were compared.
Statistical analyses
For the terms “prognostic” and “predictive” we used the definitions proposed by Clark et al.14 Primary outcome was treatment failure: RD, partial remission, death in aplasia, or death due to indeterminate cause. Response criteria were defined according to ELN-2017 (for a more detailed discussion of end point definition see supplemental Appendix).1 Patients without cytogenetic data (n = 9) or evaluation of induction response (n = 8) were excluded. Overall survival (OS) was defined as the time from AML diagnosis to death from any cause and was censored at the time of the last follow-up.
PS29MRC was calculated as the weighted linear sum of 29 gene expression values and cytogenetic classification, according to the MRC.6,8 The formula for PS29MRC is given in the supplemental Appendix.
The χ2 test was used to compare categorical variables, whereas the Mann-Whitney U test was applied for continuous variables. Adjustment for multiple hypothesis testing was performed using the Benjamini-Hochberg procedure.15 Time to event variables were analyzed with the Kaplan-Meier method and Cox proportional hazards regression model. Logistic regression was applied to analyze the association of variables with the treatment outcome. All statistical analyses were performed with statistical software R (version 4.0.3; R Foundation for Statistical Computing, Vienna, Austria).
Results
Patient characteristics
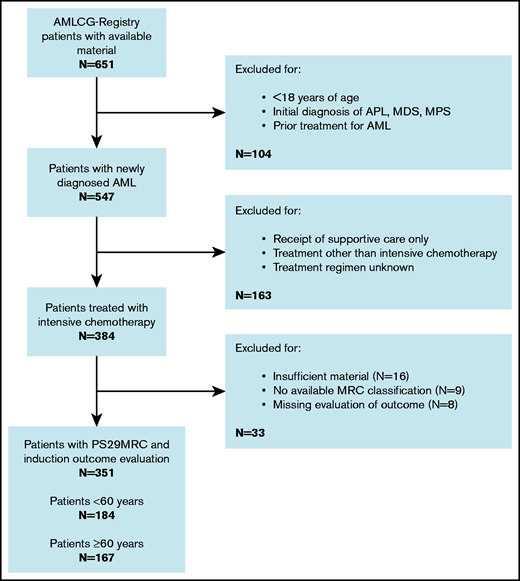
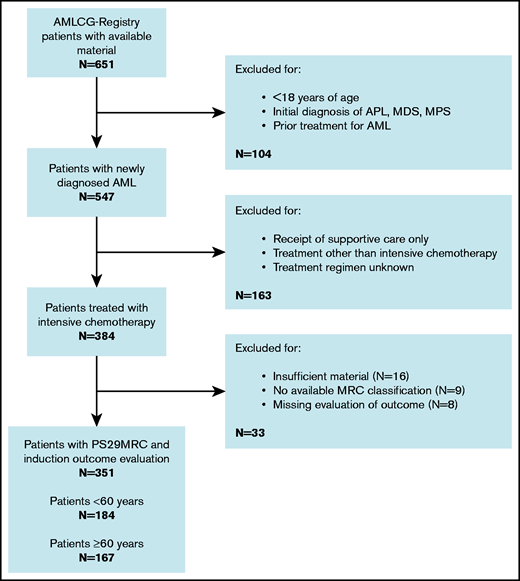
A flowchart of the study is given in Figure 1. Treatment outcome and the predictive score were available for 351 patients, with 249 (71%) responses (197 CRs, 52 CRs with incomplete hematologic recovery) and 102 patients (29%) showing evidence of therapy failure (68 RDs, 11 partial remissions, 10 deaths in aplasia, 13 deaths due to indeterminate cause). Most patients (292, 83%) were diagnosed with de novo AML, according to WHO criteria.16 The cohort was evenly distributed between younger patients (<60 years; 184, 52%) and older patients (≥60 years; 167, 48%). The median age was 58 years (range, 18-87). Induction failure was observed more frequently in older patients (n = 67, 40%) than in younger patients (n = 35, 19%). Several studies did not show any significant differences in outcome between the treatment regimens included in this analysis.17,18 However, an analysis of patients receiving different treatment regimens is provided in the results section of the supplemental Appendix. The median follow up was 3.3 years. The patients’ baseline characteristics are presented in supplemental Table 2.
Consort diagram. APL, acute promyelocytic leukemia; MDS, myelodysplastic syndrome; MPS, myeloproliferative syndrome.
Consort diagram. APL, acute promyelocytic leukemia; MDS, myelodysplastic syndrome; MPS, myeloproliferative syndrome.
Predictive value of the continuous score in the total cohort and risk subgroups
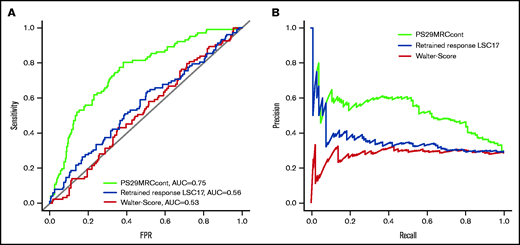
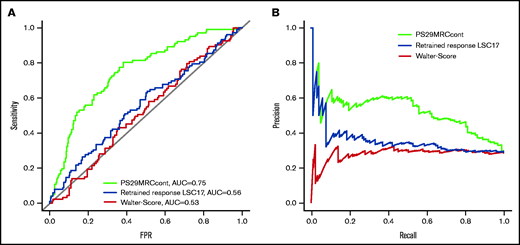
The continuous score (PS29MRCcont) was predictive of treatment failure with an odds ratio (OR) of 2.37 (95% confidence interval [CI], 1.82-3.18; P = 1.20 × 10⁻⁹) and an area under the receiver operating characteristic curve (AUC) of 0.75 (Figure 2). Because the score includes the MRC classification of AML, we wanted to test the independent predictive value of its gene expression components by evaluating the score within different MRC groups.6 MRC classification was available for 351 patients (favorable: n = 33, 10%; intermediate: n = 250, 71%; adverse: n = 68, 19%). The score was predictive for induction failure in the intermediate-risk (OR, 2.75; 95% CI, 1.82-4.36; P = 5.66 × 10⁻⁶) and adverse-risk (OR, 1.87; 95% CI, 1.15-3.38; P = .021) groups. It did not reach significance in the favorable-risk group (OR, 18.13; 95% CI, 0.93-12366.72; P = .22), likely because of the small number of treatment failures (n = 3). Furthermore, we tested the score in the risk groups defined by the ELN-2017 classification.1 ELN-2017 classification, PS29MRCcont, and outcome were available for 301 patients. The categories were more evenly distributed (favorable: n = 129, 43%; intermediate: n = 68, 23%; adverse: n = 104, 35%). The score was significantly predictive of treatment failure in the favorable-risk group (OR, 3.45; 95% CI, 1.50-9.12; P = 6.59 × 10⁻³) and the adverse-risk group (OR, 1.73; 95% CI, 1.18-2.71; P = 9.92 × 10⁻³). It reached borderline significance in the intermediate subgroup (OR, 1.85; 95% CI, 1.06-4.01; P = .064). An overview of the subgroup analysis is given in supplemental Table 3. PS29MRCcont was able to identify patients at high risk for treatment failure in various risk subgroups. The score was well calibrated for the first half of the predicted values, but it overestimated the risk for patients with very high scores. However, the number of patients with very high predicted risk was rather small, which might have influenced the poor calibration for these values (supplemental Figure 2).
Comparison of different predictive classifiers of induction failure in AML. Receiver operating curves (A) and precision-recall curves (B) comparing the prediction of induction failure of PS29MRC, the clinical score of Walter et al, and the retrained response LSC17 score.
Comparison of different predictive classifiers of induction failure in AML. Receiver operating curves (A) and precision-recall curves (B) comparing the prediction of induction failure of PS29MRC, the clinical score of Walter et al, and the retrained response LSC17 score.
Performance of PS29MRC in comparison with other predictive classifiers
We compared the PS29MRCcont with the clinical model of Walter et al5 and the gene expression–based retrained response LSC17 score of Ng et al.7 To examine the predictive ability of each model, we analyzed the AUC accordingly and compared the values with PS29MRCcont (Figure 2). The clinical score of Walter et al and an assessment of the induction response were available for 342 of 384 patients. The score reached an AUC of 0.53 (OR, 1.00; 95% CI, 0.98-1.01; P = .66). The individual score components that significantly predicted induction outcomes were age (OR, 1.04; 95% CI, 1.02-1.06; P = 1.37 × 10⁻⁴), favorable cytogenetics (OR, 0.23; 95% CI, 0.05-0.66; P = .016), adverse cytogenetics (OR, 2.33; 95% CI, 1.35-4.01; P = 2.22 × 10⁻³), and NPM1 mutations in the absence of FLT3-ITD (OR, 0.45; 95% CI, 0.23-0.83; P = .015). The diagnosis of secondary AML (OR, 1.70; 95% CI, 0.96-2.94; P = .063) was slightly above the level of significance. The Eastern Cooperative Oncology Group Performance Status (ECOG), sex, white blood count, platelets, bone marrow blasts, and a mutated FLT3-ITD status did not reach the level of significance (supplemental Table 4). The retrained response LSC17 score is calculated as a weighted linear sum of 6 LSC17 gene expressions (MMRN1, KIAA0125, CD34, GPR56, LAPTM4B, NYNRIN) and was available for 360 patients.7 The score reached an AUC of 0.56 (OR, 1.001; 95% CI, 1.000-1.002; P = .046). When comparing the ability to predict induction failure, PS29MRCcont was superior to the clinical score of Walter et al and the retrained response LSC17 score in univariate and multivariable analyses.
Predictive value of the dichotomous score in risk subgroups
When applying the cutoff defined in our previous study, PS29MRCdic was highly significant in the prediction of treatment failure (OR, 4.81; 95% CI, 2.95-7.93; P = 4.15 × 10⁻¹⁰). Although the specificity for RD was high (77%), the sensitivity of PS29MRCdic was only moderate (59%), reaching an overall accuracy of 72% (Table 1). When excluding patients with death in aplasia or death due to indeterminate cause (n = 23), the sensitivity of the classifier improved slightly from 59% to 62% (for a more detailed analysis see supplemental Appendix).
Of 351 patients with available induction results and MRC classification, 117 (33%) were considered PS29MRCdic high risk. The median OS for PS29MRCdic high-risk patients was 1.8 years, whereas it was 4.3 years for PS29MRCdic low-risk patients. The classifier showed an accuracy of 91%, 73%, and 59% within the favorable-risk (n = 33; nonresponder: n = 0/3; responder: n = 30/30), intermediate-risk (n = 250; nonresponder: n = 33/69; responder: n = 149/181), and adverse-risk (n = 68; nonresponder: n = 27/30; responder: n = 13/38) MRC subgroups, respectively (supplemental Table 5). Furthermore, we tested the dichotomized score in the risk groups as defined by ELN-2017. ELN-2017 and outcome variables were available for 301 patients. In the favorable-risk (n = 129; nonresponder: n = 4/17, responder: n = 106/112), intermediate-risk (n = 68; nonresponder: n = 10/21, responder: n = 39/47), and adverse-risk (n = 104; nonresponder: n = 37/48, responder: n = 24/56) ELN-2017 subgroups, PS29MRCdic reached an accuracy of 85%, 72%, and 59%, respectively (supplemental Table 6). The score was predictive of treatment failure in the favorable-risk (OR, 5.44; 95% CI, 1.26-21.72; P = .017), intermediate-risk (OR, 4.43; 95% CI, 1.43-14.44; P = .011), and adverse-risk (OR, 2.52; 95% CI, 1.09-6.11; P = .034) groups. The dichotomous score significantly predicted induction failure in younger patients (<60 years; OR, 3.10; 95% CI, 1.41-6.80; P = 4.57 × 10⁻³) and older patients (≥60 years; OR, 5.26; 95% CI, 2.72-10.46; P = 1.25 × 10⁻⁶) (supplemental Table 3).
Prognostic value of PS29MRC
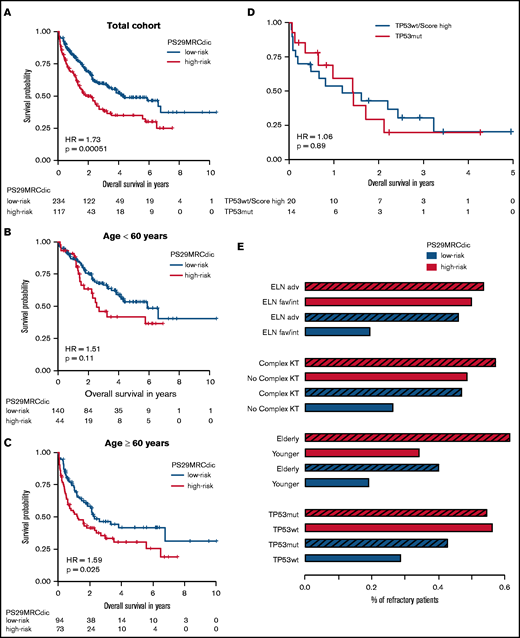
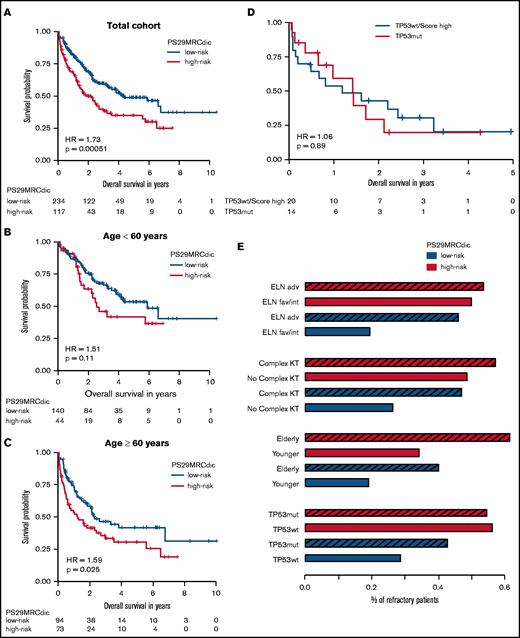
RD is associated with inferior survival. Since PS29MRC was predictive of RD, we performed survival analysis. The continuous classifier (hazard ratio [HR], 1.38; 95% CI, 1.21-1.58; P = 2.62 × 10⁻⁶) and the dichotomous classifier (HR, 1.73; 95% CI, 1.27-2.37; P = 5.12 × 10⁻⁴) were significant prognostic markers. We observed an inferior OS among PS29MRCdic high-risk patients, particularly within the older subgroup (HR, 1.59; 95% CI, 1.06-2.39; P = .025) (Figure 3A-C). A prognostic analysis of relapse-free survival is provided in supplemental Appendix.
PS29MRCdic identifies patients with AML with inferior prognosis. Kaplan-Meier curve showing outcomes of patients according to the PS29MRC risk groups. (A) Outcomes of all patients. (B) Outcomes of patients younger than 60 years. (C) Outcomes of patients ≥60 years of age. (D) Comparison of patients with TP53 mutations and patients without a TP53 mutation, but with high PS29MRC values (top 10%). (E) Proportions of RD in groups defined by 4 risk factors (ELN-2017, complex karyotype, age, TP53 ), and the PS29MRCdic high-risk group within each risk category. The striped bar represents the high-risk category for each risk factor. adv, adverse risk; fav, favorable risk; int, intermediate risk; KT, karyotype; mut, mutated, wt, wild-type.
PS29MRCdic identifies patients with AML with inferior prognosis. Kaplan-Meier curve showing outcomes of patients according to the PS29MRC risk groups. (A) Outcomes of all patients. (B) Outcomes of patients younger than 60 years. (C) Outcomes of patients ≥60 years of age. (D) Comparison of patients with TP53 mutations and patients without a TP53 mutation, but with high PS29MRC values (top 10%). (E) Proportions of RD in groups defined by 4 risk factors (ELN-2017, complex karyotype, age, TP53 ), and the PS29MRCdic high-risk group within each risk category. The striped bar represents the high-risk category for each risk factor. adv, adverse risk; fav, favorable risk; int, intermediate risk; KT, karyotype; mut, mutated, wt, wild-type.
TP53 mutations in AML are associated with a dismal outcome; therefore, this very high–risk subgroup of patients requires special attention.12 In our cohort, patients with mutated TP53 (n = 14) had a median OS of only 1.4 years. Patients who were among the 10% with the highest PS29MRC score, but who did not have a TP53 mutation, had a survival comparable to patients with a TP53 mutation (Figure 3D). Moreover, patients without a TP53 mutation, but with a high-risk PS29MRCdic, had a higher probability for RD than did patients with a TP53 mutation (Figure 3E). Likewise, patients with other risk factors, such as a complex karyotype or older age, had a similar risk for RD as did patients without the risk factor, but with a high-risk PS29MRCdic (Figure 3E).
Individual risk prediction
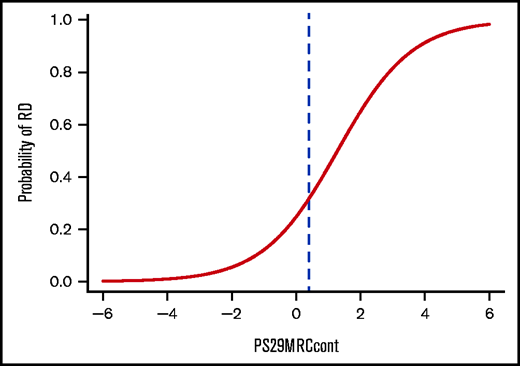
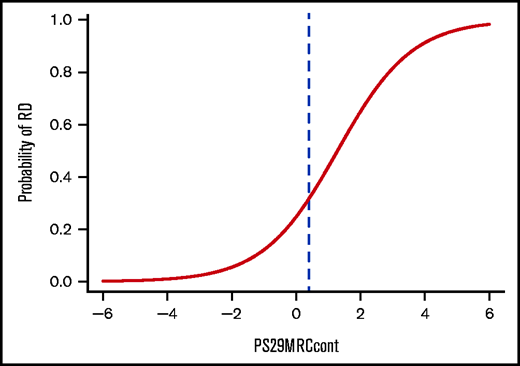
To help guide decision making for physicians, as well as for patients, we calculated the individual risk of induction failure using PS29MRCcont (Figure 4). Each score is associated with a percentage of the patient’s risk of not responding to intensive chemotherapy at the time point of their initial diagnosis. PS29MRCcont ranges from −5.91 to 5.72 (median, −0.01). Although patients with high PS29MRCcont scores tend to fare poorly, more favorable outcomes are observed in patients with low PS29MRCcont scores. Patients with a PS29MRCcont ≥ 4.0 have a ≥90% risk for RD, and patients with a PS29MRCcont score of −1.0 or less have a probability of induction failure that is <10%.
Individual risk prediction in patients with AML. Plot showing the probability of induction failure with a cutoff at PS29MRCcont = 0.4 (blue dashed line).
Individual risk prediction in patients with AML. Plot showing the probability of induction failure with a cutoff at PS29MRCcont = 0.4 (blue dashed line).
Multivariate analysis
Because PS29MRCcont and the dichotomous classifier were highly significant in predicting induction failure in univariate models, we also performed multivariable analysis with predictive variables having a P value ≤ .10 in univariate analysis (Table 2). In multivariate analysis, only PS29MRCdic and age remained significant in the model. Additionally, we used these variables to perform forward and backward selection with the Akaike information criterion as the selection criterion. Forward and backward selection chose the optimal model as the one consisting of PS29MRCdic, age, and ELN-2017. In forward selection, PS29MRCdic was the first variable to enter the model. When analyzing the subgroup of older patients (≥60 years), the dichotomous score was the only variable that was significantly associated with RD (Table 3).
Comparable results were seen with PS29MRCcont (supplemental Table 7). A multivariable model with prognostic variables is provided in supplemental Table 8.
Discussion
In this study, PS29MRC was successfully transferred to the NanoString platform and independently validated in a multicenter AML patient cohort that was treated between 2009 and 2019. This analysis further confirms the predictive and prognostic value of PS29MRC.
The NanoString platform is routinely used in stratifying the risk of breast cancer recurrence and is widely available.9,19 Gene expression measurements using NanoString are highly robust, reproducible, and fast.20 Automated RNA preparation and measurement can be conducted within 2 days. The platform allows physicians to immediately apply PS29MRC and presents a method for the translation of the classifier into clinical trials and practice.
We also transferred and validated a previously defined threshold to the novel platform. The threshold can be used to identify patients with a high risk for induction failure, although larger patient cohorts would probably be necessary to find a more optimal cutoff for the NanoString platform. Although the sensitivity for predicting patients with induction failure was only moderate (59%), the specificity was high (77%). A more refined cutoff may improve sensitivity.
Furthermore, the classifier reached a fair predictive performance with an AUC of 0.75, which is remarkable in this field, although there is still room for improvement. Additional factors not captured by the classifier seem to influence response to treatment. Important risk factors, such as age or gene mutations, are not reflected in the score. Additional omics data (eg, methylation profiling) or more recently identified prognostic factors (eg, splicing profiles) may have the potential to refine our models.21,22
Clinical classifiers must always be viewed in connection with the analyzed end point. Several classifiers, such as the AML score or PINA score, help to estimate complete remission and early death rate in patients ≥60 years of age or the probabilities of OS.23,24 We decided to focus our analysis on the important end point RD and compared our classifier with 2 of the most important and well-known models: the clinical score of Walter et al and the retrained response LSC17 score.
PS29MRC outperformed these clinical or gene expression–based classifiers.5,7 The reasons for this are speculative, but some possibilities are discussed below. The clinical score of Walter et al and the retrained response LSC17 score were developed using data sets from patients who were primarily treated in the 1990s or early 2000s. Since then, substantial improvements in supportive care have been included in clinical management. The patients in our cohort were treated within the last 10 years, most of them within the last 5 years (n = 227; 65% of patients treated between 2015 and 2019), which may account for some differences. Another factor might be that PS29MRC combines the prognostic information of cytogenetics with gene expression variables. Previous classifiers relied only on gene expression analysis or a combination of cytogenetics, a few mutations, and clinical variables. It seems that the combination of gene expression data and cytogenetics, as achieved in PS29MRC, summarizes information from 2 worlds and results in a more powerful predictor.
In the context of different end points only achieved after CR (eg, relapse-free survival), PS29MRC performed far less effectively (supplemental Appendix). It is tempting to speculate that the mechanisms of resistance and relapse differ and are not represented equally by the classifier designed to specifically identify RD.
In several analyses, we were able to demonstrate that PS29MRC added predictive and prognostic information to subgroups defined by MRC, ELN-2017, or age. Particularly, the score significantly predicted RD within older patients and was the only predictive variable left in the multivariate model. In addition, PS29MRC identifies very high-risk patients who have an equally dismal prognosis as those with TP53 mutations who are not identified by current classification approaches.
Older and very high–risk patients resemble subgroups of high clinical relevance, and clinicians are familiar with discussions if a patient benefits from intensive induction treatment. This discussion gained further relevance as the result of the implementation of alternative treatment regimens that showed promising results.25 As an example, the combination of azacitidine and venetoclax proved to be effective and might be a valuable option in older or very high–risk patients with a low probability of achieving CR with cytarabine and anthracycline–based induction treatment.25 PS29MRC may facilitate clinical decision making within this subgroup of patients. Unfortunately, we were not able to analyze a patient cohort of relevant size that was treated with a combination of azacitidine and venetoclax. Future evaluation of PS29MRC must focus on this alternative or other recently approved regimens, such as CPX-351 or standard 7 + 3 chemotherapy with gemtuzumab-ozogamicin or FLT3 inhibitors.26,27
Of note, when analyzing the small group of patients (n = 15) who received the FLT3 inhibitor midostaurin after approval in the European Union, PS29MRCcont indicated a trend toward a possible prediction of RD. Of 2 PS29MRCdic high-risk patients, 1 patient experienced treatment failure. Of 13 PS29MRCdic low-risk patients, 9 patients achieved CR/CR with incomplete hematologic recovery (P = .091). However, these data are too preliminary to allow any conclusions, and analyses of larger cohorts of patients are warranted.
Informed consent is critical when talking to patients with cancer about their treatment options.28 By establishing a model for individual risk prediction, PS29MRC provides additional information on the risks and benefits of induction therapy. Communication between patients and physicians may be facilitated.
In summary, we further confirmed PS29MRC as a valuable classifier to identify high-risk patients with AML. The score was successfully transferred to a platform that is widely available. Analysis can be conducted quickly, and it may help to guide decision making. Risk classification of patients with AML can still be refined beyond ELN-2017, and concerted efforts are needed to improve the prognosis of the large proportion of patients with very high-risk AML.
Acknowledgments
The authors thank all participants and recruiting centers of the AMLCG.
This work was supported by grants from the Walter Schulz Stiftung and the Wilhelm-Sander-Stiftung (no. 2013.086.2), a Physician Scientists grant (G-509200-004) from the Helmholtz Zentrum München (T.H.), and the German Cancer Consortium (Deutsches Konsortium für Translationale Krebsforschung, Heidelberg, Germany). K.H.M., K.S., and T.H. are supported by a grant from Deutsche Forschungsgemeinschaft (DFG SFB 1243, TP A06, and TP A07), C.M. and S.V. were supported by the Friedrich-Baur-Stiftung, S.V. was supported by the Deutsche José Carreras Leukämie Stiftung, and A.M.N.B. was supported by BMBF grant 01ZZ1804B (DIFUTURE).
Authorship
Contribution: C.M., V.J., J.K., and T.H. conceived and designed the study; C.M., V.J., S.S.-K., B.K., A.M.N.B., C.M.S., D.G., K.S., P.A.G., S.V., K.H.M., and T.H. provided and analyzed data; V.J., A.M.N.B., C.M.S., D.G., and U.M. provided bioinformatics support; C.M., B.K., S.S.-K., and J.K. managed the NanoString platform and measured AMLCG samples; A.D., S.S., M.R.-T., K.S., P.A.G., K.H.M., and T.H. characterized patient samples; C.M.S., D.G., W.E.B., U.K., J.B., and W.H. coordinated the AMLCG Registry; and C.M., V.J., K.H.M., and T.H. wrote the manuscript; and all authors approved the final version of the manuscript.
Conflict-of-interest disclosure: The authors declare no competing financial interests.
Correspondence: Tobias Herold, Laboratory for Leukemia Diagnostics, Department of Medicine III, University Hospital, LMU Munich, Marchioninistr. 15, 81377 Munich, Germany; e-mail: tobias.herold@med.uni-muenchen.de.
References
Author notes
Data sharing requests should be sent to Tobias Herold (tobias.herold@med.uni-muenchen.de).
The full-text version of this article contains a data supplement.

