Key Points
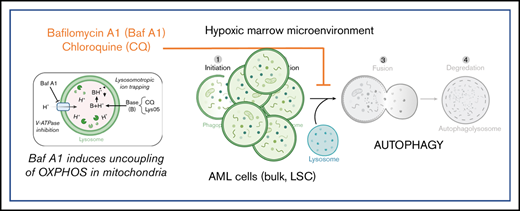
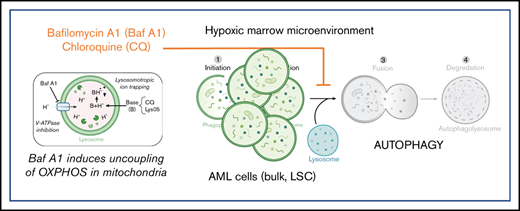
The sensitivity to autophagy inhibitors of AML cells cultured in hypoxia is due to increased reliance on mitophagy for cell survival.
Leukemic stem cells are exquisitely sensitive to Baf A1, because it induces mitophagy and blocks mitochondrial turnover.
Abstract
Leukemia stem cells (LSCs) and therapy-resistant acute myeloid leukemia (AML) blasts contribute to the reinitiation of leukemia after remission, necessitating therapeutic interventions that target these populations. Autophagy is a prosurvival process that allows for cells to adapt to a variety of stressors. Blocking autophagy pharmacologically by using mechanistically distinct inhibitors induced apoptosis and prevented colony formation in primary human AML cells. The most effective inhibitor, bafilomycin A1 (Baf A1), also prevented the in vivo maintenance of AML LSCs in NSG mice. To understand why Baf A1 exerted the most dramatic effects on LSC survival, we evaluated mitochondrial function. Baf A1 reduced mitochondrial respiration and stabilized PTEN-induced kinase-1 (PINK-1), which initiates autophagy of mitochondria (mitophagy). Interestingly, with the autophagy inhibitor chloroquine, levels of enhanced cell death and reduced mitochondrial respiration phenocopied the effects of Baf A1 only when cultured in hypoxic conditions that mimic the marrow microenvironment (1% O2). This indicates that increased efficacy of autophagy inhibitors in inducing AML cell death can be achieved by concurrently inducing mitochondrial damage and mitophagy (pharmacologically or by hypoxic induction) and blocking mitochondrial degradation. In addition, prolonged exposure of AML cells to hypoxia induced autophagic flux and reduced chemosensitivity to cytarabine (Ara-C), which was reversed by autophagy inhibition. The combination of Ara-C with Baf A1 also decreased tumor burden in vivo. These findings demonstrate that autophagy is critical for mitochondrial homeostasis and survival of AML cells in hypoxia and support the development of autophagy inhibitors as novel therapeutic agents for AML.
Introduction
Acute myeloid leukemia (AML) is an aggressive hematological malignancy with limited therapeutic options. Although standard frontline cytarabine (Ara-C) and anthracycline-based chemotherapy can achieve remission in ∼60% of patients, most relapse, leading to low overall survival rates.1 Relapse is hypothesized to result from minimal residual disease (MRD) consisting of surviving AML blasts and leukemia stem cells (LSCs).2-4 MRD persists almost exclusively in the bone marrow (BM), suggesting that the BM microenvironment plays an essential role in protecting these cells from chemotherapeutic insult.5 Both BM stroma and the intrinsic hypoxia of the BM can reduce chemotherapy-induced apoptosis, thereby supporting LSC survival.6-10
Oxygen levels in the BM are hypoxic, ranging from 1.5% to 4.2%.11,12 Hypoxia is associated with chemoresistance in AML, and disease progression is associated with further decreases in marrow oxygenation, suggesting that AML clones are better adapted to survive in hypoxia.13 Hypoxia has also been implicated in cancer stem cell maintenance.14-16 It upregulates many pathways that promote cell survival, including autophagy, and triggers changes in mitochondrial metabolism that lead to alterations in reactive oxygen species (ROS) production and mitophagy.17,18
Macroautophagy (referred to as autophagy) is a degradative process used to recycle nutrients and remove damaged organelles and protein aggregates in a lysosome-dependent manner, thus supporting cellular homeostasis and survival.19 Autophagy can be induced by different stressors, including nutrient deprivation, oxidative stress, and hypoxia. Certain cancer cell types have also been shown to have higher levels of basal autophagy, even in the absence of stress stimuli.20 High expression of autophagy-related proteins correlates with poor clinical outcomes in AML,21 and AML cell populations enriched for LSCs exhibit higher constitutive levels of autophagy, implicating autophagy as a means of LSC survival.22 Autophagy inhibition enhances chemotherapeutic sensitivity in cancer cells, including AML,21,23-27 making autophagy an attractive therapeutic target. A better understanding of how autophagy promotes cell survival in AML will help to define more precise treatment strategies. For instance, mitophagy, the selective autophagy of mitochondria, plays an important role in mitochondrial quality control and homeostasis and limits oxidative stress.28,29 Receptor-mediated mitophagy through BNIP-3, NIX, and FUNDC-1 is upregulated by hypoxia,30 and both mitochondrial respiration and mitophagy have been implicated in LSC maintenance.31-34
Herein, we provide experimental evidence that functional LSCs and hypoxic AML blasts demonstrate increased sensitivity to autophagy inhibition when coupled with the disruption of mitochondrial homeostasis. This study provides the rationale for future clinical development of autophagy and mitophagy inhibitors for the treatment of AML.
Methods
Cell culture and reagents
Cells were cultured at 37°C, 21% O2, 5% CO2, or in an Xvivo Hypoxia chamber (BioSpherix) at 1% O2, 5% CO2, 37°C with humidity. Human AML cell lines (HL60 and MOLM-13) were purchased from the American Type Culture Collection (ATCC). HEL cells were stably transfected with a pGL4 luciferase reporter vector (HEL-Luc; Promega), as described previously.35 Additional details about drugs and reagents can be found in supplemental Methods. All drugs were added to cells immediately after plating at a concentration of 5 × 10⁵/mL with continuous exposure, unless otherwise indicated. Concentrations and duration of treatment are detailed in the figures.
Primary AML samples
Primary AML BM cells from patients with a diagnosis of AML or cord blood (CB) and BM from healthy donors were obtained after patients provided informed consent in Institutional Review Board approved protocols at Weill Cornell Medical College-New York Presbyterian Hospital (New York, NY), the University of Rochester Medical Center (Rochester, NY), and Roswell Park Comprehensive Cancer Center (Buffalo, NY). Healthy BM samples were from ATCC. Primary cryopreserved AML samples were thawed and cultured as previously described.36 Enrichment of CD34+ cells was performed with an indirect CD34 Microbead Isolation Kit (Miltenyi Biotec), according to the manufacturer’s instructions.
Confocal microscopy
LC3B antibody (cat. no. 2775S; Cell Signaling) was used at a concentration of 1:100. A LAMP-2 antibody (H4B4; cat. no. MA1-205; Invitrogen) was used at a concentration of 1:50. MitoSpy Green mitochondrial stain (Biolegend) was used at a concentration of 250 nM, per the manufacturer’s guidelines. MitoSox Red, for detection of superoxide and ROS (Thermo Fisher Scientific), was used at a concentration of 5 µM. Both were stained in live cells, then fixed with 4% paraformaldehyde after treatment with 25 nM bafilomycin A (Bal A) or no treatment for 6 hours or overnight (12-16 hours). For Cyto-ID staining, the AML cells were incubated for 48 hours in normoxia or hypoxia. The cells were spun onto poly-l-lysine (Sigma Aldrich)–coated coverslips, washed with phosphate-buffered saline (PBS), and incubated with Cyto-ID (1:100; Enzo Life Sciences) in PBS+5% fetal bovine serum at 37°C for 30 minutes in the dark. The coverslips were washed, fixed with 4% paraformaldehyde and mounted with VectaShield with 4′,6-diamidino-2-phenylindole (DAPI; Vector Laboratories). Microscopy was performed with a Leica TCS SP2 spectral confocal microscope with a 63× objective at the Flow and Image Cytometry Core Facility at Roswell Park. Images were processed by ImageJ software (National Institutes of Health).
Electron microscopy
Details are given in the supplemental Methods.
Flow cytometry of leukemia cells
Cells were incubated for 48 to 72 hours with specific drugs in normoxia or hypoxia, followed by flow cytometric assays. Apoptosis was assessed in asynchronously growing cells by using an annexin V/propidium iodide (PI) (or 7-aminoactinomycin D [7-AAD]) Apoptosis Detection Kit (BD Pharmingen) (FITC-annexin V or BV-421-annexin V). Double-stranded DNA breaks were assessed via measurements of phosphorylated histone H2A.X (EMD Millipore) according to the manufacturer’s protocol. The mitochondrial mass was measured with MitoID, according to the manufacturer’s protocol (Enzo Life Sciences). Mitochondrial ROS was measured with 5 µM MitoSox mitochondrial superoxide detection reagent, according to the manufacturer’s instructions (Thermo Fisher Scientific).
siRNA transfection of leukemia cells
MOLM-13 cells were transfected by electroporation with the Amaxa Nucleofector electroporation system (Solution SF, Program CA-137; Lonza). In brief, 2 × 10⁶ cells were resuspended with 2 µM SMART pool small interfering RNAs (siRNAs; Dharmacon) before electroporation (ATG-7, L-020112-00-0005; ATG-5, L-004374-00-0005; nontargeting 1D-001810-10-05). After 24 hours for recovery, the cells were plated at 5 ×10⁵/mL in normoxia or hypoxia. Apoptosis was assessed by flow cytometry after 72 hours, as described earlier). The efficiency of siRNA knockdown was measured at the protein level by immunoblot analysis.
Immunoblot analysis
Cells (4 × 10⁶ cells at 5 × 10⁵ /mL) were incubated in normoxia or hypoxia for 48 hours in the presence of various drugs, followed by lysis in Triton X-100 buffer (50 mM Tris-HCl [pH 7.4], 150 mM NaCl, and 1% Triton X- 100 [v/v]) supplemented with protease and phosphatase inhibitor cocktail (Sigma-Aldrich). Protein content was determined by the bicinchoninic acid method (Thermo Fisher). Equivalent amounts of cell lysate were separated by sodium dodecyl sulfate polyacrylamide gel electrophoresis (4% to 20% TGX Gel; Bio-Rad), transferred to polyvinylidene difluoride membrane, probed with indicated primary antibodies (supplemental Methods), and detected with horseradish peroxidase–linked secondary antibodies (Bio-Rad and Santa Cruz Biotechnology) and chemiluminescence (Clarity ECL; BioRad). Immunoblot results were acquired with a LI-COR Imager with Image Studio (LI-COR, Lincoln, NE) software and quantified relative to actin levels by using Image Studio Lite (LI-COR).
Leukemia xenograft experiments
All animal experiments were performed under an approved Institutional Animal Care and Use Committee protocol. A systemic bioluminescent human leukemia xenograft model was established with stably transduced MOLM-13-GFP-Luc (BLIV) cells, as previously described.37 Refer to supplemental Methods for additional details.
Primary AML xenotransplantation assays
Patient-derived xenografts (PDXs) were established in NSG mice, as reported previously (supplemental Methods).38 Engraftment of primary human leukemia cells in NSG mice was evaluated by flow cytometry. On the day of euthanasia, murine BM cells were harvested, and single-cell preparations were stained with fluorescence-labeled antibodies for 30 minutes in the dark at 4°C. Antibodies included anti-mouse CD45 conjugated to phycoerythrin-cyanine-5 (PECy5; 30F11; Biolegend), anti-human CD45 conjugated to allophycocyanin-cyanine-7 (APC-H7; 2D1; BD Biosciences), anti-mouse CD45 conjugated to brilliant violet 605 (BV605, Biolegend), anti-human CD45 conjugated to allophycocyanin (APC; Biolegend), anti-human CD123 conjugated to phycoerythrin (PE; Biolegend), anti-human CD33 conjugated to brilliant violet (BV421; Biolegend), and 7-AAD (Biolegend). The cells were then washed and resuspended in cold fluorescence-activated cell sorting buffer containing 1 µg/mL of DAPI (Thermo Fisher Scientific) and analyzed for the presence of viable leukemia cells. All studies were performed with a BD-LSRII or FACSCalibur analytical flow cytometer. The analysis was performed with FlowJo (v9.3; FlowJo LLC) or FCS-Express (v6; De Novo Software).
Serial replating colony-forming assay
Primary human AML cells were cultured at 2.5 × 10⁴/mL in the presence of various drugs in MethoCult H4434 (Stem Cell Technologies). Dishes were incubated at 37°C in 5% CO2 with ≥95% humidity for 10 to 14 days to allow for colony formation. Colonies were counted and recorded; the cells were rinsed with prewarmed PBS (37°C), counted, and replated in fresh medium at a concentration of 2.5 × 10⁴/mL, to test whether they would form secondary colonies.
Extracellular flux assays
Oxygen consumption rates (OCRs) were determined with the Seahorse XFe 96 Extracellular Flux Analyzer (Agilent Technologies) by using the Mitochondrial Stress Test. See the supplemental Methods for details.
Statistics
Statistics were calculated with Prism version 6 software (GraphPad). P < .05 was set as the level of significance. Statistical evaluation of differences in mean values was conducted with a 2-tailed Student t test with equal variance, unless otherwise indicated.
Results
AML cell lines and patient samples have high basal levels of autophagy and are sensitive to autophagy inhibition
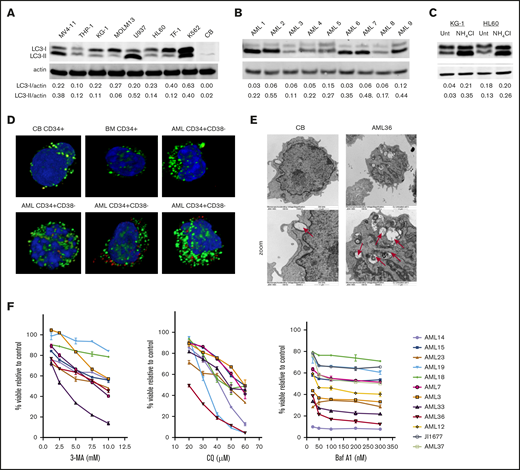
AML cell lines and patient samples were assessed for basal autophagy. Most of the AML cell lines (Figure 1A) and patient samples (Figure 1B) displayed increased levels of LC3-I and LC3-II, relative to normal CB and BM (supplemental Figure 1). Increases in LC3-II can indicate either an increase in basal levels of autophagy or a block in autophagosome turnover. To distinguish between these 2 possibilities, we prevented autophagosome degradation using ammonium chloride (NH4Cl), a lysosomal acidification inhibitor. Blocking autophagosome turnover led to further increases in LC3-II, indicating an increased accumulation of autophagosomes and therefore an increase in constitutive autophagy (Figure 1C). An increased number of autophagosomes was also observed in CD34+CD38− AML blasts compared with nonmalignant CD34+ cells from CB or BM by both immunofluorescence (Figure 1D) and electron (Figure 1E) microscopy.
AML cells have high levels of constitutive autophagy, compared with normal CD34+cells and are sensitive to autophagy inhibition. Immunoblot analysis of the indicated AML cell lines (A) and patient samples (B) of LC3 and actin (loading control) showed different levels of basal autophagy. Quantification of LC3-I and -II levels was performed with Image J software. (C) The KG-1 and HL60 cell lines were incubated with NH4Cl overnight (>12 hours), and the lysates were analyzed for LC3 and actin (loading control). Increased LC3-II after treatment indicates active autophagic flux. (D) CD34+ cells from CB, BM, or patients with AML were stained with antibodies against LC3 (green) as a marker of autophagosomes or LAMP-2 (red) as a marker of lysosomes with DAPI (blue) as a nuclear stain. (E) Electron micrograph images show more autophagosomes in AML cells, compared with nonmalignant CB cells. Original magnification ×15 000, ×30 000 zoom. (F) Samples from AML patients were treated with increasing concentrations of autophagy inhibitors CQ, 3-MA, or Baf A1. Cell viability was measured with YOPRO-1 and 7-AAD and is displayed as the percentage of viable cells, compared with the untreated controls.
AML cells have high levels of constitutive autophagy, compared with normal CD34+cells and are sensitive to autophagy inhibition. Immunoblot analysis of the indicated AML cell lines (A) and patient samples (B) of LC3 and actin (loading control) showed different levels of basal autophagy. Quantification of LC3-I and -II levels was performed with Image J software. (C) The KG-1 and HL60 cell lines were incubated with NH4Cl overnight (>12 hours), and the lysates were analyzed for LC3 and actin (loading control). Increased LC3-II after treatment indicates active autophagic flux. (D) CD34+ cells from CB, BM, or patients with AML were stained with antibodies against LC3 (green) as a marker of autophagosomes or LAMP-2 (red) as a marker of lysosomes with DAPI (blue) as a nuclear stain. (E) Electron micrograph images show more autophagosomes in AML cells, compared with nonmalignant CB cells. Original magnification ×15 000, ×30 000 zoom. (F) Samples from AML patients were treated with increasing concentrations of autophagy inhibitors CQ, 3-MA, or Baf A1. Cell viability was measured with YOPRO-1 and 7-AAD and is displayed as the percentage of viable cells, compared with the untreated controls.
To test whether an increase in basal autophagy is critical for AML cell survival, samples from patients with AML were incubated with increasing concentrations of 3 autophagy inhibitors, each with distinct mechanisms of inhibiting autophagic flux. 3-Methyladenine (3-MA), a phosphoinositide 3-kinase inhibitor that prevents autophagosome formation39 ; chloroquine (CQ), a lysosomotropic agent that becomes protonated in the lysosomes, leading to increases in lysosomal pH40 ; and bafilomycin A1 (Baf A1), which prevents acidification of lysosomes through inhibition of the vacuolar H+ ATPase.41 Notably, Baf A1 has also been shown to act as a potassium ionophore that induces the uncoupling of oxidative phosphorylation (OXPHOS) and mitochondrial membrane depolarization at higher concentrations.42,43 All inhibitors demonstrated dose-dependent decreases in cell viability in all patient specimens to varying extents (Figure 1F). Interestingly, although Baf A1 had less of a dose-dependent response, a subset of samples from patients with AML was particularly sensitive to Baf A1 treatment. Additional data on the effects of Baf A1 and CQ treatment on other acute leukemia cell lines are shown in supplemental Figure 8.
Inhibiting autophagy targets functional leukemia progenitor cells
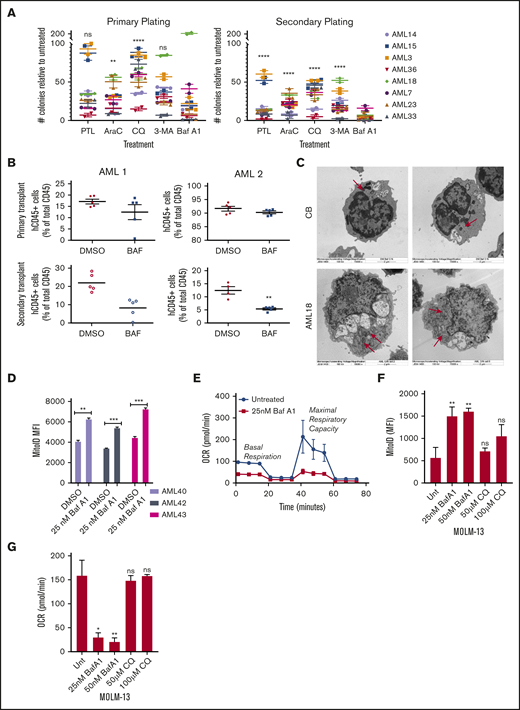
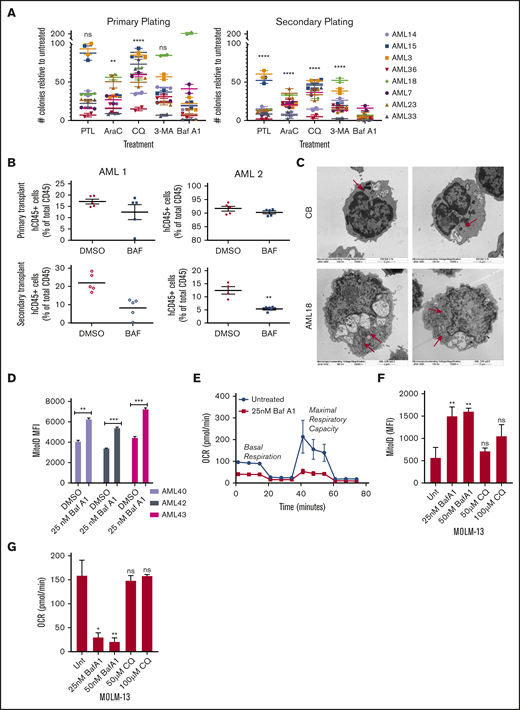
Given the higher levels of autophagy in CD34+CD38− AML cells vs normal CB/BM cells and their sensitivity to autophagy inhibitors, we tested whether autophagy inhibitors target leukemia progenitors and LSCs. We measured colony formation of primary patient samples in the presence or absence of autophagy inhibitors with a secondary replating to functionally assess progenitor potential. Available patient characteristics can be found in supplemental Table 1. Both primary and secondary replated AML colony-forming units (CFUs) were reduced by all autophagy inhibitors (Figure 2A). Surprisingly, 3-MA appeared to affect a different subset of patient samples than the lysosome-based inhibitor CQ. This finding could be related to the inhibition of autophagosome formation vs turnover. It could also be caused by off-target effects of the 3-MA, as the concentrations at the experimental time points have been shown to inhibit phosphoinositide 3-kinase class I enzymes, as well.44 Treatment with Baf A1 showed the most dramatic decrease in CFUs, comparable to treatment with parthenolide, an established inhibitor of LSCs (Figure 2A; supplemental Figure 2A).38 Importantly, Baf A1 had little effect on normal hematopoietic progenitors from CB (supplemental Figure 2B).
Baf A1 preferentially targets functionally defined LSCs and leads to the accumulation of damaged mitochondria. (A) Primary cells from patients with AML were grown in methylcellulose with the indicated drug (7.5 µM PTL, 2.5 µM Ara-C, 40 µM CQ, 50 nM Baf A1, and 10 mM 3-MA). Data are shown as the number of CFUs, compared with those in untreated cells. After the primary plating was quantified, the cells were collected for a secondary replating (technical replicates). Error bars represent ± standard error of the mean (SEM). Statistical analysis compared each treatment mean with that of Baf A1. (B) NSG mice were inoculated with samples from 2 patients with AML (AML 1 and AML 2) and treated with DMSO or Baf A1 (1 mg/kg) intraperitoneally 2 times per week for 4 weeks (5 mice per group). The BM was then harvested from the mouse recipients of the primary transplant, measured for AML burden by flow cytometry for human and mouse CD45, and injected via the tail vein into the second set of NSG mice. The AML burden of the secondary transplant was measured after 6 to 8 weeks. (C) Electron micrographs of healthy donor CB or AML18 samples after overnight treatment with Baf A1 (25 nM). AML cells demonstrated an increase in the number of mitochondria. Original magnification ×15 000. (D) CD34+-enriched samples from patients with AML were treated with 25 nM Baf A1 for 48 hours, then stained for mitochondria using MitoID (2 technical replicates). Data are shown as mean fluorescence intensity (MFI) of MitoID. (E-G) AML samples or MOLM-13 cells were treated with Baf A1 or CQ for 48 hours. Viability of all samples was >85%, by trypan blue exclusion. (E) Representative MitoStress Test profile determined with a Seahorse XF analyzer. (F) MitoID MFI (≥3 biological replicates; 3 technical replicates). (G) Average maximal respiration (≥3 biological replicates; 3 technical replicates). Error bars represent ± standard deviation. *P < .05; ** P < .01; *** P < .001. ns, not significant.
Baf A1 preferentially targets functionally defined LSCs and leads to the accumulation of damaged mitochondria. (A) Primary cells from patients with AML were grown in methylcellulose with the indicated drug (7.5 µM PTL, 2.5 µM Ara-C, 40 µM CQ, 50 nM Baf A1, and 10 mM 3-MA). Data are shown as the number of CFUs, compared with those in untreated cells. After the primary plating was quantified, the cells were collected for a secondary replating (technical replicates). Error bars represent ± standard error of the mean (SEM). Statistical analysis compared each treatment mean with that of Baf A1. (B) NSG mice were inoculated with samples from 2 patients with AML (AML 1 and AML 2) and treated with DMSO or Baf A1 (1 mg/kg) intraperitoneally 2 times per week for 4 weeks (5 mice per group). The BM was then harvested from the mouse recipients of the primary transplant, measured for AML burden by flow cytometry for human and mouse CD45, and injected via the tail vein into the second set of NSG mice. The AML burden of the secondary transplant was measured after 6 to 8 weeks. (C) Electron micrographs of healthy donor CB or AML18 samples after overnight treatment with Baf A1 (25 nM). AML cells demonstrated an increase in the number of mitochondria. Original magnification ×15 000. (D) CD34+-enriched samples from patients with AML were treated with 25 nM Baf A1 for 48 hours, then stained for mitochondria using MitoID (2 technical replicates). Data are shown as mean fluorescence intensity (MFI) of MitoID. (E-G) AML samples or MOLM-13 cells were treated with Baf A1 or CQ for 48 hours. Viability of all samples was >85%, by trypan blue exclusion. (E) Representative MitoStress Test profile determined with a Seahorse XF analyzer. (F) MitoID MFI (≥3 biological replicates; 3 technical replicates). (G) Average maximal respiration (≥3 biological replicates; 3 technical replicates). Error bars represent ± standard deviation. *P < .05; ** P < .01; *** P < .001. ns, not significant.
A PDX model in immune-deficient mice was also used to evaluate functionally whether Baf A1 inhibits LSC potential in vivo. Primary AML cells were transplanted into sublethally irradiated NOD/SCID-IL2Rg−/− (NSG) mice. After engraftment was confirmed, the mice were treated with Baf A1 (1 mg/kg) or vehicle (dimethyl sulfoxide [DMSO]) twice a week for 4 weeks. BM cells were then harvested, and an equal number of human CD45+ (hCD45+) cells were transplanted into the second cohort of NSG mice that had received no additional treatment. Secondary engraftment was measured after 8 weeks. As shown in Figure 2B, Baf A1 treatment did not influence the leukemia burden in the primary xenograft. However, mice that received the secondary transplant from Baf A1-treated mice had substantially fewer hCD45+ cells than did the vehicle-treated mice. Taken together, these results indicate that Baf A1 can specifically inhibit functional leukemic progenitors in both in vitro and in vivo primary human AML models.
Previous studies have shown that mitophagy, ROS homeostasis, and OXPHOS are all critical for LSC function.22,31-33 Given the potential off-target mitochondrial effects of Baf A1, we specifically examined mitochondrial function in Baf A1-treated AML blasts. We observed that blocking autophagy with Baf A1 increased vacuole size in both CB and AML cells, but increased the number of mitochondria in only AML cells, not in normal hematopoietic cells, as seen by electron microscopy (Figure 2C vs Figure 1E). This result was confirmed by measuring the mitochondrial mass with MitoID, which revealed a significant increase in mitochondria after Baf A1 treatment in samples from patients with AML (Figure 2D). This finding coincided with an increase in mitochondrial superoxide production in cell the lines (supplemental Figure 2C-D). Also, we observed increased differentiation of patient-derived AML blasts after Baf A1 treatment, measured by enhanced expression of the granulocyte/monocyte marker CD11b (supplemental Figure 2E), consistent with a differentiation program induced by ROS. These mitochondria were not functional, however, as both basal and maximal mitochondrial respiration were inhibited with Baf A1 treatment in both patient samples and MOLM-13 cells (Figure 2E; supplemental Figure 2F), by measuring mitochondrial OCR. These data suggest that Baf A1 causes the accumulation of damaged nonfunctional mitochondria, thereby exploiting the metabolic vulnerabilities of LSCs. Interestingly, although Baf A1 and CQ both inhibited autophagy by blocking autophagosome turnover through lysosomal disruption, CQ did not induce a significant accumulation of mitochondria (Figure 2F) or inhibition of OXPHOS (Figure 2G), suggesting that Baf A1-mediated induction of mitochondrial dysfunction may be independent of its role in blocking autophagic flux. The increased efficacy of Baf A1 in inducing cell death and inhibiting LSC growth, compared with CQ in patient samples, also suggests that this ability to specifically disrupt mitochondrial function in addition to blocking the pathway for disposal of damaged mitochondria is responsible for the enhanced targeting of LSCs.
Hypoxia increases autophagic flux in AML cell lines
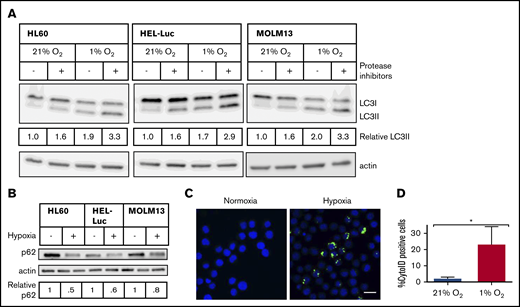
Triggering of autophagy in hypoxia has been implicated as a potential mechanism underlying the hypoxia-induced chemoresistance observed in many cancer cells.45 Given the preferential localization of LSCs to the hypoxic BM, we hypothesized that in AML cells, upregulation of autophagy in hypoxic conditions may contribute to the persistence and survival of AML blasts and LSCs throughout chemotherapy. Incubation of AML cell lines in conditions that mimic hypoxia in the BM (1% O2) resulted in increases in LC3-II detected by immunoblot analysis in the 3 AML cell lines tested (Figure 3A), because of an increase in autophagic flux, as opposed to a block in autophagosome turnover, as treatment with the lysosomal protease inhibitors pepstatin A and E-64d led to further increases in LC3-II (Figure 3A). There was also a reduction in the autophagic cargo protein p62 after incubation in hypoxia, suggesting its increased degradation and therefore increased autophagic flux (Figure 3B).40 Interestingly, Baf A1, which should also block autophagic flux, demonstrated an increase in LC3-II, yet decreased p62 in normoxic conditions; however, it led to accumulation of p62 in hypoxic conditions in the MOLM-13 and HEL-Luc cell lines, suggesting that Baf A1 acts differentially on autophagy induction and blockage based on oxygenation (supplemental Figure 3). Staining cells with the autophagosome selective dye Cyto-ID also demonstrated increases in the number of autophagosomes in hypoxia in a subset of cells (23% ± 11% Cyto-ID+ cells in hypoxia vs 2% ± 1% in normoxia; Figure 3C-D). These data indicate that human AML cells undergo increased autophagy in hypoxic conditions.
Hypoxia induces autophagic flux in AML cell lines. AML cell lines were incubated in normoxia or hypoxia for 48 hours, with or without lysosomal protease inhibitors (10 µg/mL pepstatin A and E-64d) added for the final 6 hours. (A) Immunoblot analysis of LC3 and actin (loading control) is shown. LC3-II levels were determined by densitometric analysis and normalized to actin. Values are relative to untreated cells in 21% O2. (B) Immunoblot analysis of p62 and actin (loading control). Blots are representative of 2 independent experiments. (C) HEL-Luc cells were stained with Cyto-ID, fixed, mounted in Vectashield+DAPI, and imaged on a Leica TCS SP2 spectral confocal microscope with a 63× objective (blue, nucleus/DAPI; green, autophagosomes/Cyto-ID). Bar represents 10 µm. (D) Microscopic images were quantified by ImageJ to determine the percentage of Cyto-ID+ cells (3 biological replicates, ≥100 cells counted per replicate). Error bars represent ± standard deviation. *P < .05.
Hypoxia induces autophagic flux in AML cell lines. AML cell lines were incubated in normoxia or hypoxia for 48 hours, with or without lysosomal protease inhibitors (10 µg/mL pepstatin A and E-64d) added for the final 6 hours. (A) Immunoblot analysis of LC3 and actin (loading control) is shown. LC3-II levels were determined by densitometric analysis and normalized to actin. Values are relative to untreated cells in 21% O2. (B) Immunoblot analysis of p62 and actin (loading control). Blots are representative of 2 independent experiments. (C) HEL-Luc cells were stained with Cyto-ID, fixed, mounted in Vectashield+DAPI, and imaged on a Leica TCS SP2 spectral confocal microscope with a 63× objective (blue, nucleus/DAPI; green, autophagosomes/Cyto-ID). Bar represents 10 µm. (D) Microscopic images were quantified by ImageJ to determine the percentage of Cyto-ID+ cells (3 biological replicates, ≥100 cells counted per replicate). Error bars represent ± standard deviation. *P < .05.
AML cells are more sensitive to autophagy inhibition in hypoxia caused by increased mitophagy
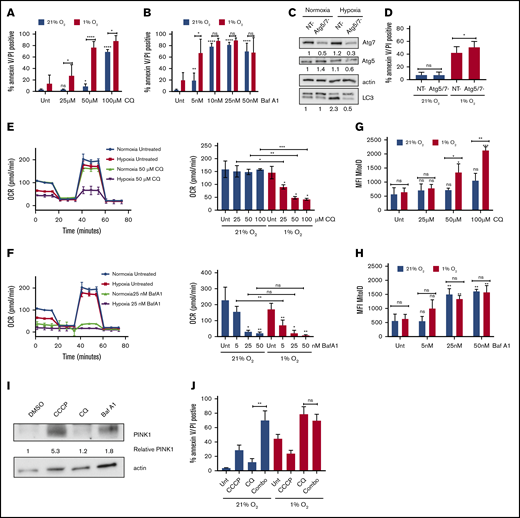
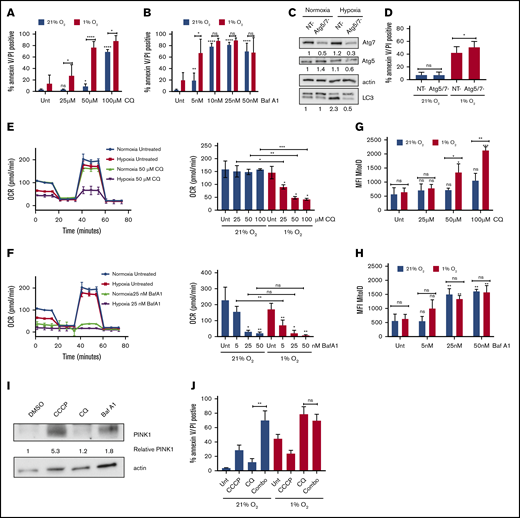
We hypothesized that the hypoxia-mediated induction of autophagy provides a prosurvival function in AML. Indeed, inhibition of autophagy by CQ increased apoptosis in MOLM-13 cells, preferentially in hypoxic compared with normoxic conditions (Figure 4A). This effect was also observed in HL60 cells (supplemental Figure 4A). To test whether the autophagy was specifically responsible for the effect, autophagy was then inhibited genetically by knocking down the canonical autophagy proteins Atg-5 and Atg-7. The combined knockdown of Atg-5 and Atg-7 inhibited autophagy induction in hypoxia, as shown by the lower LC3-II levels in the knockdown vs nontargeting siRNA by immunoblot (Figure 4C). Atg-5/7 knockdown did not affect AML cell viability in normal oxygen conditions but resulted in enhanced apoptosis in hypoxia (Figure 4D). Thus, the enhancement of apoptosis in hypoxia after inhibition of autophagy was specifically due to its effects on blocking autophagy. Surprisingly, we did not see the same effect with Baf A1, as cells were equally viable in both normoxia and hypoxia at higher concentrations of the drug (Figure 4B; supplemental Figure 4B).
Sensitivity to autophagy inhibitors in hypoxia correlates with the extent of inhibition of mitochondrial respiration. (A-B) MOLM-13 AML cell lines were treated with the indicated concentrations of CQ (A) or Baf A1 (B) in normoxia or hypoxia for 72 hours and analyzed by annexin V/PI flow cytometry (≥3 biological replicates; 2 technical replicates). (C-D) MOLM-13 cells were transfected with siRNAs against Atg-5 and Atg-7. After 24 hours, they were placed in normoxia or hypoxia. Lysates harvested after 48 hours for immunoblot analysis (C) (quantification under each blot normalized to actin, followed by normalization to NT in normoxia), or the cells were analyzed after 72 hours by annexin V/PI flow cytometry (D) (3 biological replicates; 2 technical replicates). (E-F) MOLM-13 cells were treated with CQ (E) or Baf A1 (F) for 48 hours in normoxia or hypoxia and analyzed on a Seahorse XF analyzer. Representative MitoStress Test profiles and average maximal respiration for cells are shown (2 biological replicates; 3 technical replicates). (G-H) MOLM-13 cells were treated with CQ (G) or Baf A1 (H) for 48 hours, stained with MitoID, and analyzed by flow cytometry (3 biological replicates; 2 technical replicates). Data are shown as average mean fluorescence intensity (MFI). (I) MOLM-13 cells were harvested after a 48-hour treatment with 10 µM CCCP, 50 µM CQ, or 25 nM Baf A1 and blotted for PINK-1. The levels were determined by densitometric analysis and normalized to actin. Values are shown relative to DMSO. (J) MOLM-13 cells were treated with 10 µM CCCP or 50 µM CQ, alone or in combination in normoxia or hypoxia for 72 hours, and analyzed by annexin V/PI flow cytometry (3 biological replicates; 2 technical replicates). Error bars represent ± standard deviation. *P < .05; **P < .01; ***P < .001; ****P < .0001.
Sensitivity to autophagy inhibitors in hypoxia correlates with the extent of inhibition of mitochondrial respiration. (A-B) MOLM-13 AML cell lines were treated with the indicated concentrations of CQ (A) or Baf A1 (B) in normoxia or hypoxia for 72 hours and analyzed by annexin V/PI flow cytometry (≥3 biological replicates; 2 technical replicates). (C-D) MOLM-13 cells were transfected with siRNAs against Atg-5 and Atg-7. After 24 hours, they were placed in normoxia or hypoxia. Lysates harvested after 48 hours for immunoblot analysis (C) (quantification under each blot normalized to actin, followed by normalization to NT in normoxia), or the cells were analyzed after 72 hours by annexin V/PI flow cytometry (D) (3 biological replicates; 2 technical replicates). (E-F) MOLM-13 cells were treated with CQ (E) or Baf A1 (F) for 48 hours in normoxia or hypoxia and analyzed on a Seahorse XF analyzer. Representative MitoStress Test profiles and average maximal respiration for cells are shown (2 biological replicates; 3 technical replicates). (G-H) MOLM-13 cells were treated with CQ (G) or Baf A1 (H) for 48 hours, stained with MitoID, and analyzed by flow cytometry (3 biological replicates; 2 technical replicates). Data are shown as average mean fluorescence intensity (MFI). (I) MOLM-13 cells were harvested after a 48-hour treatment with 10 µM CCCP, 50 µM CQ, or 25 nM Baf A1 and blotted for PINK-1. The levels were determined by densitometric analysis and normalized to actin. Values are shown relative to DMSO. (J) MOLM-13 cells were treated with 10 µM CCCP or 50 µM CQ, alone or in combination in normoxia or hypoxia for 72 hours, and analyzed by annexin V/PI flow cytometry (3 biological replicates; 2 technical replicates). Error bars represent ± standard deviation. *P < .05; **P < .01; ***P < .001; ****P < .0001.
Given the distinct mechanisms by which Baf A1 and CQ inhibit autophagy and the additional effect that Baf A1 has on mitochondrial respiration (Figure 2F), we measured mitochondrial function in normoxic and hypoxic conditions after treatment with either CQ or Baf A1. With CQ treatment, maximal respiratory capacity was decreased in a dose-dependent manner, specifically in hypoxic conditions (Figure 4E). At higher concentrations, Baf A1 significantly inhibited maximal respiration in both normoxia and hypoxia (Figure 4F). At lower concentrations of Baf A1 (5 nM), at which we saw enhanced apoptosis in hypoxia, we saw results similar to those with CQ, with a decrease in mitochondrial function only in hypoxia corresponding with the significantly increased apoptosis (Figure 4B,D). Decreased maximum respiration appeared to be specific to hypoxic conditions and not to a general feature of cells undergoing apoptosis because of treatment with autophagy inhibitors, as cells treated with concentrations of CQ that induced apoptosis in normoxia did not show any changes in maximal respiration (Figure 4A,E). These effects were not as prominent in samples from patients with AML, although the effects of Baf A1 in hypoxia were dramatic (supplemental Figure 4D). The cells did not demonstrate a concomitant increase in glycolysis. Instead, there was a decrease in their glycolytic capacity without a substantial effect on basal glycolysis (supplemental Figure 4E). Thus, Baf A1 appears to both impair mitochondrial function and inhibit the pathway needed to maintain mitochondrial homeostasis, leading to mitochondrial dysfunction. CQ has no direct mitochondrial effects but leads to inhibition of mitochondrial function in hypoxia. This suggests that autophagy is critical for mitochondrial homeostasis in low oxygen conditions, possibly through mitophagy.
If mitophagy constitutively occurs to maintain a healthy pool of mitochondria in hypoxia, blocking autophagy should increase mitochondrial mass. We noted that CQ treatment had no effects on mitochondrial mass in normoxia. However, statistically significant increases in mitochondria in both MOLM-13 cells (Figure 4G) and patient samples (supplemental Figure 4F) were observed, consistent with constitutive mitophagy in hypoxia, but not in normoxia. In contrast, Baf A1 treatment was associated with increased mitochondria in both oxygen conditions, consistent with prior mitochondrial respiration data (Figure 4H; supplemental Figure 4E). The differential effects based on the pharmacologic agents used imply that hypoxia induces mitochondrial turnover via mitophagy at a high level, which cannot be further increased by Baf A1.
Because the uncoupling of OXPHOS in the mitochondria is known to induce mitophagy,46 we tested whether Baf A1 induces mitophagy by assessing the expression of the mitophagy protein PTEN-induced kinase-1 (PINK-1) in normoxic conditions.47 Carbonyl cyanide m-chlorophenylhydrazone (CCCP), a mitochondrial uncoupler, was used as a positive control for PINK-1 stabilization and mitophagy.46-48 Treatment with Baf A1 led to an increase in PINK-1 that was not observed with CQ (Figure 4I), suggesting that Baf A1 can induce mitophagy independent of its role in blocking autophagosome turnover.
To further support this hypothesis, we induced mitophagy by using CCCP and combined it with CQ to see whether it would phenocopy the levels of apoptosis induced by Baf A1 treatment alone. Although CCCP and CQ induced only modest amounts of apoptosis as single agents in normoxia, the combination dramatically increased apoptosis to levels similar to those obtained with Baf A1 (Figure 4B,J). In addition, the addition of CCCP did not lead to any further increases in CQ-induced apoptosis in hypoxia, which suggests that mitophagy plays a critical prosurvival function in AML cells in hypoxia to maintain mitochondrial homeostasis. Blocking mitophagy using autophagy inhibitors therefore can enhance AML cell death in hypoxic conditions.
Reduced chemotherapy-induced apoptosis in hypoxia can be overcome with autophagy inhibitors
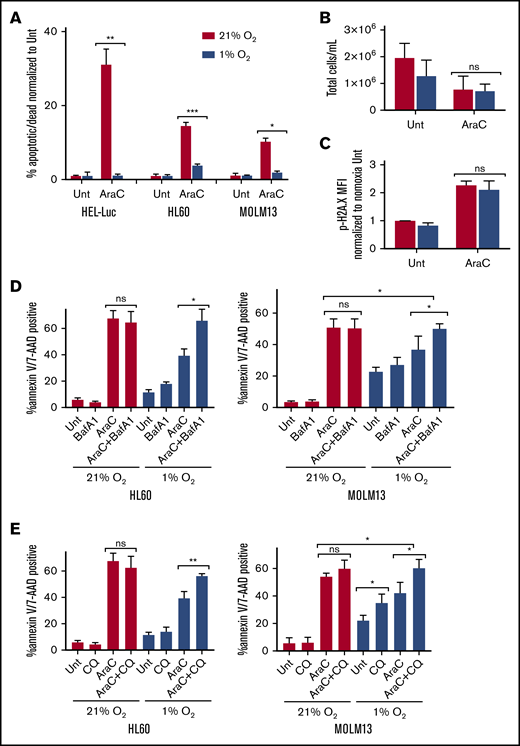
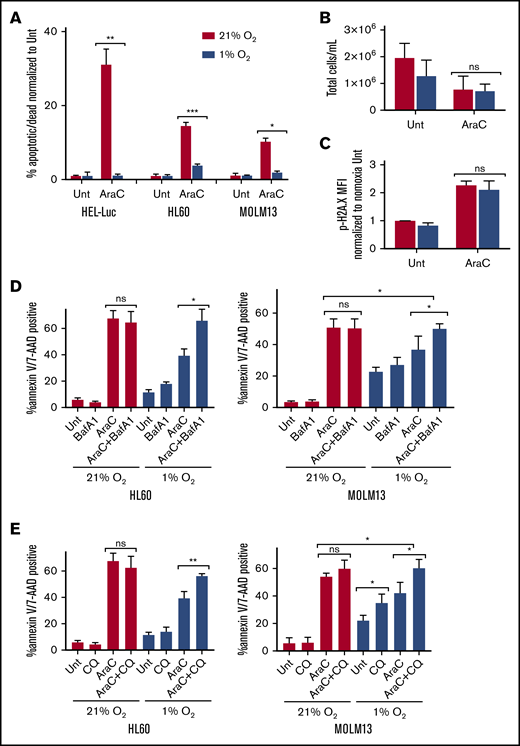
Hypoxia reduces the chemosensitivity of many cancer cell lines, including AML.9 We found that hypoxia decreased apoptosis in multiple human AML cell lines treated with Ara-C (Figure 5A). Ara-C treatment in hypoxia resulted in similar concentrations of total cells after treatment, compared with normoxic conditions, and there were no significant differences in the DNA damage marker phosphorylated-H2A.X in AML cells treated with Ara-C in hypoxia vs normoxia (Figure 5B-C), suggesting that proliferation and DNA damage were equivalent. Given the increased sensitivity of AML to autophagy inhibitors in hypoxia, we tested whether treatment with these compounds could restore chemosensitivity. We used low concentrations of both CQ (25 µM) and Baf A1 (2 nM), which did not demonstrate any significant effects on apoptosis as single agents or in combination with Ara-C in normoxia. However, they did block autophagosome turnover, as indicated by increases in LC3-II (Figure 5D-E; supplemental Figure 5). In hypoxia, CQ and Baf A1 had very modest effects as single agents that were cell line dependent. However, in both cell lines, apoptosis was significantly enhanced when the autophagy inhibitors were combined with Ara-C in hypoxia, compared with either agent or Ara-C alone (Figure 5D-E; supplemental Figure 7). This result suggests that blocking autophagosome turnover can reverse the reduced chemosensitivity to Ara-C observed in hypoxic conditions.
Hypoxia reduces chemosensitivity in AML cell lines, which can be restored with autophagy inhibition. The indicated AML cell lines were treated with Ara-C (100 nM HEL-Luc, 250 nM HL60, and MOLM-13 in normoxia (21% O2) or hypoxia (1% O2). Concentrations were determined based on cell line sensitivity to Ara-C. (A) Cells were processed after 72 hours for measurement of apoptosis by flow cytometry with annexin V/7-AAD or PI staining. Data are shown as a percentage of annexin V– and/or 7-AAD– or PI-positive cells normalized to untreated cells (≥3 biological replicates; 2 technical replicates). (B) HEL-Luc cell lines were treated with 100 nM Ara-C for 72 hours, and the total number of cells was quantified (4 biological replicates). (C) HEL-Luc cell lines were treated with 100 nM Ara-C, and phospho-H2A.X flow cytometry was performed after 48 hours. Data are shown as the MFI of p-H2A.X staining normalized to untreated in normoxia (2 biological replicates). (D-E) MOLM-13 and HL60 cells were treated with 250 nM Ara-C in normoxia (21% O2) or hypoxia (1% O2) in combination with bafilomycin A1 (Baf A1; 2 nM) (D) or chloroquine (CQ; 25 µM) (E). The cells were processed after 72 hours for apoptosis flow cytometry, using annexin V/7-AAD or PI staining. Data are shown as a percentage of annexin V– and/or 7-AAD– or PI-positive cells (3 biological replicates; 2 technical replicates). Error bars represent ± standard deviation. *P < .05; **P < .01; ***P < .001.
Hypoxia reduces chemosensitivity in AML cell lines, which can be restored with autophagy inhibition. The indicated AML cell lines were treated with Ara-C (100 nM HEL-Luc, 250 nM HL60, and MOLM-13 in normoxia (21% O2) or hypoxia (1% O2). Concentrations were determined based on cell line sensitivity to Ara-C. (A) Cells were processed after 72 hours for measurement of apoptosis by flow cytometry with annexin V/7-AAD or PI staining. Data are shown as a percentage of annexin V– and/or 7-AAD– or PI-positive cells normalized to untreated cells (≥3 biological replicates; 2 technical replicates). (B) HEL-Luc cell lines were treated with 100 nM Ara-C for 72 hours, and the total number of cells was quantified (4 biological replicates). (C) HEL-Luc cell lines were treated with 100 nM Ara-C, and phospho-H2A.X flow cytometry was performed after 48 hours. Data are shown as the MFI of p-H2A.X staining normalized to untreated in normoxia (2 biological replicates). (D-E) MOLM-13 and HL60 cells were treated with 250 nM Ara-C in normoxia (21% O2) or hypoxia (1% O2) in combination with bafilomycin A1 (Baf A1; 2 nM) (D) or chloroquine (CQ; 25 µM) (E). The cells were processed after 72 hours for apoptosis flow cytometry, using annexin V/7-AAD or PI staining. Data are shown as a percentage of annexin V– and/or 7-AAD– or PI-positive cells (3 biological replicates; 2 technical replicates). Error bars represent ± standard deviation. *P < .05; **P < .01; ***P < .001.
Combination of Ara-C and Baf A1 inhibits AML growth in vivo
We then tested whether the combination of Ara-C and Baf A1 could reduce AML tumor burden in vivo. An aggressive luciferase/FITC-transfected CD33+CD45+CD123+ human AML cell line (MOLM13-BLIV) was systemically engrafted into NSG mice. The animals were treated 3 days after inoculation with vehicle (4% DMSO), Ara-C (60 mg/kg), Baf A1 (1 mg/kg), or combination therapy (Ara-C and Baf A1) over 21 days. The leukemia disease burden was assessed by bioluminescence imaging weekly and by flow cytometry for FITC and human antigen expression (CD45, CD33, and CD123) with species-specific antibodies. Single-agent Baf A1 treatment exerted no observed antileukemia effects as a single agent. However, the combination treatment of Baf A1 with Ara-C resulted in significantly reduced disease burden, compared with Ara-C alone at days 14 and 21 (Figure 6), by bioluminescence imaging and flow cytometry for human AML cells in murine marrow samples (supplemental Figure 6). Suboptimal doses of Ara-C (20 or 40 mg/kg) also demonstrated greater efficacy compared with the vehicle alone when combined with Baf A1 (1 mg/kg; supplemental Figure 7).
A combination treatment of Ara-C with Baf A1 leads to enhanced antileukemic activity. NSG mice were injected via tail vein with luciferase-transfected MOLM-13 cells. Mice were divided into groups of 5 animals and treated with vehicle (DMSO), Ara-C (60 mg/kg per day: 5 days on, 4 days off, 5 days on), Baf A1 (1 mg/kg 3 times a week every other day for 21 days), or in combination. (A) Whole-animal bioluminescence imaging on day 14 after treatment. (B) Quantification of bioluminescence shown as average total photon flux per second on days 14 and 21 after treatment initiation. Error bars represent ± standard deviation. *P < .05, **P < .01.
A combination treatment of Ara-C with Baf A1 leads to enhanced antileukemic activity. NSG mice were injected via tail vein with luciferase-transfected MOLM-13 cells. Mice were divided into groups of 5 animals and treated with vehicle (DMSO), Ara-C (60 mg/kg per day: 5 days on, 4 days off, 5 days on), Baf A1 (1 mg/kg 3 times a week every other day for 21 days), or in combination. (A) Whole-animal bioluminescence imaging on day 14 after treatment. (B) Quantification of bioluminescence shown as average total photon flux per second on days 14 and 21 after treatment initiation. Error bars represent ± standard deviation. *P < .05, **P < .01.
Discussion
Despite the addition of targeted agents and novel chemotherapy formulations for AML therapy, relapse remains a pervasive problem and has been attributed to MRD, consisting of chemoresistant AML cells and LSCs within the BM after therapy.49,50 Thus, a better understanding of LSC biology and how the marrow microenvironment contributes to the development and persistence of MRD is critical and may identify new therapeutic targets to overcome therapy-resistant disease.
Recently, several reports have revealed a role for oxidative metabolism and mitochondrial homeostasis as being critical for AML progression in both human and murine models.31-33,51 Disruption of OXPHOS has become an attractive target for the eradication of quiescent tumor cells, including LSCs. Bcl-2 inhibitors that target LSCs appear to do so in part by disrupting oxidative metabolism,33,34 and phase 1 trials are currently under way in AML, using complex-1 inhibitors.52 Although there have also been prior reports demonstrating a role for autophagy in myeloid leukemia cell survival, these studies did not examine its role in maintaining mitochondrial homeostasis through mitophagy21,22,53 or report the influence of the hypoxic marrow microenvironment in mediating these effects.
Our work further supports a critical role for mitophagy and OXPHOS in AML and LSC maintenance. For the first time we have shown that Baf A1 can target myeloid LSCs and progenitors and can synergize with chemotherapy in a human xenograft model of AML through both disruption of mitochondrial function and blocking mitophagy that is upregulated in response. By comparing 2 functionally distinct autophagy inhibitors that block autophagosome-lysosome fusion, one of which has the additional property of uncoupling oxidative phosphorylation (Baf A1) vs one that does not (CQ), we also revealed a novel role for mitophagy and mitochondrial homeostasis in maintaining AML cell survival in hypoxic conditions. Studies have demonstrated that autophagy inhibition with CQ can cause a decrease in mitochondrial function in cell types that have increased mitochondrial stress and are highly dependent on mitophagy, such as neurons,54 similar to what we observe in AML cell lines in hypoxic conditions.
Autophagy inhibition with CQ or 3-MA had effects on LSC progenitor potential, but only in a subset of samples from AML patients, compared with Baf A1, which dramatically reduced colony formation in all samples tested, without affecting normal CD34+ cells. This finding suggests that the additional activity of Baf A1 on the mitochondria may contribute to its ability to target a broad spectrum of LSCs in vitro, an important observation, given the biological diversity of AML. Our observation that CQ leads to decreased maximal respiratory capacity in hypoxic conditions suggests that even autophagy inhibitors that do not have direct mitochondrial uncoupling effects may be able to target LSCs, given their localization to the hypoxic BM microenvironment.
CQ and hydroxychloroquine have had limited success in prior clinical trials because of dose-limiting toxicities and pharmacokinetic challenges. These incidences of adverse events at increasing dose levels have precluded achievement of plasma concentrations high enough to inhibit autophagy in many patients.55-59 This has also been the case in murine studies evaluating the antileukemia potential of CQ in vivo60 (D.H. and S.P., unpublished data). For this reason, testing our hypothesis that the marrow microenvironment will enhance LSC targeting by blocking autophagy may involve the use of second-generation, lysosome-based autophagy inhibitors such as Lys05.61 Indeed, recent studies have shown that Lys05 targets chronic myeloid leukemia LSCs through the loss of quiescence and induction of maturation.62
Our work supports a growing body of literature on the clinical potential of Baf A1 for a wide variety of cancers at low concentrations, particularly in combination settings.63-65 In murine models, Baf A1 is nontoxic at concentrations of up to 10 mg/kg, well above what was necessary to inhibit LSC progenitors in this study.63 The ability of Baf A1 to both target mitochondrial metabolism and inhibit autophagy makes it particularly attractive for combination treatments to eradicate both bulk tumor and LSCs in AML.
For original data, please contact Eunice S. Wang (eunice.wang@roswellpark.org) or Monica L. Guzman (mlg2007@med.cornell.edu).
Acknowledgments
The authors thank Ana Maria Cuervo and Susmita Kaushik (Albert Einstein College of Medicine, Department of Developmental and Molecular Biology) for the use of reagents and Michael Becker (University of Rochester) for provision of primary patient samples; previous students and fellows Dirkje Hanekamp, Megan Johnson, and Houman Nourkeyhani, for contributions to this work; and Amanda Przespolewski (Roswell Park, Department of Medicine) for careful reading of the manuscript.
This work was supported in part by National Institutes of Health, National Cancer Institute (NCI) grant R21 CA158728 (M.L.G.), the Roswell Park Alliance Foundation (Jacquie Hirsch Leukemia Research Fund) (E.S.W.), and NCI grant P30CA016056, involving the use of Roswell Park Comprehensive Cancer Center’s Shared Resources: Flow and Image Cytometry, Immune Analysis (Katherine Collins, Jessie Chiello), and Hematological Procurement Bank (Linda Lutgen-Dunckley, Brandon Martens, Joseph Moberg, Tara Cronin); and the Translational Imaging Shared Resource of Roswell Park (NIH, Office of the Director grant S10 OD016450).
Authorship
Contribution: K.M.D., A.C.M., N.Y., M.L.G., and E.S.W. conceived of and designed the research and developed methodology; K.M.D., A.C.M., N.Y., H.R.S.F., M.J., and S.P. performed the experiments, analyzed the results, and created the figures; and K.M.D., M.L.G., and E.S.W. wrote the paper.
Conflict-of-interest disclosure: The authors declare no competing financial interests.
Correspondence: Eunice S. Wang, Departments of Medicine and Immunology, Roswell Park Comprehensive Cancer Center, Elm and Carlton Streets, Buffalo, NY 14263; e-mail: eunice.wang@roswellpark.org; and Monica L. Guzman, Department of Medicine, Weill Cornell Medicine, 1300 York Ave, Box 113, New York, NY 10065; e-mail: mlg2007@med.cornell.edu.
References
Author notes
The full-text version of this article contains a data supplement.

