Abstract
Transcription factor GATA-1 is essential for the development of the erythroid lineage. To ascertain whether strict control of GATA-1 expression level is necessary for achieving proper erythropoiesis, we established transgenic mouse lines expressing green fluorescent protein (GFP) under the control of the GATA-1 gene hematopoietic regulatory domain. We examined the GATA-1 expression level by exploiting the transgenic mice and found 2 GFP-positive hematopoietic progenitor fractions in the bone marrow. One is the GFPhigh fraction containing mainly CFU-E and proerythroblasts, which coexpress transferrin receptor, while the other is the GFPlow/transferrin receptor-negative fraction containing BFU-E. Since the intensity of green fluorescence correlates well with the expression level of GATA-1, these results indicate that GATA-1 is highly expressed in erythroid colony-forming unit (CFU-E) but low in erythroid burst-forming unit (BFU-E), suggesting that the incremental expression of GATA-1 is required for the formation of erythroid progenitors. We also examined GFP-positive fractions in the transgenic mouse spleen and fetal liver and identified fractions containing BFU-E and CFU-E, respectively. This study also presents an efficient method for enriching the CFU-E and BFU-E from mouse hematopoietic tissues. (Blood. 2003;102:3575-3583)
Introduction
Pluripotent hematopoietic progenitors are committed to and differentiated along the erythroid lineage by the control of various cytokines, growth factors, and signals from the microenvironment.1 In hematopoietic progenitors, these signals are transduced to transcription factors in the nucleus, and the progenitor cells differentiate and mature into erythrocytes by changing their gene expression profiles.2 GATA-1 is a zinc-finger transcription factor, which plays a central role in erythropoiesis. GATA-1 binds to the GATA factor-binding motifs (T/A)GATA(A/G) that have been identified in the regulatory sequences of many genes expressed in erythroid and megakaryocytic cells.3-5 Expression of GATA-1 is restricted to erythroid, megakaryocytic, eosinophilic, basophilic, and mast cells within the hematopoietic system.6 The Sertoli cells in the testis also express GATA-1.7
Mutations in the GATA-1 gene cause defects in erythropoiesis, platelet formation, mast cell maturation, and eosinophil development.8-14 GATA-1-null mutant embryonic stem (ES) cells could not differentiate into mature erythrocytes due to the arrest of erythroid maturation at the proerythroblast stage.15,16 The arrest provoked rapid apoptosis of the proerythroblasts.17 We previously established GATA-1 gene knockdown ES cells, in which the GATA-1 expression level was reduced to approximately 5% of that in wild-type ES cells.10,18 Proerythroblast-like cells derived from the GATA-1 knockdown ES cells have an ability to proliferate vigorously, but a GATA-1 level of 5% cannot sustain the gene expression required for maturation of proerythroblasts.18 McDevitt et al also demonstrated that a 4- to 5-fold decrease in GATA-1 expression caused defects in erythroid cell maturation.19 These results suggest the presence of a threshold GATA-1 expression level at the proerythroblast stage, which is required to sustain erythroid differentiation.
We previously reported that an 8.0-kb genomic fragment of the GATA-1 gene, G1-HRD (GATA-1-hematopoietic regulatory domain),20,21 is sufficient for recapitulation of the endogenous GATA-1 expression profile; transgenic GATA-1 cDNA expression under the control of G1-HRD fully rescued the GATA-1 germ line mutant mouse from lethal dyserythropoiesis.22 Surprisingly, GATA-2 and GATA-3 under G1-HRD regulation also could rescue the GATA-1 knockdown mutant mice from embryonic lethality.22 Thus, the transcriptional regulation of the timing, place, and abundance of GATA-1 gene expression appears to be more important for GATA-1 function than the domain structure and functional specificity of GATA-1. In support of this contention, the overexpression of GATA-1 in erythroid cells caused a defect in erythroid terminal maturation.23 However, since the expression profile of GATA-1 during erythroid differentiation has not been examined in detail, a solid conclusion for the relationship between GATA-1 expression and its functional contribution to erythropoiesis has not yet been formed.
Thus, we set about examining the expression profile of GATA-1 during erythropoiesis through the preparation and analysis of transgenic mouse lines expressing green fluorescent protein (GFP) transgene under the control of G1-HRD (G1-HRD-GFP transgene). We found that GFP expression in these transgenic mice substantially, if not completely, recapitulated the endogenous expression profile of GATA-1. This reliable G1-HRD-GFP expression made it possible to separate the bone marrow cells into 6 consecutive erythroid populations. By means of the purification approach using the GFP (or GATA-1) expression level, 2 classic erythroid progenitors, colony-forming unit-erythroid and burst forming unit-erythroid (CFU-E and BFU-E, respectively) were delineated into discrete subfractions separable by a flow cytometer. The results revealed that the GFPhigh cell fraction contains mainly CFU-E and proerythroblasts, whereas the GFPlow cell fraction contains BFU-E, demonstrating that GATA-1 is expressed at the highest level in CFU-E and proerythroblasts among erythroid differentiation.
In addition, taking advantage of the ability to mark the erythroid progenitors with high efficiency by green fluorescence, we developed a novel method for the real-time detection of CFU-E. As an example of such an approach, we show here detection of the CFU-E in the livers of erythropoietin receptor (EpoR)-deficient mutant embryos, although the conventional colony assay has never detected the presence of CFU-E in the EpoR-null mutant embryos.24 Thus, our novel approach provides an important clue for the analysis of hematopoietic disorders.
Materials and methods
Mice
The G1-HRD (IE3.9int) vector has been described previously.20 In constructing the G1-HRD-GFP transgene, G1-HRD was ligated to GFP cDNA. We established 3 lines of G1-HRD-GFP transgenic mice, and the highest GFP-expressing line was mainly used in this study. For screening the transgenic mice, the tail DNA was extracted and polymerase chain reaction (PCR) was performed using a pair of primers, GFPs4 5′-CTGAAGTTCATCTGCACCACC-3′) and GFPas4 5′-GAAGTTGTACTCCAGCTTGTGC-3′). To induce anemia, 6-week-old mice were injected with 1.2 mg phenylhydrazine (Sigma, St Louis) intraperitoneally on day 1 and day 2. On day 5, the spleen and bone marrow were analyzed. The EpoR-deficient mice25 (Jackson Laboratories, Bar Harbor, ME) were mated with G1-HRD-GFP mice.
Cell sorting
Sorting and analysis of cells were performed using FACSVantage (Becton Dickinson, San Jose, CA). Mononucleated cell suspensions from the bone marrow, spleen, and embryonic day 12.5 (E12.5) fetal liver were prepared and incubated with biotinylated monoclonal antibodies recognizing Mac-1, Gr.1, Ter119, B220, CD4, and CD8. Hematopoietic lineage marker-negative (Lin-) cells were enriched by magnetic separation using streptavidine-conjugated magnetic beads (Polyscience, Warrington, PA) and then stained with PE (phycoerythrin)-conjugated anti-CD71 and APC (allophycocyanin)-conjugated anti-c-Kit antibodies. All antibodies were obtained from BD Pharmingen (San Diego, CA).
Staining of intracellular GATA-1
Cells were fixed on ice for 1 hour with 0.25% paraformaldehyde. After washing, the cells were permeabilized by 3 cycles of freezing and thawing. After one overnight reaction with rat anti-GATA-1 monoclonal antibody (N6),7 the cells were stained with PE-conjugated anti-rat IgG antibody (BD Pharmingen) and analyzed by FACSCalibur (Becton Dickinson).
Colony assay
Sorted cells were cultured in 1 mL of 0.8% methylcellulose medium containing 30% fetal bovine serum (FBS). For detection of CFU-E, medium was supplemented with 4 U/mL Epo. For detection of BFU-E, medium was supplemented with Epo (4 U/mL) and stem cell factor (SCF) (100 ng/mL). SCF, interleukin-3 (IL-3), IL-6 (100 ng/mL each), and Epo (4 U/mL) were added for the formation of the myeloid colonies. Colonies were counted after 3 days (CFU-E) or 7 days (BFU-E and myeloid colonies) of culturing. To distinguish erythroid colonies, colonies were stained with benzidine before counting. All supplemented cytokines were provided by Kirin Brewery (Takasaki, Japan). These assays were performed in triplicate and repeated more than 3 times, and the results are shown with standard deviations.
Reverse transcription-polymerase chain reaction (RT-PCR)
RNA was purified from cells using RNeasy (Qiagen, Basel, Switzerland) and reverse transcribed by SenscriptRT (Qiagen) and random hexamers. PCR was performed for the detection of GATA-1 (pair of primers: 5′-ACTCGTCATACCACTAAGGT-3′ and 5′-AGTGTCTGTAGGCCTCAGCT-3′), GATA-2 5′-ACACACCACCCGATACCCACCTAT-3′ and 5′-GCCTAGCCCATGGCAGTCACCATGCT-3′), c-mpl 5′-AGCTGCTGTCCACAGAAACC-3′ and 5′-GTCATTTCGTGACTTGAAGTGGC-3′), EpoR 5′-GATTCTGGAGTGCCTGGTCTGAGCC-3′ and 5′-GGTGTCGACCTTCAATGGGAACAC-3′), IL-7R 5′-CAAAGTCCGATCCATTCCCCATAAC-3′ and 5′-GTTTTCTTATGATCGGGGAGACTAGG-3′). Hypoxanthine phosphoribosyltransferase (HPRT) was used as an internal control.26 GATA-1 and -2 mRNA levels were also measured quantitatively using primer pairs 5′-CAGAACCGGCCTCTCATCC-3′ and 5′-TAGTGCATTGGGTGCCTGC-3′ for GATA-1; 5′-GAATGGACAGAACCGGCC-3′ and 5′-AGGTGGTGGTTGTCGTCTGA-3′ for GATA-2 and a VIC-labeled oligo-DNA probe 5′-CCCAAGAAGCGAATGATTGTCAGCAAA-3′ for GATA-1; 5′-AAGCGGAGGCTGTCTGCTGCCAG-3′ for GATA-2 by ABI PRISM 7700 (Perkin-Elmer, Foster City, CA). Glyceraldehyde phosphate dehydrogenase (GAPDH) was used as internal standard (primer pair, 5′-GAAGGTGAAGGTCGGAGTC-3′ and 5′-GAAGATGGTGATGGGATTTC-3′; JOE-labeled probe, 5′-CAAGCTTCCCGTTCTCAGCC-3′).
Measurement of the intracellular-free calcium
Bone marrow cells were incubated with 3 μM Indo-1-am (Molecular Probes, Eugene, OR) for 30 minutes at 37°C then stained on ice with PE-conjugated anti-c-Kit or anti-Ter119 antibodies. Cells were incubated with ionomycin (3 μg/mL, Calbiochem, Darmstadt, Germany) or 10 U/mL Epo at 37°C for 30 minutes. The ratio of florescence intensity (405 nm/480 nm) was measured by BD-LSR (Becton Dickinson).27
Results
GFP and GATA-1 expression in the hematopoietic progenitor fraction from G1-HRD-GFP transgenic mouse
Several lines of evidence have demonstrated that G1-HRD, the GATA-1 gene hematopoietic regulatory domain, markedly recapitulates the endogenous expression profile of GATA-1 in the erythroid lineage.3,20 In order to identify hematopoietic cells expressing GATA-1, we established 3 transgenic mouse lines that express GFP reporter gene under the control of G1-HRD. We first analyzed the GFP expression profile in the transgenic mice using the fluorescent microscope. The expression of GFP was observed specifically in hematopoietic tissues, including yolk sac, fetal liver, spleen, and bone marrow (data not shown), showing very good agreement with our previous analyses.20,22,26,28 Microscopic analysis also detected the expression of GFP in peripheral enucleated red blood cells and platelets (data not shown), perhaps due to the stable nature of GFP.
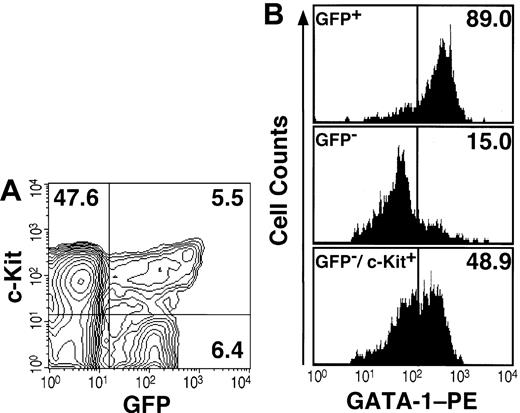
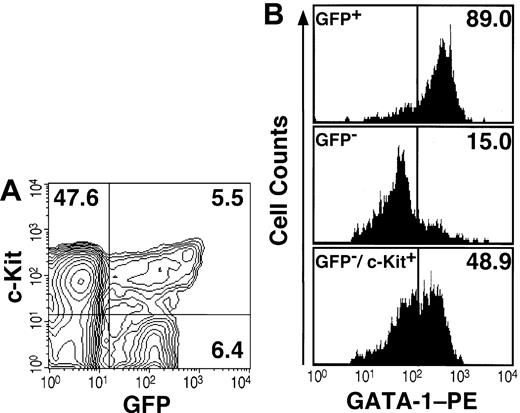
We then analyzed the expression of GFP by fluorescence activated cell sorting (FACS). Within the mononucleated cell (MNC) fraction from bone marrow, most Ter119-positive erythroid cells (data not shown) and 12% of lineage marker-negative (Lin-) cells expressed GFP (Figure 1A). Since the Lin-/c-Kit+ fraction contains hematopoietic progenitors, we analyzed the expression of GFP and c-Kit in the Lin- fraction from transgenic bone marrow. Approximately 10% of Lin-/c-Kit+ cells expressed GFP, whereas half of the GFP+ cells in the Lin- fraction were c-Kit- (Figure 1A). Morphological analyses revealed that the GFP+/Lin-/c-Kit+ fraction contains erythroblasts and many eosinophils with eosinophilic granules (data not shown). Interestingly, essential roles for GATA-1 in eosinophil development have been reported.12,13
Expression analyses of GFP and GATA-1 in hematopoietic progenitors. (A) The Lin- fraction from the bone marrow of the G1-HRD-GFP transgenic mouse was stained with APC-conjugated anti-c-Kit antibody and analyzed by FACS. The percentage of cells in each quadrangle is shown. (B) Immunostaining of intracellular GATA-1 in the sorted cells. Almost all GFP+ cells in the Lin- fraction were GATA-1 positive (top panel). Most GFP- cells in the Lin- fraction were GATA-1-negative (middle). The Lin-/c-Kit+/GFP- fraction contains approximately half of GATA-1-positive cells (bottom panel).
Expression analyses of GFP and GATA-1 in hematopoietic progenitors. (A) The Lin- fraction from the bone marrow of the G1-HRD-GFP transgenic mouse was stained with APC-conjugated anti-c-Kit antibody and analyzed by FACS. The percentage of cells in each quadrangle is shown. (B) Immunostaining of intracellular GATA-1 in the sorted cells. Almost all GFP+ cells in the Lin- fraction were GATA-1 positive (top panel). Most GFP- cells in the Lin- fraction were GATA-1-negative (middle). The Lin-/c-Kit+/GFP- fraction contains approximately half of GATA-1-positive cells (bottom panel).
To examine the specificity of the GFP expression, we compared the expression profile of GFP with that of GATA-1 protein. To this end, immunostaining of intracellular GATA-1 in FACS-sorted bone marrow cells was conducted. The result revealed that almost all GFP+ cells were positive for intracellular GATA-1 staining (Figure 1B, top panel), whereas only 15% of cells in the GFP- fraction were GATA-1 positive (middle panel). Similarly, when Lin-/c-Kit+ cells were sorted into GFP+ and GFP- fractions, almost all GFP+ cells were GATA-1 positive (data not shown). In contrast, approximately 50% of cells in the GFP-/Lin-/c-Kit+ fraction expressed endogenous GATA-1 (Figure 1B, bottom panel). One plausible explanation for this discrepancy is that the G1-HRD may not contain the sufficient regulatory sequence to recapitulate fully the GATA-1 gene expression in the erythroid progenitors at immature stages of differentiation. As these data were reproducible in the other 2 G1-HRD-GFP transgenic mouse lines, the consistency of the GFP expression with that of the endogenous GATA-1 were demonstrated.
BFU-E and CFU-E are concentrated in the CD71-/GFP+ and CD71+/GFP+ fractions, respectively
To characterize the hematopoietic progenitors expressing GATA-1, we examined GFP expression in the Lin-/c-Kit+ fraction of G1-HRD-GFP transgenic mice. The bone marrow cells in the Lin-/c-Kit+ fraction were stained with PE-conjugated anti-CD71 antibody and analyzed by FACS (Figure 2A). CD71 is the transferrin receptor (TfR) and is known as a marker for proliferating hematopoietic cells.29 The GFP-positive fraction was clearly divided into 2 fractions by the expression of CD71. The green fluorescent intensity of GFP+/CD71+ cells was higher than that of GFP+/CD71- cells (Figure 2A). The mean fluorescent intensities of the GFP+/CD71+ and GFP+/CD71- fractions were 360 and 125, respectively. It should be noted that the GFP+/CD71+ fraction is small (4.1% of Lin-/c-Kit+ cells) but contains solely the high level GFP-expressing cells (Figure 2A).
Colony assay of GFP+ cells in the bone marrow. (A) The Lin-/c-Kit+ fraction is subdivided into 4 fractions with the expression of GFP and CD71. The percentage of cells in each quadrangle is shown. Cells in each fraction were sorted and cultured with only Epo (B), Epo and SCF (C), or Epo, SCF IL-6, and IL-3 (D). Colonies were counted 3 days (B) or 7 days (C, D) after culturing. (E) A colony derived from CFU-E in the CD71+/GFP+ fraction was stained by benzidine (left panel, blue staining), and some of the cells in the colony were detected by GFP expression under the fluorescent microscope (right panel). (F) A mixed colony derived from a CD71-/GFP+ cell was observed by bright (top panel) and fluorescent (middle panel) microscopy. GFP expression was detected in red cells (erythrocytes [E]) and large cells (megakaryocytes [Mk]) but not in small white cells (granulocytes [G]) and large extended cells (macrophages [Mc]). The top and middle panels were merged in the bottom panel (F). Original magnifications, × 200 (E) and × 100 (F).
Colony assay of GFP+ cells in the bone marrow. (A) The Lin-/c-Kit+ fraction is subdivided into 4 fractions with the expression of GFP and CD71. The percentage of cells in each quadrangle is shown. Cells in each fraction were sorted and cultured with only Epo (B), Epo and SCF (C), or Epo, SCF IL-6, and IL-3 (D). Colonies were counted 3 days (B) or 7 days (C, D) after culturing. (E) A colony derived from CFU-E in the CD71+/GFP+ fraction was stained by benzidine (left panel, blue staining), and some of the cells in the colony were detected by GFP expression under the fluorescent microscope (right panel). (F) A mixed colony derived from a CD71-/GFP+ cell was observed by bright (top panel) and fluorescent (middle panel) microscopy. GFP expression was detected in red cells (erythrocytes [E]) and large cells (megakaryocytes [Mk]) but not in small white cells (granulocytes [G]) and large extended cells (macrophages [Mc]). The top and middle panels were merged in the bottom panel (F). Original magnifications, × 200 (E) and × 100 (F).
Based on these results, we speculate that the expression of the G1-HRD-GFP transgene can be used to separate the erythroid progenitor fraction from the fraction containing progenitors for the other hematopoietic lineages within the bone marrow cells. Especially, we hypothesized that the CD71 marker might separate the erythroid progenitors into 2 fractions in collaboration with high- and low-level GFP expression.
To test this hypothesis, we carried out a colony assay using cells in these fractions. The GFP+/CD71+ fraction contained CFU-E abundantly, but there were no other colony-forming cells (Figure 2B-D). The GFP+/CD71- fraction also contained CFU-E, but the number was much less than that in the GFP+/CD71+ fraction (Figure 2B). Importantly, we found that 1.5% of cells in this fraction formed BFU-E-derived colonies (Figure 2C). In addition, a few colonies were found to contain only megakaryocytes (Mk) or megakaryocytes and erythrocytes (EM, common precursor of megakaryocyte and erythrocyte) in the GFP+/CD71- fraction. We also observed a few colonies containing granulocytes, erythrocytes, megakaryocytes, and macrophages (GEMM, mixed colony) in the GFP+/CD71- fraction (Figure 2D). BFU-E also was included in the GFP-/CD71- fraction, but this fraction contained many myeloid colony-forming cells including CFU-GM (granulocyte and macrophage) and CFU-GEMM. There were colony-forming unit-granulocyte and -macrophage in the GFP-/CD71+ fraction, but no other colonies were observed (Figure 2B-D).
The benzidine-positive (ie, hemoglobinized erythroid) cells in the CFU-E-derived colony from the GFP+/CD71+ fraction expressed various intensities of green fluorescence (Figure 2E). GFP expression also was detected in megakaryocytes and erythroid cells, but not in granulocytes and macrophages, in the mixed colonies derived from the GFP+/CD71- fraction (Figure 2F). We also observed GFP-positive megakaryocytes and erythroid cells in the mixed colonies derived from the GFP-/CD71- fraction (data not shown). These results suggest that the GFP-/CD71- and GFP+/CD71- fractions may contain progenitors differentiating into the cells in the GFP+/CD71+ fraction. GFP expression changes dynamically during erythroid and megakaryocytic cell differentiation. We noticed, through flow cytometry and microscopic analyses, that in all the GFP+ cells in these colonies, green fluorescent intensity was weaker than in primary c-Kit+ cells in the bone marrow (data not shown and Figure 2E-F). This observation further supports our contention that the expression level of GATA-1 in erythroid progenitors decreases along with progenitor cell differentiation.
Based on these results, we propose that Lin-/c-Kit+/GFP+/CD71- cells in the bone marrow are an early erythroid progenitor (EEP) fraction containing BFU-E in abundance, whereas Lin-/c-Kit+/GFP+/CD71+ cells are a late erythroid progenitor (LEP) fraction containing abundantly CFU-E. Thus, we report here for the first time the efficient enrichment of CFU-E and BFU-E erythroid progenitors from normal bone marrow cells using flow cytometry.
Gene expression and morphology of early and late erythroid progenitors
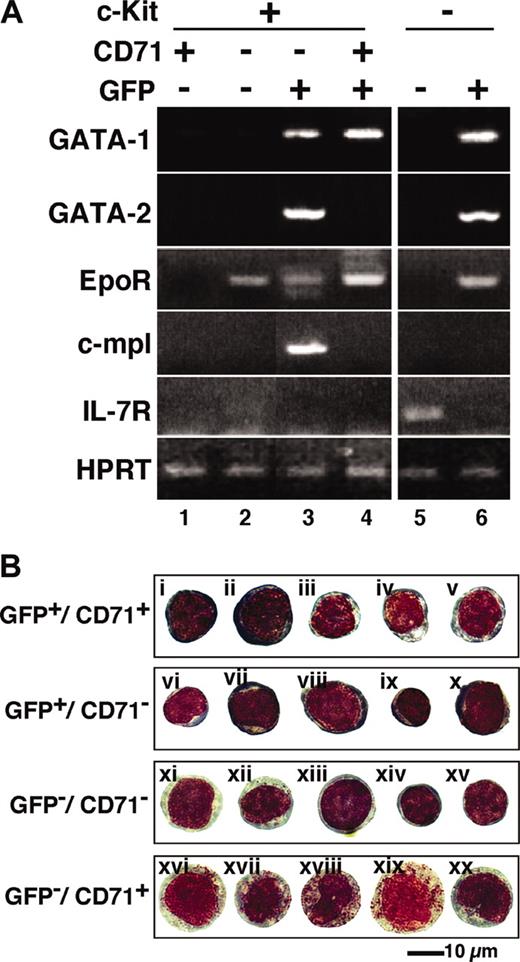
In order to characterize the erythroid progenitor fractions EEP and LEP, we sorted the mouse bone marrow cells of each fraction by FACS and defined their gene expression profiles through RT-PCR analysis. As expected, the expression of GATA-1 mRNA was detected predominantly in the GFP+ fractions (Figure 3A, lanes 3, 4, and 6), and the level was higher in the LEP fraction (Lin-/c-Kit+/GFP+/CD71+) than that in the EEP fraction (Lin-/c-Kit+/GFP+/CD71-). Consistent with our antibody permeation analysis (Figure 1B), GATA-1 expression also was detected, albeit very weakly, in the c-Kit+/GFP- fraction (lane 2; see “Change in GATA-1 expression level during erythroid differentiation”).
Gene expression and morphology of GFP+progenitor cells. (A) RNA was extracted from the sorted cells in the indicated fractions, and RT-PCR was performed to detect GATA-1, GATA-2, EpoR, c-mpl, and IL-7R expression. The bone marrow Lin-/c-Kit+ hematopoietic progenitor fraction was subdivided into 4 fractions (lanes 1-4). EEP and LEP fractions are represented in lanes 3 and 4, respectively. GFP- (lane 5) and GFP+ (lane 6) cells in the Lin-/c-Kit- fractions also are shown. (B) The morphology of the sorted cells are shown by Wright-Giemsa staining. Proerythroblast-like cells were detected in the LEP fraction (GFP+/CD71+; i,ii). It is likely that erythroid progenitors are i, ii, iii, iv, v, and vi in the LEP and EEP (GFP+/CD71-) fractions. All cells in the GFP-/CD71+ fraction contained azurophil granules (xvi-xx).
Gene expression and morphology of GFP+progenitor cells. (A) RNA was extracted from the sorted cells in the indicated fractions, and RT-PCR was performed to detect GATA-1, GATA-2, EpoR, c-mpl, and IL-7R expression. The bone marrow Lin-/c-Kit+ hematopoietic progenitor fraction was subdivided into 4 fractions (lanes 1-4). EEP and LEP fractions are represented in lanes 3 and 4, respectively. GFP- (lane 5) and GFP+ (lane 6) cells in the Lin-/c-Kit- fractions also are shown. (B) The morphology of the sorted cells are shown by Wright-Giemsa staining. Proerythroblast-like cells were detected in the LEP fraction (GFP+/CD71+; i,ii). It is likely that erythroid progenitors are i, ii, iii, iv, v, and vi in the LEP and EEP (GFP+/CD71-) fractions. All cells in the GFP-/CD71+ fraction contained azurophil granules (xvi-xx).
We found that mRNAs for GATA-2 and c-mpl were highly expressed in the EEP fraction (Figure 3A, lane 3). The expression of these mRNAs could not be detected in the LEP fraction. The expression of GATA-1 and GATA-2 mRNAs also was detected in the Lin-/c-Kit-/GFP+ fraction containing eosinophils and erythroblasts (lane 6). This agrees closely with our previous analysis showing that eosinophils express GATA-1 and GATA-2.12 Importantly, erythropoietin receptor (EpoR) mRNA was expressed in the fractions expressing GATA-1, and this result shows excellent agreement with the notion that EpoR is expressed most abundantly at the CFU-E stage and is essential for the survival and differentiation of the CFU-E.24
Our data demonstrate that c-mpl is specifically expressed in the EEP fraction (lane 3), which contains 2 megakaryocyte progenitors, CFU-Mk and CFU-EM (Figure 2). Although we could not detect c-mpl expression in the Lin-/c-Kit+/GFP-/CD71- fraction (lane 2), which contains hematopoietic stem cells (HSCs), there are many reports showing c-mpl expression in the HSC.30 The Lin-/c-Kit+/GFP-/CD71- fraction contains not only HSCs, but also progenitors for various other hematopoietic lineages. Therefore, c-mpl expression in the HSC might have been diluted so that we could not detect its expression. The expression of interleukin-7 receptor (IL-7R) was detected specifically in the Lin-/c-Kit-/GFP- fraction (Figure 3A, lane 5). Since IL-7R is a good marker for the lymphoid lineage,30 this fraction seems to contain mainly lymphoid progenitors, which do not express GATA-1, GATA-2, EpoR, or c-mpl.
We then examined the morphology of the sorted cells in the c-Kit+ fraction. In the LEP (GFP+/CD71+) fraction, there were many proerythroblast-like cells, which were stained deep purple in the cytoplasm and deep red in the nuclei compared with other GFP+ cells by Wright-Giemsa staining (Figure 3Bi-ii). The nuclei appeared to be loose and coarse. No basophilic or polychromatic erythroblasts were observed in the c-Kit+ fraction (Figure 3B). The LEP fraction also contained cells with light purple-colored cytoplasm, which seem to be CFU-E, as judged by colony assay (iii-iv). These CFU-E-like cells also were observed in the EEP fraction (v). On the contrary, we could not delineate as to which cells correspond to BFU-E or megakaryocytic progenitors in the EEP (GFP+/CD71-) fraction. All cells in the GFP-/CD71+ fraction had azurophilic granules (xvi-xx), indicating that this fraction contains myeloid progenitors. Thus, the G1-HRD-GFP reporter transgene enabled us to divide the CD71+ fraction into myeloid and erythroid lineages. Finally, showing excellent agreement with our assignment through colony assays, the GFP-/CD71- fraction appears to contain multilineage progenitors (xiv-xv) and early myeloid cells (xi-xii).
Change in GATA-1 expression level during erythroid differentiation
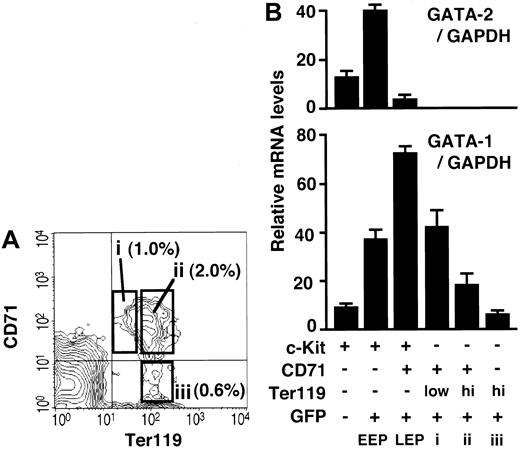
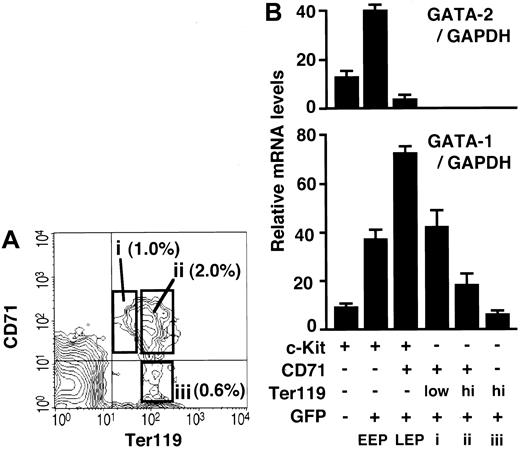
In the previous sections, we identified and isolated c-Kit+ progenitors corresponding to the 3 consecutive stages of erythroid differentiation from the bone marrow of G1-HRD-GFP transgenic mice. In this regard, one preceding report demonstrated that the expression level of CD71 decreases and that of Ter119 increases during late erythroblast maturation in the spleen.31 According to the report, proerythroblast (CD71+/Ter119low), basophilic and polychromatic erythroblast (CD71+/Ter119high), and orthochromatic erythroblast (CD71-/Ter119high) can be separated from the spleen by flow cytometry.31 We therefore examined CD71 and Ter119 expressions in the bone marrow of G1-HRD-GFP mice and found that bone marrow cells also contain these 3 erythroblast fractions (Figure 4A). The morphology of the bone marrow and spleen cells in these fractions was similar (data not shown), suggesting that bone marrow cells can also be separated into 3 late erythroid progenitors by means of CD71 and Ter119 antigens.
Quantitative analyses of GATA-1 and GATA-2 mRNAs during erythroid differentiation. (A) Bone marrow cells were analyzed for CD71 and Ter119 expression. Cells in open boxes (i-iii) were sorted and analyzed for GATA-1 expression level in B. The percentage of cells in each box is shown. (B) The relative GATA-1 and GATA-2 mRNA levels at different stages of erythroid cell development were measured by quantitative RT-PCR and normalized to the level of GAPDH mRNA. Erythroid differentiation is indicated by the x-axis from left to right.
Quantitative analyses of GATA-1 and GATA-2 mRNAs during erythroid differentiation. (A) Bone marrow cells were analyzed for CD71 and Ter119 expression. Cells in open boxes (i-iii) were sorted and analyzed for GATA-1 expression level in B. The percentage of cells in each box is shown. (B) The relative GATA-1 and GATA-2 mRNA levels at different stages of erythroid cell development were measured by quantitative RT-PCR and normalized to the level of GAPDH mRNA. Erythroid differentiation is indicated by the x-axis from left to right.
We envisage from these analyses that we could obtain erythroid lineage cells from 6 consecutive stages of differentiation. We examined the expression profiles of GATA-1 and GATA-2 during erythroid differentiation using sorted bone marrow cells by RT-PCR analysis. The results of the quantitative RT-PCR are shown as a graph (Figure 4B). The results clearly demonstrate that GATA-1 increases from EEP to LEP and decreases during maturation of erythroid progenitors. The LEP fraction (Lin-/c-Kit+/GFP+/CD71+) expresses GATA-1 at the highest level throughout the 6 stages of erythroid differentiation, based on the RT-PCR and green fluorescent intensity data. On the other hand, the expression level of GATA-2 is the highest in the EEP fraction and is decreased to undetectable level after the LEP stage of differentiation (Figure 4B). This is the first report demonstrating a fluctuation in the GATA-1 and -2 expression levels during in vivo erythropoiesis.
The number of GFP-positive erythroid progenitors increases in the anemic spleen
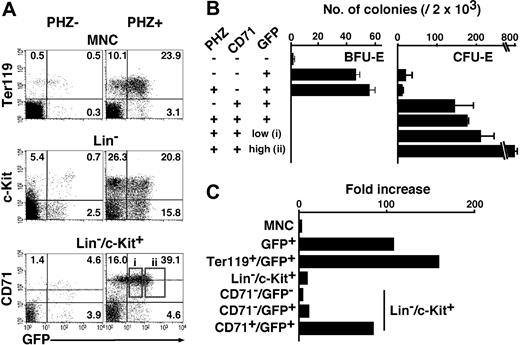
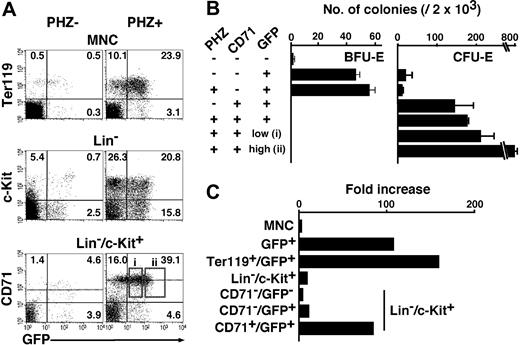
To clarify whether erythroid fractions similar to the EEP and LEP also exist in the spleen, we examined the expression of GFP in the spleen of the G1-HRD-GFP transgenic mice. To our expectation, we identified both EEP (Lin-/c-Kit+/GFP+/CD71-) and LEP (Lin-/c-Kit+/GFP+/CD71+) fractions in the spleen (Figure 5A). The EEP and LEP fractions consisted of 3.9% and 4.6% of Lin-/c-Kit+ cells, respectively. Colony assays revealed that the spleen EEP and LEP fractions contain mainly BFU-E and CFU-E, respectively (Figure 5B), as was the case for the bone marrow.
FACS analysis and colony assay of the normal and anemic spleen ofG1-HRD-GFPtransgenic mouse. (A) Spleen mononucleated cells (MNCs) were obtained from G1-HRD-GFP transgenic mice before (PHZ-, left) and after (PHZ+, right) injection of phenylhydrazine (PHZ). The MNC, Lin- fraction, and Lin-/c-Kit+ fraction were analyzed by FACS (top, middle, and bottom panels, respectively). The percentage in each quadrangle is shown. The dotted lines show the mean intensities of CD71 expression in CD71+/GFP+ fractions (bottom panels). (B) Results of colony assay in the normal and anemic spleens. Two thousand cells from the indicated fractions were analyzed. Fractions i and ii are shown by open boxes in A. (C) The cell number of the erythroid fractions of the spleen were increased by PHZ injection. Fold increases between the PHZ-induced anemic spleens, and normal spleens are indicated in this graph. The results are shown with standard deviations.
FACS analysis and colony assay of the normal and anemic spleen ofG1-HRD-GFPtransgenic mouse. (A) Spleen mononucleated cells (MNCs) were obtained from G1-HRD-GFP transgenic mice before (PHZ-, left) and after (PHZ+, right) injection of phenylhydrazine (PHZ). The MNC, Lin- fraction, and Lin-/c-Kit+ fraction were analyzed by FACS (top, middle, and bottom panels, respectively). The percentage in each quadrangle is shown. The dotted lines show the mean intensities of CD71 expression in CD71+/GFP+ fractions (bottom panels). (B) Results of colony assay in the normal and anemic spleens. Two thousand cells from the indicated fractions were analyzed. Fractions i and ii are shown by open boxes in A. (C) The cell number of the erythroid fractions of the spleen were increased by PHZ injection. Fold increases between the PHZ-induced anemic spleens, and normal spleens are indicated in this graph. The results are shown with standard deviations.
Upon induction of anemia with phenylhydrazine (PHZ), the number of GFP+ cells in the spleen was markedly increased. Fold increases in various GFP+ fractions in the PHZ-induced anemic spleens from normal mouse spleen are indicated in Figure 5C. The numbers of the erythroblast (Ter119+/GFP+) and LEP cells were increased approximately 100-fold. Importantly, we detected GFPhigh and GFPlow fractions in the latter fraction of anemic spleen (Figure 5A, boxes i,ii), which were CD71+. When we examined the colony-forming activity of these subfractions, we found, surprisingly, that more than 40% of cells in the box ii subfraction formed CFU-E-derived colonies (Figure 5B). To our knowledge, this is the most efficient strategy for isolating CFU-E.
Consistent with the previous observation that CFU-E increased in the anemic spleen by about 100-fold,32 the total number of the cells in the LEP fraction increased by approximately 100-fold (Figure 5C). Since the number of CFU-E-derived colonies also increased (Figure 5B) concomitantly with an increase in the LEP fraction (Figure 5C), the frequency of CFU-E in the LEP fraction does not change much in the normal and anemic spleen. This observation suggests that anemic stimuli similarly increase not only the CFU-E, but also the rest of the cells in the LEP fraction.
The means of CD71-PE fluorescent intensities, which are shown by dotted lines in Figure 5A (bottom panels), were 100 and 300 in normal and anemic spleens, respectively, indicating that the expression of CD71 in each cell in the LEP fraction was increased in the anemic mice. These data are consistent with reports that TfR gene expression is induced by hypoxia and proliferation signals.29,33 Intriguingly, while the TfR expression level was induced in the LEP fraction, it remained not to be expressed in the EEP fraction (Figure 5A). Taken together, there are both EEP and LEP fractions in the spleen, as is the case in the bone marrow, and the LEP cells are dramatically increased in the anemic condition.
GFP expression in normal and dyserythropoietic fetal livers
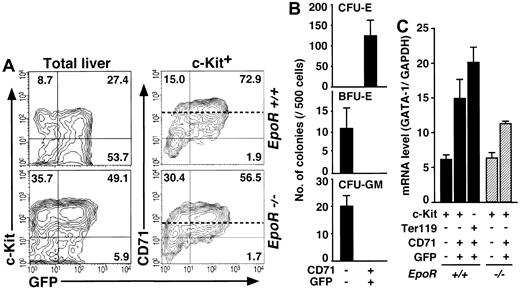
To clarify whether the G1-HRD-GFP transgene faithfully recapitulates the expression profile of the GATA-1 gene in fetal liver, we examined the E12.5 fetal liver of the transgenic mouse. FACS analyses revealed that there were GFP+ cells in the Ter119+ erythroblasts (data not shown) and in the c-Kit+ hematopoietic progenitors, as was the case for the mouse bone marrow and spleen (Figure 6A, upper left panel). To our surprise, however, c-Kit+ fetal liver cells were divided into 2 main populations, GFP+/CD71+ and GFP-/CD71- (Figure 6A, upper right panel). We could not find a GFP+/CD71- cell fraction, which corresponds to the EEP fraction in the adult hematopoietic tissues.
Analyses of normal and abnormal fetal erythropoiesis by theG1-HRD-GFPtransgene. (A) Total (left) and c-Kit+ (right) cells from wild-type (top) and EpoR-null (bottom) E12.5 fetal livers with G1-HRD-GFP transgene were analyzed by FACS. The percentage in each quadrangle is shown. The means of the CD71 expression levels in the CD71+ fractions from each embryo are indicated by dotted lines. (B) Colony assay of sorted cells from G1-HRD-GFP transgenic fetal liver. (C) Result of the quantitative RT-PCR analysis of GATA-1 in EpoR+/+::G1-HRD-GFP+ (closed bars) and EpoR-/-::G1-HRD-GFP+ (hatched bars) fetal liver cell fractions. The GATA-1 mRNA levels were normalized to the level of GAPDH mRNA. The results are shown with standard deviations.
Analyses of normal and abnormal fetal erythropoiesis by theG1-HRD-GFPtransgene. (A) Total (left) and c-Kit+ (right) cells from wild-type (top) and EpoR-null (bottom) E12.5 fetal livers with G1-HRD-GFP transgene were analyzed by FACS. The percentage in each quadrangle is shown. The means of the CD71 expression levels in the CD71+ fractions from each embryo are indicated by dotted lines. (B) Colony assay of sorted cells from G1-HRD-GFP transgenic fetal liver. (C) Result of the quantitative RT-PCR analysis of GATA-1 in EpoR+/+::G1-HRD-GFP+ (closed bars) and EpoR-/-::G1-HRD-GFP+ (hatched bars) fetal liver cell fractions. The GATA-1 mRNA levels were normalized to the level of GAPDH mRNA. The results are shown with standard deviations.
Colony assay was then performed exploiting c-Kit+/CD71-/GFP- and c-Kit+/CD71+/GFP+ cells from the fetal liver. Like the LEP fraction of the adult bone marrow, the c-Kit+/CD71+/GFP+ fraction contained CFU-E (Figure 6B). On the other hand, BFU-E and CFU-GM cells resided in the GFP-/CD71- fraction (Figure 6B).
We then examined the expression levels of GATA-1 mRNA in these fetal liver cell fractions by quantitative RT-PCR. The expression level of GATA-1 in the c-Kit+/CD71-/GFP- fraction (containing BFU-E) was less than 45% of that in the c-Kit+/CD71+/GFP+ fraction (containing CFU-E, Figure 6C). These results indicate that G1-HRD is not active in BFU-E in the fetal liver, even though they expressed GATA-1 endogenously; in other words, G1-HRD is insufficient for gene expression in fetal liver BFU-E. We thus suggested that the fetal liver CD71+/GFP+ fraction is the counterpart of the LEP fraction in the adult hematopoietic tissues, and the counterpart of the EEP fraction must be contained in the CD71-/GFP- fraction. Upon normalizing the GATA-1 mRNA levels in the fetal liver and bone marrow cell fractions with that of GAPDH, we found it interesting that the GATA-1 levels in all of the liver fractions were lower than those in the bone marrow EEP and LEP fractions (Figures 4B, 6C).
It has been reported that fetal liver cells from erythropoietin receptor (EpoR)-null mutant embryos form CFU-E-derived colonies when they are infected with the retrovirus vector expressing EpoR.24 This observation suggests that there may be CFU-E in the embryonic liver of the EpoR-null mutant, but that the cells cannot be detected by colony assay without the retroviral complementation of EpoR. In order to ascertain the presence of CFU-E in the liver of EpoR-null mutant embryos, we examined G1-HRD-GFP expression. The G1-HRD-GFP transgene was introduced into EpoR-/- mice by breeding, and FACS analysis was performed exploiting the liver of EpoR-/-::G1-HRD-GFP+ embryos.
Our study shows good agreement with previous reports that there are only a residual number of Ter119+ cells in the liver of EpoR-null mutant embryos.26 In contrast, however, our study revealed a comparable number of c-Kit+ cells (7.0∼9.0 × 10⁴/liver) to that of wild-type (Figure 6A). Similar to the wild-type case, the c-Kit+ cells were subdivided into CD71-/GFP- and CD71+/GFP+ fractions (Figure 6A, right panels). The level of GATA-1 mRNA and green fluorescent intensities in these fractions were comparable to that of wild-type embryos (Figure 6A,C). It is noteworthy that the mean intensity of CD71 expression in the CD71+/GFP+ fraction of the EpoR-null embryo was about 30% of that of wild type (55 and 190, respectively), perhaps reflecting the cellular proliferating activity (dotted lines in Figure 6A). Thus, our approach using the flow cytometer and G1-HRD-GFP transgene enabled the development of a new method for investigating the existence of CFU-E in various hematopoietic disorders.
Change in the intracellular calcium ion storage during erythroid maturation
Taking advantage of the progress achieved here in isolating erythroid progenitors from mouse bone marrow, we attempted to settle the controversy over the effect of Epo on the mobility of intracellular calcium ions in erythroid cells. When calcium ions are effused from the endoplasmic reticulum (ER) by various signals, the intracellular free calcium ion (IFC) plays a role in cellular signal transduction. Whereas there are many reports concerning the role of Ca2+ as a second messenger in Epo signal transduction in erythroid cells, it remains unclear whether Epo induces the increase of IFC in primary hematopoietic cells.34
We exploited erythroid progenitor fractions isolated from the bone marrow of a G1-HRD-GFP transgenic mouse and measured the concentration of IFC by indo-1 staining and flow cytometry in the presence or absence of Epo. Treatment of the cells with Epo for 5 to 30 minutes induced IFC in c-Kit-/GFP+ (3.3%) and Ter119+/GFP+ (4.4%) cells, but not in the other fractions (Figure 7). This suggests that, if calcium is involved in Epo signaling, its role is likely specific to Ter119+ erythroblasts rather than to c-Kit+ erythroid progenitors.
Measurement of intracellular free calcium concentration upon exposure to Epo and ionomycin in the bone marrow cell fractions. Bone marrow cells from G1-HRD-GFP transgenic mice were analyzed for their intracellular free calcium concentration after supplementation of Epo (10 U/mL) or ionomycin (3 μg/mL) by Indo-1 flow cytometry. The percentages of cells containing IFC in each fraction are indicated.
Measurement of intracellular free calcium concentration upon exposure to Epo and ionomycin in the bone marrow cell fractions. Bone marrow cells from G1-HRD-GFP transgenic mice were analyzed for their intracellular free calcium concentration after supplementation of Epo (10 U/mL) or ionomycin (3 μg/mL) by Indo-1 flow cytometry. The percentages of cells containing IFC in each fraction are indicated.
We then examined total cellular [Ca2+], since Ca2+ is also known to be an important factor for maintenance of the red cell membrane structure.35 The calcium ionophore, ionomycin, forces the release of total Ca2+ from the ER, enabling us to measure the total cellular [Ca2+]. We analyzed various cell fractions from the bone marrow by indo-1 staining and flow cytometry after exposure to ionomycin for 30 minutes. Most of the cells in the Ter119+ erythroblast fraction retained a high concentration of Ca2+, but the other cell fractions (c-Kit+ or Ter119-) contained less than 10% of cells retaining Ca2+ (Figure 7). These results demonstrate that Ca2+ is accumulated during the differentiation of erythroid progenitors into erythroblasts. Taken together, these data suggest that the intracellular calcium concentration plays important roles in the regulation of Epo signal transduction and maintenance of erythrocyte structure in erythroblasts but not in erythroid progenitors.
Discussion
This study unveils, for the first time, the dynamic changes in the expression level of GATA-1 during erythropoiesis. We have divided erythroid lineage cells into 6 consecutive stages of differentiation by means of G1-HRD-GFP transgene expression. Especially, we identified 2 new erythroid cell fractions, Lin-/c-Kit+/CD71+/GFPhigh and Lin-/c-Kit+/CD71-/GFPlow, in the mouse bone marrow and named them as LEP (late erythroid progenitor) and EEP (early erythroid progenitor) fractions, respectively. These fractions also exist in the spleen and embryonic liver. GFP expression made it possible to design an efficient enrichment procedure for these erythroid progenitors from hematopoietic tissues.
We exploited CD71/TfR antigen in this cell fractionation method, as the number of CFU-E-derived colonies was reported to increase upon supplementation of the culture medium with transferrin.36 Interestingly, there was no change in the number of BFU-E by such treatment.36 Through expression analysis of the transcription factor genes, we further revealed that EEP cells coexpress both GATA-1 and GATA-2, whereas LEP cells do not express GATA-2 but highly express GATA-1. This observation shows very good agreement with the previous observation that the GATA-2 expression was down-regulated but that of GATA-1 was up-regulated during erythroid cell differentiation.37 Since GATA-2 overexpression inhibits erythroid differentiation,38 this change in the expression of GATA factors seems to be important for normal erythropoiesis. The decisive moment at which this switching of GATA factors seems to occur is during the differentiation stages between EEP and LEP.
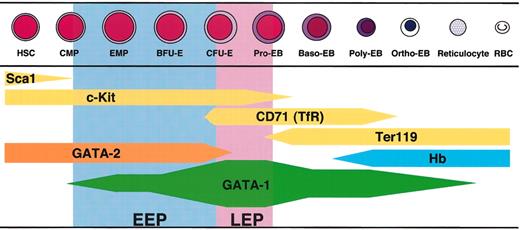
The dynamical change of GATA-1 expression level along with the erythroid differentiation is summarized in Figure 8. This GATA-1 expression profile provides a couple of important clues for understanding GATA-1 function in erythroid lineage cells. First, the highest expression of GATA-1 is observed in the LEP stage, which is before the accumulation of hemoglobin.31 CD71/TfR is highly expressed at this stage and acts in the cellular uptake of the iron-transferrin complex. The LEP cells also appear to vigorously synthesize heme through GATA-1-mediated transactivation of heme biosynthesis enzyme genes, such as those coding for erythroid 5-aminolevulinate synthase (ALAS-E) and porphobilinogen deaminase. Consistent with this notion, mutation of the GATA-1 gene was shown to repress the expression of these heme biosynthetic enzymes.18 Since the defect of heme biosynthesis by mutation of the ALAS-E gene causes decrease of the TfR expression,39 we suggest that the high expression of GATA-1 that induces synthesis of heme is needed for the TfR expression in the LEP cells. Thus, abundant expression of GATA-1 must be required for the differentiation of erythroid progenitors at the LEP stage.
Summary of the GATA-1 expression profile during erythroid differentiation. The thickness of the bar indicates the level of gene expression. GATA-1 expression starts at the bipotential (erythrocyte and megakaryocyte) progenitor stage (EMP, erythroid/megakaryocytic precursors) and increases upon differentiation into the proerythroblast. Sca1, c-Kit, and GATA-2 were expressed in hematopoietic stem cells (HSCs) and common myeloid progenitors (CMPs), and their expressions decrease with the progression of differentiation. 30 When the expression level of GATA-1 decreases in Ter119+ erythroblasts, hemoglobin (Hb) accumulates in the cells.31 Pro-EB indicates proerythroblast; Baso-EB, basophilic erythroblast; Poly-EB, polychromatic erythroblast; Ortho-EB, orthochromatic erythroblast; RBC, red blood cell.
Summary of the GATA-1 expression profile during erythroid differentiation. The thickness of the bar indicates the level of gene expression. GATA-1 expression starts at the bipotential (erythrocyte and megakaryocyte) progenitor stage (EMP, erythroid/megakaryocytic precursors) and increases upon differentiation into the proerythroblast. Sca1, c-Kit, and GATA-2 were expressed in hematopoietic stem cells (HSCs) and common myeloid progenitors (CMPs), and their expressions decrease with the progression of differentiation. 30 When the expression level of GATA-1 decreases in Ter119+ erythroblasts, hemoglobin (Hb) accumulates in the cells.31 Pro-EB indicates proerythroblast; Baso-EB, basophilic erythroblast; Poly-EB, polychromatic erythroblast; Ortho-EB, orthochromatic erythroblast; RBC, red blood cell.
Secondly, we demonstrate here that the level of GATA-1 decreases after the erythroid progenitor stage (Figure 4). Since constitutive overexpression of GATA-1 in erythroblasts inhibits cell maturation,23 this down-regulation of GATA-1 must be necessary for terminal maturation of the erythrocytes. However, the molecular basis for the GATA-1 reduction during terminal erythroid maturation is unclear at present. In this regard, it is interesting to note that caspase was reported to cause specific degradation of the GATA-1 protein in erythroblasts.40 Decrease of GATA-1 protein may cause down-regulation of its transcription through inhibiting autoregulation.41
The use of G1-HRD-GFP transgenic mouse lines enables us to efficiently enrich erythroid progenitors from mouse hematopoietic tissues. Whereas Ter119 and glycophorin-A are important surface markers of differentiated erythroblasts and mature erythrocytes, these markers are not present in erythroid progenitors such as BFU-E and CFU-E.42 In fact, there are no suitable surface markers/antibodies for the isolation of erythroid progenitors. This limitation has hampered our attempt to purify and characterize steady-state erythroid progenitors from normal mouse bone marrow, and therefore we usually enrich CFU-E from anemic spleen. This study makes it possible to purify erythroid progenitors from normal mouse hematopoietic tissues, and we are now able to assess the erythropoiesis occurring in various hematopoietic disorders. Furthermore, it should be emphasized that we could obtain 800 CFU-E-derived colonies from 2000 plated cells purified from anemic spleen. To our knowledge, this is the most efficient method to enrich erythroid progenitors.
We found that all CFU-E resides in the GFP+ fraction of bone marrow, whereas more than half of the BFU-E resides in this fraction. This is consistent with the result that approximately half of Lin-/c-Kit+/GFP- cells express GATA-1 protein. The important observation here is that in the fetal liver, BFU-E do not express GFP at all, even though the BFU-E-containing fraction expresses endogenous GATA-1 mRNA. One plausible explanation for this discrepancy is that there may be different regulatory mechanisms for GATA-1 gene transcription in the fetal liver and adult hematopoietic tissues. Additional regulatory elements might be required for GATA-1 gene expression in early erythroid progenitors, as the G1-HRD appeared to be insufficient for recapitulating expression of the endogenous GATA-1 gene in very immature hematopoietic progenitors.
Although the colony-forming assay is widely used to evaluate hematopoietic cell dysfunction, there is an inherent problem with this approach in that we have never assessed the progenitor cells when they lack the abilities to proliferate and differentiate, such as the hematopoietic progenitors in the EpoR, c-Myb, and Runx1 mutant mouse lines.24,43,44 Importantly, we detected GFP+ erythroid progenitors in the EpoR-null embryonic livers. Since the GFP+ fraction contains CFU-E abundantly in the wild-type embryos, this result strongly argues that the EpoR-deficient embryos actually contain CFU-E, but the cells cannot differentiate further due to the lack of the Epo-EpoR signaling pathway. We therefore propose that the G1-HRD-GFP transgene is a useful means for the detection of CFU-E in the mutant animals with defective erythropoiesis.
There has been controversy over the mobility of intracellular free Ca2+ (IFC) in the erythroid progenitors and its relation to Epo.34 One line of evidence indicates that the Ca2+ level is low in the erythroid progenitors, whereas another line of evidence shows that the Ca2+ level is high in the progenitors. To obtain insight into this issue, we measured the Ca2+ concentration in the erythroid progenitors purified by means of GFP expression. We found that while most of the Ter119+ erythroblasts contain a high concentration of Ca2+ in the endoplasmic reticulum (ER), c-Kit+/GFP+ erythroid progenitors contain a low or undetectable level of Ca2+. An Epo stimulus induces Ca2+ efflux from the ER to the cytoplasm only in mature erythroblasts and not in early erythroid progenitors. This result is consistent with our previous analysis27 and clearly demonstrates that changes in the Ca2+ concentration do not affect Epo signaling in the progenitor stage. On the contrary, the biologic significance of Ca2+ modulation on Epo function in erythroblasts remains to be clarified.
Finally, we wish to present the usefulness of the G1-HRD for transgenic expression of various effector genes in erythroid and megakaryocytic cell lineages. We have established transgenic mouse lines expressing small Mafs, EpoR, Stat3, TR2/4, and GATA factors under the control of G1-HRD.21,22,26,45,46 We recently showed that EpoR-null mutant mice can be rescued from dyserythropoiesis and embryonic lethality by introducing the G1-HRD-EpoR transgene,26 as G1-HRD directs the expression of the effector gene in CFU-E, which require the expression of EpoR for survival and differentiation. We envisage that G1-HRD will be useful in therapy for dyserythropoiesis in the future.
Prepublished online as Blood First Edition Paper, July 31, 2003; DOI 10.1182/blood-2003-04-1154.
Supported by grants from the Ministry of Education, Science, Sports and Culture, JST-ERATO, Japan Society for the Promotion of Science-the Research for the Future Program (JSPS-RFTF), Center for Renewable Energy and Sustainable Technology, the Naito Foundation, and Program for Promotion of Basic Research Activities for Innovative Biosciences. N. Suzuki is a Japan Health Science Foundation postdoctoral fellow.
The publication costs of this article were defrayed in part by page charge payment. Therefore, and solely to indicate this fact, this article is hereby marked “advertisement” in accordance with 18 U.S.C. section 1734.
We thank Drs Shigeko Nishimura, Toshiro Nagasawa, Satoru Takahashi, Fumiki Katsuoka, and Tania O'Connor for discussion and advice. We also thank Kirin Brewery for their generous supply of cytokines.

![Figure 2. Colony assay of GFP+ cells in the bone marrow. (A) The Lin-/c-Kit+ fraction is subdivided into 4 fractions with the expression of GFP and CD71. The percentage of cells in each quadrangle is shown. Cells in each fraction were sorted and cultured with only Epo (B), Epo and SCF (C), or Epo, SCF IL-6, and IL-3 (D). Colonies were counted 3 days (B) or 7 days (C, D) after culturing. (E) A colony derived from CFU-E in the CD71+/GFP+ fraction was stained by benzidine (left panel, blue staining), and some of the cells in the colony were detected by GFP expression under the fluorescent microscope (right panel). (F) A mixed colony derived from a CD71-/GFP+ cell was observed by bright (top panel) and fluorescent (middle panel) microscopy. GFP expression was detected in red cells (erythrocytes [E]) and large cells (megakaryocytes [Mk]) but not in small white cells (granulocytes [G]) and large extended cells (macrophages [Mc]). The top and middle panels were merged in the bottom panel (F). Original magnifications, × 200 (E) and × 100 (F).](https://ash.silverchair-cdn.com/ash/content_public/journal/blood/102/10/10.1182_blood-2003-04-1154/6/m_h82235238002.jpeg?Expires=1769126320&Signature=FkSHqIIn6I15i9OPz4Nnyv~Tygkk3FI0WpOLyBhTH9xqH5RqNx1OZDaNdj8a9CHhrDZK--D~CD3zf9N8A--8AMRskE3~9fbHqdWzHWWbo6OtMW1Mm~8KuAOVVprRMr4vnU3hZ7mUjP-IlQtBWRdr5SyRCEZy5LmTmukiO02TR~Wg~0z2Yb8Y5-DMyOr0F8yJ7lZ2XSC-JhKO0BSjnQGn7H1B4hTuj7zrH7TNvBACtMvmL-2LG8QJeB29F-2f15psyXePcC3WnpA2qX0HRIYRS9BmFz0DWHRn97LnMK1rKqYjwCZ7eSigmNUzGSnnUYdilF9mY9p50oxq9VRAnSvpcQ__&Key-Pair-Id=APKAIE5G5CRDK6RD3PGA)



![Figure 2. Colony assay of GFP+ cells in the bone marrow. (A) The Lin-/c-Kit+ fraction is subdivided into 4 fractions with the expression of GFP and CD71. The percentage of cells in each quadrangle is shown. Cells in each fraction were sorted and cultured with only Epo (B), Epo and SCF (C), or Epo, SCF IL-6, and IL-3 (D). Colonies were counted 3 days (B) or 7 days (C, D) after culturing. (E) A colony derived from CFU-E in the CD71+/GFP+ fraction was stained by benzidine (left panel, blue staining), and some of the cells in the colony were detected by GFP expression under the fluorescent microscope (right panel). (F) A mixed colony derived from a CD71-/GFP+ cell was observed by bright (top panel) and fluorescent (middle panel) microscopy. GFP expression was detected in red cells (erythrocytes [E]) and large cells (megakaryocytes [Mk]) but not in small white cells (granulocytes [G]) and large extended cells (macrophages [Mc]). The top and middle panels were merged in the bottom panel (F). Original magnifications, × 200 (E) and × 100 (F).](https://ash.silverchair-cdn.com/ash/content_public/journal/blood/102/10/10.1182_blood-2003-04-1154/6/m_h82235238002.jpeg?Expires=1769226178&Signature=Z5Lt~PvxW9S8C9gZrk7pUPEnZKQcWysOuewzdHTrsl1YT4nMEmqRKfmFm2bfE7X9Xe6TMhLy6mUSmyTJKVHrXXdhyz7KHs0IvSbAE6OF9Cm3kOAbsa28p25sNCLds~4DlBFDPl96xJA~DzsaLAby7kqqfCRHfFry8yZm3MnutnoHFQVfMpk8XNiO09V55~16JNDUuIyb~H~BkLMMetQNXkH-M20UU5iIVPkmDVLFb8dJibhabM0~AICDaWOOI0bFnDLwxrRhmIO0Cjk111umJEhtrLkIDmD1o8qOz0EKKje6EI0m2B38IGXYUMCZCoM4ezBrwAZIvCTx6SZxtvyALA__&Key-Pair-Id=APKAIE5G5CRDK6RD3PGA)
