Abstract
Plasma cells (PCs), the end point of B-cell differentiation, are a heterogeneous cell compartment comprising several cell subsets from short-lived highly proliferative plasmablasts to long-lived nondividing fully mature PCs. Whereas the major transcription factors driving the differentiation of B cells to PCs were recently identified, the subtle genetic changes that underlie the transition from plasmablasts to mature PCs are poorly understood. We recently described an in vitro model making it possible to obtain a large number of cells with the morphologic, phenotypic, and functional characteristics of normal polyclonal plasmablastic cells (PPCs). Using Affymetrix microarrays we compared the gene expression profiles of these PPCs with those of mature PCs isolated from tonsils (TPCs) and bone marrow (BMPCs), and with those of B cells purified from peripheral blood (PBB cells) and tonsils (TBCs). Unsupervised principal component analysis clearly distinguished the 5 cell populations on the basis of their differentiation and proliferation status. Detailed statistical analysis allowed the identification of 85 PC genes and 40 B-cell genes, overexpressed, respectively, in the 3 PC subsets or in the 2 B-cell subsets. In addition, several signaling molecules and antiapoptotic proteins were found to be induced in BMPCs compared with PPCs and could be involved in the accumulation and prolonged survival of BMPCs in close contact with specialized stromal microenvironment. These data should help to better understand the molecular events that regulate commitment to a PC fate, mediate PC maintenance in survival niches, and could facilitate PC immortalization in plasma cell dyscrasias.
Introduction
Plasma cells (PCs) represent the end point of B-cell differentiation and are the final effectors of humoral immunity. After antigen exposure, naive B cells can differentiate rapidly into short-lived PCs secreting unmutated immunoglobulin (Ig) within the medullary cord of lymph nodes and the red pulp of the spleen. On antigen persistence, B cells expressing Ig with a high affinity with antigen are selected within germinal centers and give rise to early PCs displaying highly mutated Ig variable regions. Some of these PC precursors are then able to migrate to the bone marrow or to the lamina propria of mucosa where they differentiate into long-lived PCs.1,2 These PCs are trapped within microenvironment niches that allow their long-term survival through antigen-independent pathways.3 Whereas terminally differentiated PCs do not divide, less mature PC precursors, called plasmablasts, do undergo cell division.4
Terminal differentiation of B cells is under the control of several transcription factors.5 As demonstrated in X box-binding protein 1 (XBP-1)-/- lymphoid chimeric mice, XBP-1 is mandatory for PC differentiation even if no target gene explaining this critical role has been identified to date.6 Positive regulatory domain I-binding factor 1 (PRDI-BF1) is a transcriptional repressor present in all PC subsets.7 Ectopic expression of Blimp-1, the murine homologue of PRDI-BF1, is sufficient to drive the differentiation of a murine lymphoma cell line into PCs.8 Although the expression of more than 250 genes is affected by Blimp-1 overexpression,9 only 5 direct targets of PRDI-BF1/Blimp-1 have been characterized to date10-12 : MYC, involved in cell cycle progression; SPI-B, which regulates signaling through the B-cell receptor (BCR); ID3, a repressor of isotype switching that favors B-cell proliferation in response to BCR ligation; the major histocompatibility complex (MHC) class II transactivator (CIITA), which controls MHC class II expression; and the B-cell lineage–specific activator protein (BSAP). BSAP/Pax-5 is critical for B-lymphoid lineage commitment and also for maintaining the function and survival of mature B cells and is lost only at the PC stage.13 BSAP overexpression suppresses differentiation of late B-cell lines and murine splenic B cells into PCs, probably through repression of XBP-1 and J chain and Ig heavy chain transcription. Finally, the expression of interferon regulatory factor 4 (IRF-4) among the B-cell lineage is restricted to plasmablast-like germinal center B cells and PCs. IRF-4 regulates gene expression through interaction with ets family members, such as PU.1 or SPI-B, and favors PC differentiation.14
Whereas several studies have detailed phenotypes and gene expression profiles of normal naive, activated, and memory peripheral blood B cells, centroblasts, and centrocytes, and compared them to various B-cell neoplasias,15-18 such an exhaustive analysis is missing for the late stages of B-cell differentiation. In humans, 3 subsets of normal PCs have been isolated. Based on their phenotypic characterization, they are supposed to represent a gradual increase in PC maturation: early PCs in tonsils, transitional PCs in peripheral blood, and mature PCs in bone marrow.19 In addition, few studies focused on the gene expression profile of the malignant counterpart of normal PCs: myeloma cells.20-22 Using Affymetrix microarrays, we recently compared the gene expression profiles of purified tonsil B cells (TBCs), tonsil PCs (TPCs), and bone marrow PCs (BMPCs).23 This study provided new insights into the knowledge of the molecular mechanisms involved in early and late stages of PC differentiation. We have also developed an in vitro reproducible model of peripheral blood B (PBB) cell differentiation into polyclonal plasmablastic cells (PPCs).24 PPCs are highly proliferative, produce large amounts of Ig, have the morphologic and phenotypic features of PCs, and express high levels of the PC-specific transcription factors XBP-1, PRDI-BF1, and IRF-4. These cells are closely related to the proliferative plasmablastic compartment found in patients with reactive plasmacytoses.
In the current study, we extend these previous works by comparing gene expression patterns of 5 cell populations representing all stages of differentiation from resting B cells to fully mature PCs, including activated germinal center B cells, plasmablasts, and early PCs.
Materials and methods
Cell isolation
All samples were obtained from healthy volunteers after informed consent was given according to the University of Arkansas for Medical Sciences and the Etablissement Français du Sang guidelines. Cell populations were isolated as previously described.23,24 PBB cells and TBCs were purified using anti-CD19, and TPCs and BMPCs using anti-CD138 MACS microbeads (Miltenyi-Biotec, Paris, France). PPCs were generated in vitro from purified CD19+ PBB cells. Briefly, PBB cells were cultured in RPMI 1640/10% fetal calf serum (FCS) in the presence of mitomycin-treated CD40L transfectant, interleukin 2 (IL-2; 20 U/mL), IL-4 (50 ng/mL), IL-10 (50 ng/mL), and IL-12 (2 ng/mL; R&D Systems, Abington, United Kingdom). After 4 days of culture, B cells were harvested and seeded without CD40 signal but with IL-2, IL-10, IL-12, and IL-6 (5 ng/mL). On day 6 of culture, cells were stained with fluorescein isothiocyanate (FITC)–conjugated anti-CD20 (Beckman-Coulter, Marseilles, France) and phycoerythrin (PE)–conjugated anti-CD38 (Becton Dickinson, San Jose, CA) and CD20-CD38++ PPCs were sorted with a FACSvantage (Becton Dickinson).
Preparation of cRNA and microarray hybridization
RNA was extracted using the RNeasy Kit (Qiagen, Valencia, CA). cRNA preparation and hybridization to the HuGeneFL GeneChip microarray (Affymetrix, Santa Clara, CA) were done as described.21
Statistical analysis
A threshold of 200 was assigned to small values and we retained the 3789 genes with at least 3 absolute calls defined as present by the GeneChip software.
To cluster the samples according to the similarity of their gene expression patterns, we performed unsupervised principal component analysis (PCA) using SPSS software (SPSS, Chicago, IL). Data were first log transformed and median centered. To select genes that are most informative, the analysis was limited to a subset of 1174 genes with the highest standard deviation across the 49 samples (SD > 1200). The goal of PCA is to transform the original variables into new independent and uncorrelated variables called principal components that explain the variability.25 The first components concentrate the majority of the variability and thus retain the maximum amount of information. In our analysis, the first 2 principal components (PCA1 and PCA2) accounted for 55.7% of the sample variance and are thus sufficient to model the gene expression difference among B-cell and PC samples. As previously reported,26 because each component is a linear combination of the original variables (gene expression in this case), it is possible to ascribe a biologic meaning to what the component represents. Each gene variably contributes to the definition of the principal component according to coefficients computed by PCA. The genes most contributive to the component, that is, with the highest absolute value of coefficients, are the ones most important to assign biologic meanings.
We then used a nonparametric Mann-Whitney test (SPSS software) to identify, among the 3789 genes, those that were statistically (P < .01) differentially expressed between B-cell and PC populations when these populations were compared with each other. For each gene, we defined 6 ratios: mean in BMPCs to mean in PBB cells (BMPC/PBB ratio), mean in BMPCs to mean in TBCs (BMPC/TBC ratio), mean in TPCs to mean in PBB cells (TPC/PBB ratio), mean in TPCs to mean in TBCs (TPC/TBC ratio), mean in PPCs to mean in PBB cells (PPC/PBB ratio), and mean to PPCs to mean in TBCs (PPC/TBC ratio). Only genes with ratios equal to or greater than 2 between the cell populations studied were retained.
RT-PCR and quantitative RT-PCR
Total RNA was converted to cDNA using the Superscript II reverse transcriptase (RT; Invitrogen, Cergy Pontoise, France). For nonquantitative validation of microarray data, polymerase chain reactions (PCRs) were performed with AmpliTaq DNA polymerase (Applied Biosystems, Courtaboeuf, France) and analyzed on a 1.5% agarose gel containing ethidium bromide. The following primers were used: β2-microglobulin: 5′-CTCGCGCTACTCTCTCTTTCTGG-3′ and 5′-GCTTACATGTCTCGATCCCACTTAA-3′; ILT3: 5′-CAGACAGATGGACACTGAGG-3′ and 5′-AGAATCAGGTGACTCCCAAC-3′; granzyme B: 5′-ACCTCTCCCAGTGTAAATCT-3′ and 5′-GCGGTGGCTTCCTGATACAA-3′. For quantitative RT-PCR, we used the assays-on-demand primers and probes and the TaqMan Universal Master Mix from Applied Biosystems according to the manufacturer's instructions. Measurement of gene expression was performed using the ABI Prism 7000 Sequence Detection System. In each TaqMan run, serial dilutions of a single standard cDNA were amplified to create a standard curve, and values of unknown samples were estimated relative to this standard curve. For transcription factors, an Epstein-Barr virus (EBV) cell line was used as a standard. For MER quantification, adherent peripheral blood monocytes were used as a standard. For SDF1 quantification, bone marrow stromal cells were used as a standard. They were obtained by culturing adherent bone marrow mononuclear cells during 3 weeks in Dulbecco modified Eagle medium (DMEM)/20% FCS. Normalization of samples was performed by dividing the value of the gene of interest by the value of the endogenous reference gene β2-microglobulin.
Results and discussion
Five purified cell populations were used for this study. Their surface phenotype and gene expression profile were recently characterized in detail.23,24 Briefly, PBB cells contained more than 98% CD19+ resting B cells that expressed high levels of CD20, CD21, and CD22, intermediate levels of CD38 and CD27, and lacked CD138 and cytoplasmic Ig. TBCs consisted of more than 98% CD19+CD20+ cells expressing no CD138. CD20-/CD38hi PPCs generated in vitro were cell sorted with a purity of 99%. These cells were highly proliferative, produced large amounts of polyclonal Ig, and expressed high levels of CD27 and low levels of CD21, CD22, and CD138. Finally, TPCs and BMPCs were enriched to, respectively, 89% and 95% of CD38hi/CD45lo/- cells. These cells expressed low levels of CD20 and stained positive for cytoplasmic Ig. We compared gene expression profiles of a panel of 7 PBB cells, 8 TBCs, 10 TPCs, 14 BMPCs, and 10 PPCs using Affymetrix HuGeneFL microarrays.
Relationships between the late stages of the B-cell differentiation process
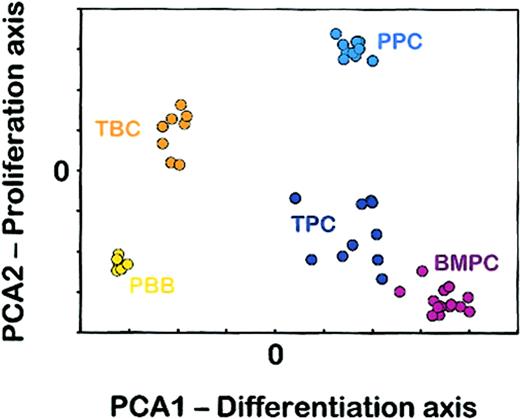
To get an overview of the relationships between B-cell and PC populations, an unsupervised principal component analysis (PCA) was performed using 1174 genes selected to have the highest SD between the 49 samples (Figure 1). The PCA method defined theoretical x- and y-axes (respectively, PCA1 and PCA2) that make it possible to visualize a maximum of the variability in the gene expression profile among the 49 samples. The information retained in PCA1 x-axis is independent of that retained in PCA2 y-axis and these 2 first principal components accounted for 55.7% of the total variability (33% for PCA1 and 22.7% for PCA2). Five cell populations can be clearly distinguished one from the other with this 2-dimensional representation. The intragroup variability differed between the cell populations. Whereas PBB cell and PPC samples appeared as very homogeneous clusters, in agreement with the high purity of these 2 cell populations, TBC, BMPC, and above all TPC samples were less tightly clustered. This could be explained by the very low percentage of PCs in vivo leading to time-consuming cell purification procedures and by the inflammatory status of tonsil samples.
Unsupervised principal component analysis. PCA of the 1174 genes with the highest SD among the 49 samples. The separation of the 5 groups of samples was visualized on a 2-dimensional plot. The coordinates of each sample correspond to its principal component scores. PBB indicates peripheral blood B cells; TBC, tonsil B cells; TPC, tonsil plasma cells; BMPC, bone marrow plasma cells; PPC, polyclonal plasmablastic cells.
Unsupervised principal component analysis. PCA of the 1174 genes with the highest SD among the 49 samples. The separation of the 5 groups of samples was visualized on a 2-dimensional plot. The coordinates of each sample correspond to its principal component scores. PBB indicates peripheral blood B cells; TBC, tonsil B cells; TPC, tonsil plasma cells; BMPC, bone marrow plasma cells; PPC, polyclonal plasmablastic cells.
As detailed in “Materials and methods,” each of the 1174 genes variably contributed to the definition of the 2 first principal components, according to coefficients computed by PCA analysis and available on the Blood website as supplementary data in Table S1 (see the Supplemental Tables link at the top of the online article). To assign a meaning to PCA1 component, we considered the first 100 genes showing the highest absolute PCA1 coefficients (44 with positive and 56 with negative coefficients; Table 1). Among them, 40 genes have been previously described as down-regulated (B-cell genes, in particular LTB, CD20, REL, CXCR5, BLK, IL4R, or BCL6) or up-regulated (PC genes, especially CCR2, BCMA, CD38, SDC1 [CD138], IRF4, CD27, or XBP1) during B-cell maturation.19,23,24 In addition, 13 of the 100 with the highest PCA1 coefficient were recently described as extinguished or induced by ectopic Blimp-1 expression.9 Thus, PCA1 is mostly related to B-cell differentiation. Interestingly, according to this first differentiation component, PPCs were very close to TPCs, in agreement with their previously reported phenotypic characteristics.24 We then determined the 100 genes that contributed mostly to definition of the second principal component PCA2. PCA2 y-axis mainly segregated the cell populations on the basis of their activation/proliferation status, from BMPCs and PBBs, to TPCs, TBCs, and finally PPCs. Consistent with this, 24 genes coding for proliferation-related proteins were found among the 50 genes with the highest PCA2 negative coefficients (available as supplementary data in Table S2). Thus, the unsupervised PCA analysis gave a biologically pertinent overview of the terminal B-cell differentiation process.
To go further into the molecular events involved in each step of maturation from resting B cells to fully differentiated BMPCs, we then looked for genes that (1) were differentially expressed in PC subsets compared to B-cell subsets, and (2) distinguished plasmablasts from mature PCs.
Key genes differentiating PCs and B cells
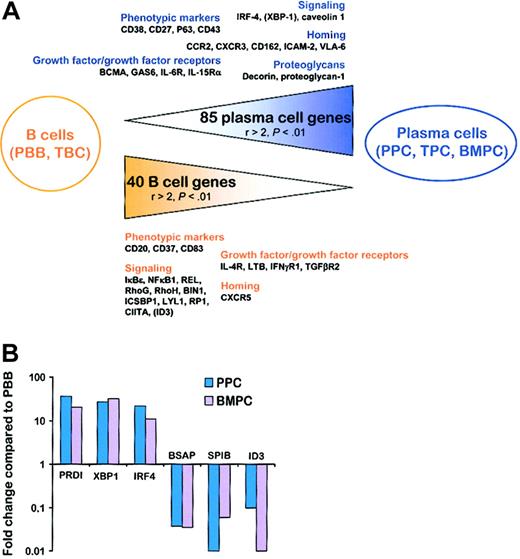
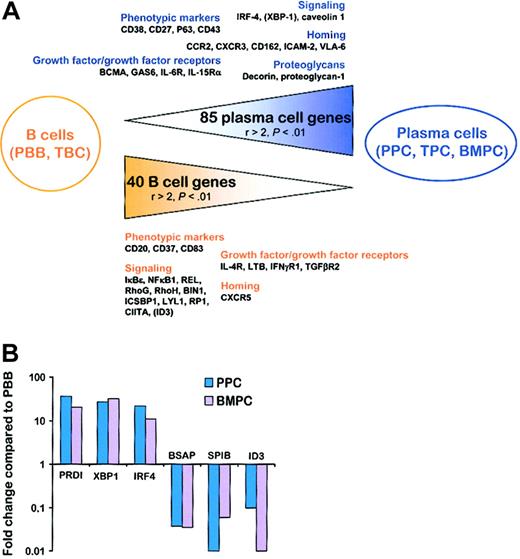
We first established a list of the genes that were significantly (P < .01) differentially expressed between the 3 PC subsets and the 2 B-cell subsets. Among the 3789 genes retained for the analysis, 85 genes were statistically overexpressed in TPCs, PPCs, and BMPCs compared with PBB cells and TBCs with a ratio of mean expression values greater than 2 (ie, BMPC/PBB > 2, BMPC/TBC > 2, TPC/PBB > 2, TPC/TBC > 2, PPC/PBB > 2, and PPC/TBC > 2). Only 24 of these 85 genes were already described as up-regulated either in the PPC plasmablastic compartment or in the TPC/BMPC mature PC compartment.23,24 Conversely, 40 genes were underexpressed in the 3 PC subsets using the same criteria. Among them, 19 were reported to be repressed following PRDI-BF1 ectopic expression and/or to be statistically down-regulated in one of the PC subsets compared with PBB cells or TBCs.9,23,24 The complete list of these 125 genes is available as supplementary data (Tables S3-S4). Interestingly, 38 of the 56 genes representing PC markers using PCA analysis, that is, with the highest negative PCA1 coefficients (Table 1), and 17 of the 44 genes representing B-cell genes using PCA analysis, that is, with the highest positive PCA1 coefficients (Table 1), belonged to this restricted list of 125 genes. This further confirmed that PCA1 truly corresponded to a differentiation axis. Six Ig sequences and a group of 24 genes coding for proteins involved in protein synthesis, folding, or transport belong to the 85 PC genes, in agreement with the high rate of Ig secretion found in PCs. We selected 35 genes (17 PC genes and 18 B-cell genes) that seemed the most interesting with respect to understanding PC biology (Tables 2 and 3; Figure 2A), that is, genes coding for membrane markers, signaling molecules, growth factors/growth factor receptors, and homing molecules.
From B cells to PCs. (A) Schematic representation of the 125 genes that were statistically differentially expressed between the 2 B-cell populations and the 3 PC populations with a ratio of mean expression greater than 2. Relevant genes that were statistically differentially expressed between B cells and PCs but with at least one ratio of mean expression less than or equal to 2 are indicated in parentheses. PBB indicates peripheral blood B cells; TBC, tonsil B cells; TPC, tonsil plasma cells; BMPC, bone marrow plasma cells; PPC, polyclonal plasmablastic cells. (B) Real-time PCR quantification of B-cell and PC transcription factors. cDNA obtained from 3 PBB cells, 3 PPCs, and 3 BMPCs were analyzed for PRDI-BF1, XBP-1, IRF-4, BSAP, SPIB, and ID3 expression using β2-microglobulin as the normalization control. The data are expressed as the mean of the 3 samples tested and represent the ratio of value in PC–value in PBB cells.
From B cells to PCs. (A) Schematic representation of the 125 genes that were statistically differentially expressed between the 2 B-cell populations and the 3 PC populations with a ratio of mean expression greater than 2. Relevant genes that were statistically differentially expressed between B cells and PCs but with at least one ratio of mean expression less than or equal to 2 are indicated in parentheses. PBB indicates peripheral blood B cells; TBC, tonsil B cells; TPC, tonsil plasma cells; BMPC, bone marrow plasma cells; PPC, polyclonal plasmablastic cells. (B) Real-time PCR quantification of B-cell and PC transcription factors. cDNA obtained from 3 PBB cells, 3 PPCs, and 3 BMPCs were analyzed for PRDI-BF1, XBP-1, IRF-4, BSAP, SPIB, and ID3 expression using β2-microglobulin as the normalization control. The data are expressed as the mean of the 3 samples tested and represent the ratio of value in PC–value in PBB cells.
The up-regulation of CD38, CD27, P63 (Vs38c), and CD43 during B-cell maturation is in good agreement with previously reported phenotype analysis of PCs and B cells.19,24,27 Of the 3 main PC transcription factors already identified, only IRF4, which is known to be up-regulated early in commitment to the PC lineage in germinal center,14 was found among the 85 PC genes. Noteworthy, no probe for PRDI-BF1 was included in the HuGeneFL microarrays. In addition, the lack of the other PC transcription factor XBP1 among the PC genes was due to its already 2-fold increase in TBCs compared with PBB cells (P = .0003), which leads to a PPC/TBC ratio of only 1.99 (P = .00005), whereas the cutoff in our study was a ratio of 2. The induction of XBP1 in TPCs is in agreement with the presence of PRDI-BF1/Blimp-1+ B cells within germinal centers, which have been suggested to be already committed to a PC fate.7 To further analyze the regulation of these 3 transcription factors during late B-cell differentiation, we performed quantitative RT-PCR experiments. As shown in Figure 2B, PRDI-BF1, XBP1, and IRF4 were all found to be highly (11- to 36-fold) up-regulated in plasmablasts (PPCs) and fully mature PCs (BMPCs). According to our recent study,23 plasmablasts and PCs overexpressed the gene coding for caveolin 1, a scaffolding protein that is a major structural component of caveolae and that regulates other signaling molecules such as Src-kinases through the formation of ternary temporary complexes.21 Four growth factors/growth factor receptors were identified as overexpressed in normal PCs. Three of them have been recently described by us as increased in PPCs compared with B cells: BCMA, GAS6, and IL6R/CD126.24 We report here for the first time the up-regulation of IL15RA gene during B-cell differentiation. IL-6 is a well-known survival factor for both malignant and normal PCs but the role of IL-15 in plasma cell growth was restricted to date to multiple myeloma cells.28 Malignant PCs express the high-affinity receptor for IL-15 (IL-15Rα), and produce IL-15, thus suggesting the existence of a potential autocrine antiapoptotic loop in this pathology. IL-15 is also produced by bone marrow stromal cells.29 Because the expression of IL-2Rα (CD25) is abrogated during differentiation of activated B cells into plasmablasts,30 it is tempting to speculate that IL-15, which shares 2 receptor chains with IL-2 (IL-2Rβ and IL-2Rγ), can replace it as a survival or growth factor (or both) for plasmablasts and PCs. At least 2 proteoglycan genes were uniformly upr-egulated in all PC subsets compared with B cells: decorin (DCN) and proteoglycan 1 (PRG1). Importantly, the syndecan-1 gene SDC1 (CD138) was not present among this list of genes, in agreement with its lack of expression on plasmablasts.31 Proteoglycans are able to bind numerous proteins, in particular, growth factors and extracellular matrix proteins. The up-regulation of these proteoglycan genes in PCs might be important for homing and survival of these cells. Concerning homing and adhesion molecules, we showed that in addition to their previously reported up-regulation in PPCs, CCR2, CXCR3, and CD162 were elevated in all PC subsets and may thus contribute not only to migration but also to accumulation of PCs into bone marrow. IP-10 (CXCL10), Mig (CXCL9), and I-TAC (CXCL11), the 3 CXCR3 ligands, were recently shown to be chemoattractants for splenic and recently emigrating bone marrow PCs in mice.32 Thus, CXCR3 seems to be the second major chemokine receptor, besides CXCR4, involved in PC homing. Genes coding for integrin-binding adhesion molecule ICAM-2 (CD102) and the integrin ITGA6 (VLA-6), involved in cell-cell and cell-matrix interactions, were identified as up-regulated in PCs compared to B cells.
Several cell surface markers were found among the genes overexpressed in B cells compared with PCs and validated the Affymetrix analysis, especially CD20, CD37, and CD83 that are known to be repressed during B-cell differentiation. Ten genes coding for signaling molecules were found to be down-regulated in PCs: (1) 3 members of the nuclear factor-κB (NF-κB)/Rel family (IKBE, NFKB1, and REL); (2) 2 Rho family members, RhoG (ARHG) and RhoH (ARHH), previously characterized as repressed during the transition from TBC to TPC23 ; (3) BIN1, a tumor suppressor involved in apoptosis induced by c-myc; (4) ICSBP1, a lymphoid-specific interferon regulatory factor (IRF) that interacts either with other IRF members such as IRF-1, leading to transcriptional repression, or with Ets family members, in particular PU.1, resulting in transcriptional synergy33 ; (5) LYL1, a basic helix-loop-helix (bHLH) transcription factor previously reported to be restricted mainly to B cells and down-regulated at the plasma cell stage in mice34 ; (6) RP1, which is characterized by its ability to bind to the adenomatous polyposis coli (APC) protein and to tubulin35 ; and (7) CIITA, a direct target of PRDI-BF1/Blimp-1 repression. Because PRDI-BF1/Blimp-1 is a critical transcription factor involved in PC differentiation, we investigated whether other genes known to be repressed by PRDI-BF1/Blimp-1 were downregulated in PCs.9 The probe set for BSAP is likely to be ineffective in HuGeneFL microarrays23 and, because expression of SPIB was very heterogeneous between B-cell and PC populations, this transcription factor cannot be classified as B-cell or PC genes. In addition, even if ID3 expression was statistically decreased in all PC subsets compared with all B-cell subsets (P < .001), it is not included in the PC genes because the ratio TBC/PPC reached only 1.92. With quantitative RT-PCR, BSAP was found uniformly down-regulated in PPCs and BMPCs compared with PBB cells (respectively, 27- and 29-fold). SPIB and ID3 were also down-regulated in PPCs and BMPCs but SPIB was higher in BMPCs compared with PPCs and ID3 higher in PPCs versus BMPCs (Figure 2B). These results suggest that, even if PRDI-BF1/Blimp-1 directly represses several genes during B-cell maturation,9 their level of expression results from a more complex regulation. It is also intriguing that CD27 was also described as down-regulated by PRDI-BF1,9 whereas we and others have shown that it is an important PC marker.24,36 Four growth factors/growth factor receptor genes were found to be down-regulated in PCs compared with B cells. Among them IL4R and lymphotoxin β (LTB) were recently described as repressed in TPCs compared with TBCs,23 and interferon γ receptor α (IFNGR1) was shown by others to be repressed following ectopic expression of PRDI-BF1.9 Our Affymetrix data revealed a decreased expression of transforming growth factor β receptor type II (TGFBR2) in PCs compared with B cells. In several models, in particular in murine plasmacytomas, a strong correlation exists between the level of expression of TGF-β receptors and the responsiveness to TGF-β.37 In addition, a recent study demonstrated that the inhibitory effect of TGF-β is at least in part mediated through the induction of the bHLH transcription factor ID3.38 The combined down-regulation of TGF-β receptor type II and ID3 during terminal B-cell differentiation suggests that PCs could be less sensitive than B cells to cell growth inhibition and proapoptotic effects of TGF-β. The only homing molecule gene found to be uniformly down-regulated in PCs compared to B cells was CXCR5, the receptor for BCA-1 involved in B-cell homing into lymph nodes. In conclusion, this multiparameter analysis comprising 5 homogeneous cell populations provides a fully informative panel of genes that distinguish PCs and B cells.
Identification of plasmablastic and mature PC-specific genes
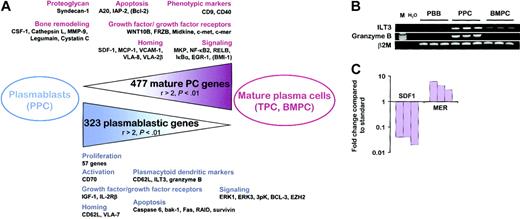
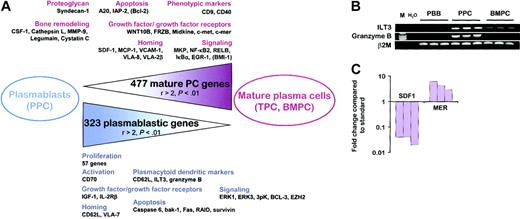
To date, the only reproducible criteria that distinguish plasmablasts from fully mature PCs are their high proliferation, their short survival, and their lack of CD138, which is up-regulated only during PC maturation. To characterize more accurately the plasmablastic population, we thus established a list of the genes that were significantly (P < .01) differentially expressed between PPCs and the 2 mature PC subsets. First, 323 genes were found to be statistically overexpressed in PPCs compared with BMPCs and TPCs with a ratio of mean expression values greater than 2. Among them, 68 genes were also significantly up-regulated in PPCs compared with TBCs and PBB cells, indicating that their overexpression in plasmablasts versus mature PCs was not due only to the less differentiated status of PPCs. Conversely, using the same criteria, 477 genes were down-regulated in PPCs compared with BMPCs and TPCs, of which 63 were also expressed at a lower level in PPCs than in B cells. The complete list of these 800 genes is available as supplementary data (Tables S5-S6) and a selection of the most relevant genes is provided in Tables 4 and 5 and Figure 3A.
From plasmablasts to mature PCs. (A) Schematic representation of the 800 genes that were statistically differentially expressed between plasmablasts and the 2 mature PC populations with a ratio of mean expression greater than 2. Relevant genes that were statistically differentially expressed between PPCs and mature PCs but with at least one ratio of mean expression less than or equal to 2 are indicated in parentheses. PBB indicates peripheral blood B cells; TBC, tonsil B cells; TPC, tonsil plasma cells; BMPC, bone marrow plasma cells; and PPC, polyclonal plasmablastic cells. (B) Expression of ILT3 and granzyme B mRNA was studied by RT-PCR on purified CD19+ PBB cells, on CD20-/CD38++ sorted PPCs, and on purified CD138+ BMPCs. (C) Quantitative RT-PCR confirms SDF1 and MER expression in BMPCs. SDF1 expression in stromal cells and MER expression in monocytes are used as standards. SDF1 and MER transcripts are undetectable in PPCs.
From plasmablasts to mature PCs. (A) Schematic representation of the 800 genes that were statistically differentially expressed between plasmablasts and the 2 mature PC populations with a ratio of mean expression greater than 2. Relevant genes that were statistically differentially expressed between PPCs and mature PCs but with at least one ratio of mean expression less than or equal to 2 are indicated in parentheses. PBB indicates peripheral blood B cells; TBC, tonsil B cells; TPC, tonsil plasma cells; BMPC, bone marrow plasma cells; and PPC, polyclonal plasmablastic cells. (B) Expression of ILT3 and granzyme B mRNA was studied by RT-PCR on purified CD19+ PBB cells, on CD20-/CD38++ sorted PPCs, and on purified CD138+ BMPCs. (C) Quantitative RT-PCR confirms SDF1 and MER expression in BMPCs. SDF1 expression in stromal cells and MER expression in monocytes are used as standards. SDF1 and MER transcripts are undetectable in PPCs.
In agreement with the high proliferation rate of plasmablasts, at least 57 genes, such as thymidylate synthetase (TYMS), several cyclins and cyclin-dependent kinases, the Ki67 antigen (KI67), and the proliferating cell nuclear antigen (PCNA), were found to be up-regulated in PPCs compared with BMPCs and TPCs. The low level of CD138 mRNA in PPCs, unlike in BMPCs and TPCs, is in agreement with the known membrane expression of this proteoglycan.23,24,31 In addition, one of the most highly overexpressed PPC genes is the L-selectin CD62L, whereas PPCs expressed significantly lower levels of CD9 and CD40 than mature PCs. This unique gene expression pattern is close to the phenotype of circulating PCs recently described by Medina et al.19 Moreover, PPCs overexpressed ILT3 and GRZB compared with BMPCs, TPCs, PBB cells, and TBCs. ILT3, which was described as selectively present on monocytes and dendritic cells unlike B cells, T cells, natural killer (NK) cells, and neutrophils, is an inhibitory receptor involved in dendritic cell tolerization.39,40 GRZB is a serine protease involved in cell cytotoxicity mediated by NK and T cells.41 Interestingly, the ILT3++CXCR3++CD62L++GRZB++ PPC phenotype is shared by another restricted lymphoid subset, the plasmacytoid dendritic cells, which expressed strong levels of Ig transcripts.42 We further confirmed that ILT3 and GRZB could be classified as plasmablastic genes using RT-PCR (Figure 3B). PPCs overexpressed CD70, the ligand of CD27. The CD70/CD27 interaction is mandatory for the induction of PC differentiation after B-cell expansion induced by the CD40 signal.43 Thus, CD27 and CD70 coexist at the plasmablastic stage and could be involved in an autocrine differentiation loop that is not further necessary at the more mature PC stage. One of the main differences in the biology of plasmablasts and mature PCs is their homing characteristics. As detailed, CCR2, CXCR3, and CXCR4 genes were expressed by all PC subsets. However, BMPCs and TPCs overexpressed the CXCR4 ligand SDF1/CXCL12, and the CCR2 ligand MCP1/CCL2 compared with PPCs. Stromal derived factor 1 (SDF-1) and monocyte chemotactic protein 1 (MCP-1) are produced by stromal cells,44,45 but their synthesis by mature PCs could further contribute to the local accumulation of long-lived PCs in a limited number of specific bone marrow niches. Using quantitative RT-PCR, we found no SDF-1 transcript in PPCs, whereas this chemokine was expressed in BMPCs, although at a level 30-fold lower than in bone marrow stromal cells (Figure 3C). Besides chemokines, adhesion molecules also play a major role in cellular localization. Mature PCs overexpressed VCAM1 (CD106), ITGA8, and ITGA2B, whereas plasmablasts were characterized by a high level of ITGB7. BMPCs are known to express the vascular cell adhesion molecule 1 (VCAM-1) ligand VLA-4 (integrin α4)19 and it is thus conceivable that the coexpression of this integrin and its receptor can favor mature PC gathering. Within these niches, PCs interact with their microenvironment, in particular by promoting bone remodeling. Whereas GAS6, which directly activates mature osteoclasts through interaction with its receptor Tyro3,46 is uniformly overexpressed in plasmablasts and PCs (Table 2), mature PCs overexpressed CSF1/MCSF, which is an essential factor for osteoclastogenesis.47 In addition, at least 4 genes coding for proteins involved in bone remodeling were found to be specifically up-regulated in BMPCs and TPCs compared with PPCs: the collagenolytic cysteine protease cathepsin L (CSTL), the gelatinase matrix metalloproteinase 9 (MMP9), the asparaginyl endopeptidase legumain (PRSC1), and the cysteine proteinase inhibitor cystatin c (CST3). Among them, cathepsin L and MMP-9 are directly involved in bone resorption.48,49 Interestingly, myeloma cells were previously reported to express MMP-9 and it was suggested that myeloma MMP-9 contributes to the lytic bone lesions found in this disease.50 On the contrary, legumain negatively regulates osteoclast formation and activity51 and cystatin c antagonizes the degradation of bone matrix by cathepsins.52
We identified several growth factor/growth factor receptor genes as differentially expressed between plasmablasts and mature PCs. First, IGF1 was found to be overexpressed by PPCs, whereas BMPCs overexpressed IGF2, suggesting that insulin-like growth factors (IGFs) could play an antiapoptotic or proliferative role on normal PCs. IGF1 is a myeloma growth factor produced by bone marrow stromal cells but also, in an autocrine manner, by some myeloma cell lines.53,54 PPCs also overexpressed IL2RB. Recently, a high expression of IL2RB was reported in malignant B cells from primary effusion lymphoma (PEL), in association with a plasmablastic derivation.55 In conjunction with IL-15Rα, up-regulated in all PC subsets compared to B cells, and IL-2Rγ, found in all our B cells and PC samples, IL-2Rβ would participate to the expression of the high-affinity receptor for IL-15 on normal and perhaps malignant plasmablasts. On the contrary, terminal maturation of PCs was associated with an increase in the expression of 2 members of the Wnt/frizzled family: WNT10B and FRZB. WNTs are secreted glycoproteins, which bind to frizzled receptors and are involved in embryo development and cancer.56 In addition, several WNT members, including WNT10B, function as hematopoietic growth factors.57 FRZB is a decoy receptor playing an antagonist role in the Wnt/Frz pathway.58 We have previously demonstrated that WNT10B is down-regulated and FRZB up-regulated in tumor myeloma cells compared with normal BMPCs.21 In addition, we have recently discovered that the frizzled-2 receptor (FZD2) is significantly down-regulated in PCs from patients with monoclonal gammopathy of undetermined significance (MGUS) and multiple myeloma (MM) compared with normal BMPCs, suggesting that disruption of Wnt signaling may occur early in disease development (Hardin et al, submitted 2002). Furthermore, like FRZB, the Wnt decoy receptor DKK1 is significantly up-regulated in MM PCs compared with PCs of MGUS and BMPCs (J.S. et al, unpublished data, December 2002). Taken together these data suggest that the Wnt signaling axis is tightly controlled during normal PC differentiation and that a progressive deregulation of this pathway may be involved in the development and progression of PC dyscrasias. Mature PCs overexpressed MET, the receptor for hepatocyte growth factor (HGF), which is involved in the survival of activated B cells59 and tumor PCs.60 In MM cells, it was recently demonstrated that CD138 can bind HGF and strongly promotes HGF-mediated signaling, resulting in enhanced activation of c-met.60 Because HGF is produced by bone marrow stromal cells, the coexpression of CD138 and c-met by BMPCs and TPCs, unlike PPCs, might be important for survival of normal mature PCs. The overexpression of HGF by MM PCs compared with normal BMPCs21 may be indicative of the acquisition of an additional autocrine loop promoting the survival of tumor PCs. Another heparan sulfate-binding factor, midkine (MDK), with antiapoptotic and mitogenic activities61 was induced more than 24-fold in BMPCs compared with PPCs. The gas6/c-mer pathway also potentially plays a major role in mature PC homeostasis. As shown, GAS6 was overexpressed in all PC subsets compared with B cells and this overexpression can be involved in a paracrine PC/osteoclast interaction.46 In addition, as shown using microarrays and quantitative RT-PCR (Figure 3C), TPCs and above all BMPCs overexpressed MER, one of the 3 gas6 receptors, compared with PPCs. Activation of the c-mer tyrosine kinase prevents apoptosis in several models. Collectively, these data suggest that an autocrine loop involving gas6/c-mer could be involved in the long-term survival of fully mature PCs.62,63 Finally, the SDF-1/CXCR4 autocrine loop described in mature PCs unlike PPCs, was shown to promote survival of CD34+ hematopoietic precursors in bone marrow.64 Interestingly, 2 well-known antiapoptotic factors, A20 and IAP2, were overexpressed in BMPCs and TPCs compared with PPCs. Noteworthy, BCL2 is significantly up-regulated in BMPCs (P < .01; ratio BMPC/PPC = 5.5), but not in TPCs (P = .8), compared with PPCs, in agreement with previous reports.19,65 In addition, several genes coding for proapoptotic proteins (the effector caspase CASP6, the bcl-2 antagonist BAK1, the death receptor FAS, and RAID/CRADD, a member of the apoptosis signaling pathway) were overexpressed in PPCs. These data are in good agreement with the high susceptibility of plasmablasts to apoptosis. PPCs slightly overexpressed API4, the gene coding for survivin. However, survivin not only inhibits apoptosis but also participates to cell cycle progression66 and could thus be enhanced in PPCs due to their proliferative status. The mitogen-activated protein kinase (MAPK) signaling pathway is activated in response to a range of growth factors and other external stimuli. PPCs overexpressed 2 MAPKs, ERK2 and ERK3, together with the MAPK-activated protein kinase 3pK (MAPKAPK3), which is targeted by the 3 groups of MAPKs previously identified, specifically, ERK, JUNK, and p38 MAPK.67 In addition, the MAPK phosphatase 1 (DUSP1) is one of the most highly increased genes during PC maturation (ratio BMPC/PPC = 30). DUSP1/MKP-1 binds to MAPK leading to their rapid inactivation.68 Thus, plasmablasts expressed several critical components of the MAPK pathway, whereas mature PC expressed genes involved in the inhibition of this major signal transduction pathway. Interestingly, activation of the MAPK pathway is critical for malignant PC proliferation and might be one of the oncogenic events leading to the emergence of the myeloma clone.
Several transcription factors were differentially expressed in PC subsets. Expression of the different NF-κB family members seemed to be tightly regulated during PC maturation. Indeed, Affymetrix data showed an up-regulation of NFKB2, RELB, IKKE, and IKBA in BMPCs and TPCs, whereas BCL3 was statistically overexpressed in PPCs. EGR1, a zinc-finger transcription factor involved in cell growth and differentiation was up-regulated in mature PCs compared with PPCs. Finally, PPCs overexpressed EZH2/ENX-1, which belongs to the polycomb group (PcG) of genes. In humans, 2 distinct PcG complexes have been identified, one containing EZH2 and the other one containing BMI-1. The expression pattern of these 2 complexes is mutually exclusive, in particular during germinal center reaction: BMI-1 is dominant in resting B cells of the mantle cell zone and in centrocytes, whereas EZH2 was seen in dividing Ki-67+ centroblasts.69 Overexpression of EZH2 is also seen in a highly proliferative subclass of MM.23 We found a similar nonoverlapping expression profile of EZH2 and BMI1, respectively, in proliferative plasmablasts and resting mature PCs. Indeed, BMI1 was significantly (P < .01) up-regulated in BMPCs (ratio BMPC/PPC = 4.7) and to a lesser extent in TPCs (ratio TPC/PPC = 1.6).
Conclusion
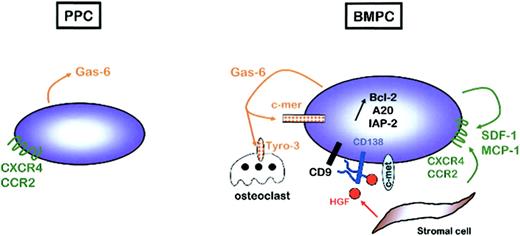
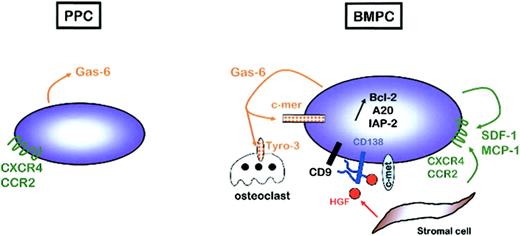
In this work, we studied 5 homogeneous cell populations representing the late stages of human B-cell maturation, from resting PBB cells to fully mature BMPCs. Comparison of gene expression profiles of plasmablasts and mature PCs allowed the identification of intercellular communication and transduction pathways that may be involved in PC differentiation and homing. In particular, we identified several autocrine and paracrine loops, such as SDF-1/CXCR4, MCP-1/CCR2, gas6/c-mer, or HGF/c-met, that could be involved in the gathering of mature PCs within specialized microenvironment niches and in the up-regulation of antiapoptotic molecules associated with a prolonged survival of BMPCs, as well as MM PCs (Figure 4). These data may provide further insights into the knowledge of the late stages of normal B-cell differentiation. PPCs can be efficiently transduced using retroviral vectors (B.K. et al, unpublished data, November 2002) and are thus potentially a powerful tool to evaluate through gene transfer the biologic relevance of the genetic changes that specifically discriminate proliferative and apoptotic plasmablasts from nondividing and long-lived BMPCs. In addition, this model has potential implications for understanding the molecular events involved in the deregulation of survival and proliferation of PCs and emergence of PC dyscrasias.
Autocrine and paracrine regulatory loops involved in PC survival within bone marrow microenvironment. PPCs express high levels of GAS6, but none of its receptors, and CXCR4 and CCR2, but not their ligands. On the contrary, BMPCs express GAS6, CXCR4, and CCR2 but also MER, SDF1, and MCP2, suggesting the existence of autocrine survival loops. In addition, BMPCs express MET, the receptor for HGF produced by bone marrow stromal cells. CD138 is a coreceptor for HGF, but also for other growth factors, in particular in association with the tetraspanin CD9. The combination of all these autocrine and paracrine signals could participate in the up-regulation of antiapoptotic proteins that is a hallmark of BPMCs.
Autocrine and paracrine regulatory loops involved in PC survival within bone marrow microenvironment. PPCs express high levels of GAS6, but none of its receptors, and CXCR4 and CCR2, but not their ligands. On the contrary, BMPCs express GAS6, CXCR4, and CCR2 but also MER, SDF1, and MCP2, suggesting the existence of autocrine survival loops. In addition, BMPCs express MET, the receptor for HGF produced by bone marrow stromal cells. CD138 is a coreceptor for HGF, but also for other growth factors, in particular in association with the tetraspanin CD9. The combination of all these autocrine and paracrine signals could participate in the up-regulation of antiapoptotic proteins that is a hallmark of BPMCs.
Prepublished online as Blood First Edition Paper, March 27, 2003; DOI 10.1182/blood-2002-10-3161.
The online version of the article contains a data supplement.
The publication costs of this article were defrayed in part by page charge payment. Therefore, and solely to indicate this fact, this article is hereby marked “advertisement” in accordance with 18 U.S.C. section 1734.

