Abstract
A phase 1 diagnostic study was performed to evaluate a novel technology for clinical proteom research based on capillary electrophoresis and mass spectrometry. Urine from 40 patients after hematopoietic stem cell transplantation (HSCT; 35 allogeneic, 5 autologous) and 5 patients with sepsis was collected for a period of 100 days and analyzed. More than 1000 different polypeptides could be detected in individual samples. Polypeptide patterns excreted in the urine of patients were significantly different from those of healthy volunteers. No significant differences were detected comparing different conditioning regimens. The aim of this study was to identify polypeptide patterns functioning as early indicators of graft-versus-host disease (GVHD). Eighteen patients developed GVHD after allogeneic HSCT. Sixteen differentially excreted polypeptides formed a pattern of early GVHD markers, allowing discrimination of GVHD from patients without complications with 82% specificity and 100% sensitivity, cross-validated. Inclusion of 13 sepsis-specific polypeptides allowed us to distinguish sepsis from GVHD with a specificity of 97% and a sensitivity of 100%. Sequencing 2 prominent GVHD-indicative polypeptides led to the identification of a peptide from leukotriene A4 hydrolase and a peptide from serum albumin. The data reveal that capillary electrophoresis and mass spectrometry allow identification of biomarkers for a variety of diseases or related complications. (Blood. 2004;104:340-349)
Introduction
Allogeneic hematopoietic peripheral blood stem cell transplantation (allo-HSCT) is applied with success to many hematopoietic malignancies. Despite its curative potential, the application of allo-HSCT is limited by life-threatening complications such as severe acute graft-versus-host disease (GVHD).1,2 Depending on the type of transplantation, the immunosuppressive treatment, and the underlying disease, between 35% and 70% of patients develop GVHD, requiring immunosuppressive treatment in more than 35% of patients.3 Early diagnosis and better control of GVHD will be necessary to increase the safety of allo-HSCT, also with respect to a broader application of HSCT.
Currently, diagnosis of GVHD is based mainly on clinical parameters such as skin rash, diarrhea, elevation of serum liver enzymes, or other. Differential diagnosis of GVHD depends on organ biopsies to distinguish GVHD from other common complications that present with similar clinical symptoms (eg, reactivation of endogenous viruses or medication-induced side effects). The use of biomarkers such as differentially expressed or excreted polypeptides and proteins has the potential for improving early and accurate diagnosis of GVHD and other complications of allo-HSCT without requiring invasive procedures, such as biopsies.4 Single molecules are currently described as potential markers for GVHD5-7 but the data of all molecules potentially involved are not yet reported. Due to a lack of suitable technology, the search for polypeptides or proteins involved in GVHD up to now has been naturally biased by the preferential analysis of known molecules with potential pathophysiologic importance. An analytic display of all proteins and peptides present or changed after allo-HSCT might allow the gain of significantly more insight into the development of and processes involved in GVHD. Proteomics are being developed to characterize and identify the molecules significant for different diseases, enabling early identification of biomarkers and early intervention in cancer.8-10 A technique allowing the reproducible analysis of all polypeptides present in complex biologic samples within a short time and suitable for high throughput analysis was recently developed by our group.11-13 The stable on-line coupling of capillary electrophoresis and mass spectrometry (CE-MS), together with advances in software analysis, led to the display of more than 1000 polypeptides present in individual samples, identified via their particular migration time in the CE and their actual mass.14 All data generated from individual samples are stored in a database, allowing intraindividual comparison of the samples taken at different time points, yielding a patient-specific pattern, as well as comparison of patient groups and controls.
Screening of urine from healthy volunteers led to the establishment of a “normal urine polypeptide pattern” consisting of more than 500 polypeptides.15 This allowed a comparison with patterns obtained from patients with different diseases and led to the detection of polypeptide patterns indicative of the health status of individuals. Here we report the application of CE-MS as a phase 1 clinical diagnosis trial to screen patients with hematologic malignancies after allo-HSCT, to evaluate the feasibility of identifying marker peptide patterns for GVHD or other complications related to allo-HSCT. Thus, samples were collected from 45 patients (35 after allo-HSCT, 5 after autologous transplantation, and 5 with septic complications) and analyzed by CE-MS over a period of about 100 days after HSCT.
Patients, materials, and methods
Patients
The protocol for this study was approved by the local ethics committees and informed consent was obtained from all participants. There were 40 patients who underwent transplantation at Hannover Medical School, the University of Regensburg, and the University of Munich who were included in the analysis. There were 35 patients (26 with acute myeloid leukemia [AML], 4 with acute lymphocytic leukemia [ALL], one with high-risk chronic myeloid leukemia [CML], one with non-Hodgkin lymphoma [NHL], one with follicular lymphoma, one with multiple myeloma [MM], and one with myelodysplastic syndrome [MDS]) who received transplants from allogeneic donors, whereas 5 patients (1 with AML, 2 with MM, 2 with NHL) received autologous stem cells. Urine samples were collected prior to conditioning and then twice a week from each patient over 20 to 100 days after HSCT.
In addition, samples from 5 patients in the intensive care unit (ICU) with severe septic complications were included.
Conditioning and transplantation
Nineteen patients were treated with reduced-intensity conditioning regimens16 consisting of low-dose total body irradiation (TBI) and fludarabin (FAra) in the majority of the protocols; 10 of these patients were treated according to the FLAMSA (fludarabin, amsacrin) protocol.17 Standard-intensity protocols were used to treat 16 patients: 8 received TBI (6 × 2 Gy over 3 days) and cyclophosphamide (60 mg/kg for 2 days), and 8 received busulfan (4 mg/kg for 4 days) followed by cyclophosphamide (120 mg/kg for an additional 2 days). There were 5 patients who received additional radioimmunotherapy (RIT).
There were 20 patients who received transplants from unrelated donors (19 from a matched unrelated donor [MUD], 1 from a mismatch), 12 patients who received stem cells from HLA-identical family donors, and 3 patients who received stem cells from haploidentical family donors. Stem cell sources were peripheral blood stem cells in 33 patients and bone marrow in 4 patients. There were 2 patients with haploidentical donors who received bone marrow plus peripheral blood stem cells.
GVHD prophylaxis was methotrexate (MTX) or mycophenolate mofetil (MMF) and cyclosporin A (CSA) in 32 patients, and T-cell depletion in 3 patients.
There were 5 patients (1 with MM, 1 with AML, and 3 with NHL) who received transplants of autologous peripheral stem cells and who served as controls for the allo-response and GVHD patterns in this setting. The clinical data of the patients after HSCT are summarized in Table 1. In addition, samples were obtained from 5 patients with severe septic complications from the ICU. Patterns of these patients and from one patient after HSCT developing sepsis were compared with the polypeptide patterns “significant” for GVHD.
Sample preparation for capillary electrophoresis
Spot urine samples were collected twice a week starting before conditioning until discharge from the ward and stored at -20°C until analysis. Aliquots of 2 mL were adjusted to pH 10.0 using ammonia and cleared by centrifugation for 10 minutes at 13 000g as previously described.11 In brief, 2 mL was applied onto a Pharmacia C2 column (Pharmacia, Uppsala, Sweden) to enrich for proteins and peptides and to remove urea, salts, and other confounding material. Polypeptides were eluted with 50% acetonitrile in H2O containing 0.5% formic acid, frozen, and lyophilized overnight in a Christ Speed-Vac RVC 2-18/Alpha 1-2 (Christ, Osterode, Germany). The samples were resuspended in 20 μL high performance liquid chromatography (HPLC)-grade water, sonicated for one minute, and centrifuged for 10 minutes (13 000g at 4°C). The CE was injected with 100 nL, and the remaining material was stored at -80°C for further evaluation like repeating runs or sequencing. All chemicals were purchased from Merck KGaA (Darmstadt, Germany).
Capillary electrophoresis and mass spectrometry
About 100 nL of the prepared sample was injected into the CE system, a P/ACE MDQ (Beckman Coulter, Fullerton, CA) system, and separation was performed with 30 kV on the injection site. Upon application of high voltage the ions (polypeptides) in the sample were initially focused and subsequently separated by electrophoresis. For detection and characterization of the polypeptides, the CE was coupled on-line with an electrospray ionization time-of-flight mass spectrometer (ESI-TOF-MS). CE-ESI-MS coupling was accomplished using a CE-ESI-MS sprayer kit (Agilent Technologies, Palo Alto, CA). On-line TOF detection and data acquisition was performed on a Mariner Biospectrometry Workstation (Applied Biosystems, Farmington, CT). The data acquisition and the MS run were automatically controlled by the CE program via contact-close relays. To achieve highest signal intensities, the sheath flow rate was set to a minimum (100-1000 nL/min), while the nebulizer gas was turned off during acquisition. Under these conditions, 50 fmol of a set of different standard proteins and peptides resulted in signals with signal-to-noise ratios between 50 and 500.14 The used TOF-MS delivers the data with mass accuracy better than 100 parts per million (ppm) under the conditions applied. This setup enables the analysis of amounts of less than 10 pg of polypeptides and can potentially yield the display of thousands of different polypeptides present in one individual sample without the need for any specific reagents.14,15
Data processing
The enormous amount of information obtained in one single CE-MS run required the development of specialized software to evaluate the data in a reproducible and automated fashion.18 The software (MosaiquesVisu; Biomosaiques software, Hannover, Germany) recognizes MS peaks, determines the charge of each signal based on isotopic distribution and conjugated mass, and subsequently generates a list of polypeptides defined by mass and migration time, which is the basis for comparison with other samples and is stored for each individual sample in the database. The signal intensity of the individual molecules is shown in a color code (ranging from 0 to 25 000 MS counts) and serves as a measure for the relative abundance of particular peptides. The data generation and data processing are shown in Figures 1 and 2.
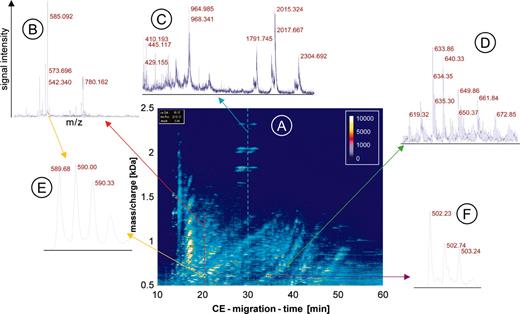
CE-MS data. The raw data of urine from one patient are shown to visualize the generation of the data and depict the amount of information contained in the data. An overview (A) is shown as a 3-dimensional contour plot, where the information and resolution are reduced. Mass per charge is plotted on the y-axis against CE migration time on the x-axis, with the signal intensity color coded. Each dash shown in this contour plot corresponds to a single polypeptide analyzed in the CE-MS run. To display the information content in each of the about 1000 single spectra contained in one CE-MS analysis, a magnified view of the MS data of 3 individual spectra is shown (B-D). In the spectra the signal intensity (amplitude) on the y-axis is plotted onto the mass/charge on the x-axis, as indicated in B. The cross-section on the raw data plot is shown as arrows in red (B), blue (C), or green (D). An even further magnification of MS spectra from 2 individual polypeptides reveals the high resolution of the technology used (E, yellow arrows, z = 3; and F, violet arrow, z = 2).
CE-MS data. The raw data of urine from one patient are shown to visualize the generation of the data and depict the amount of information contained in the data. An overview (A) is shown as a 3-dimensional contour plot, where the information and resolution are reduced. Mass per charge is plotted on the y-axis against CE migration time on the x-axis, with the signal intensity color coded. Each dash shown in this contour plot corresponds to a single polypeptide analyzed in the CE-MS run. To display the information content in each of the about 1000 single spectra contained in one CE-MS analysis, a magnified view of the MS data of 3 individual spectra is shown (B-D). In the spectra the signal intensity (amplitude) on the y-axis is plotted onto the mass/charge on the x-axis, as indicated in B. The cross-section on the raw data plot is shown as arrows in red (B), blue (C), or green (D). An even further magnification of MS spectra from 2 individual polypeptides reveals the high resolution of the technology used (E, yellow arrows, z = 3; and F, violet arrow, z = 2).
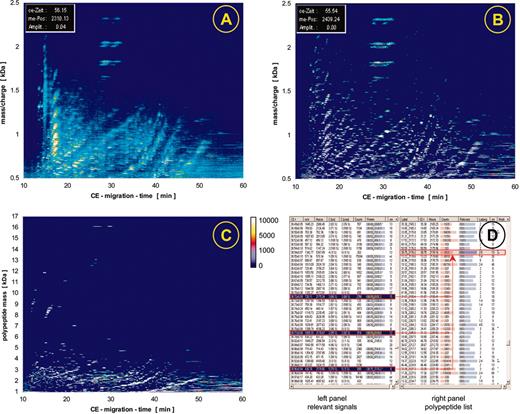
Raw data contour plots and data processing. The individual steps of the data processing are illustrated here, showing data obtained after screening urine from one patient. The initial raw data (A) are examined for signals that fit the criteria of “real polypeptide” signals, which are collected (B) and deposited in a peak list (D, left panel). Subsequently, a charge is assigned to each of these signals, conjugated peaks are combined as indicated by the red arrows, and as a result a spectrum based on mass and normalized migration time is obtained as graphically depicted in C. This spectrum contains the information on all peaks (a partial list is shown in D, right panel), including time, mass, intensity and signal-to-noise ratio.
Raw data contour plots and data processing. The individual steps of the data processing are illustrated here, showing data obtained after screening urine from one patient. The initial raw data (A) are examined for signals that fit the criteria of “real polypeptide” signals, which are collected (B) and deposited in a peak list (D, left panel). Subsequently, a charge is assigned to each of these signals, conjugated peaks are combined as indicated by the red arrows, and as a result a spectrum based on mass and normalized migration time is obtained as graphically depicted in C. This spectrum contains the information on all peaks (a partial list is shown in D, right panel), including time, mass, intensity and signal-to-noise ratio.
To account for run-to-run variations, the CE migration times were normalized using 104 polypeptides present with high probability in urine samples. This allowed comparison and search of conformity within different individual samples. The signal intensity was normalized to the total ion current. Polypeptides were considered identical if the mass deviation was less than 300 ppm and the CE migration-time deviation was less than 5 minutes.
Support vector machine
Statistical analysis was performed using support vector machines. This tool has the advantage of discriminating data in high-dimensional parameter space. Its fast and stable algorithms showed good performance in theevaluation of clinical markers15,19 and different areas of biologic analyses like DNA arrays.20
Sequencing of discriminatory polypeptides using a matrix-assisted laser desorption/ionization (MALDI-tandem MS)
The MS-MS analyses were performed with a MALDI-TOF-TOF-MS (Ultraflex; Bruker Daltonik, Bremen, Germany) as previously described.14,21 A complete CE run (as described in “Capillary electrophoresis and mass spectrometry”) was spotted onto the MALDI target (one spot every 15 seconds) with the matrix solution (5 mg/mL sinapinic acid in 50% acetonitrile and 0.1% trifluoroacetic acid [TFA]) added as sheath liquid at 4 μL/min. The target was subsequently examined in MS mode for the polypeptides of interest, based on the data from the CE-MS analyses. Polypeptides of interest were sequenced in MS-MS mode, without the use of collision-induced dissociation (CID) gas.
Results
CE-MS allows the characterization of more than 1000 polypeptides present in complex biologic samples by the identification of the m/z of the molecules and their migration time in the CE. As a third dimension, the signal intensity (MS counts) serves as a measure for the relative abundance of the molecules detected. The MS spectra are generated by continuously analyzing the m/z and signal intensity of molecules present in a sample. These data are collected every 3 seconds over the CE run of about 45 minutes and this information is stored as individual spectra. Thus, about 1000 individual spectra are generated and stored, yielding the total ion current chromatogram.11,15
It is impossible to show all individual spectra and information obtained in a single CE-MS run. To depict the raw data, the information (resolution) is reduced and the data are shown as 3-dimensional contour plots (Figure 1). The contour plot of the raw data is generated by plotting all information received corresponding to mass per charge (x-axis), signal intensity (color code), and CE migration time (y-axis). Each dash shown in the contour plot corresponds to a single polypeptide with a particular charge state analyzed in the CE-MS run (Figure 1A). To display the information content of the plot, which is generated by the single spectra, a magnified view of MS data of 3 individual spectra at the corresponding parts of the plot is shown (Figure 1B-D). To reveal the high resolution of the technology used, a further magnification of MS spectra of 2 individual polypeptides is shown in Figure 1E-F.
As evident, it is impossible to “manually” analyze the data contained in about 1000 spectra within a reasonable time (less than 5 days). Hence, software (MosaiquesVisu) was developed to automatically process the enormous amount of data generated when CE-MS is applied toward the analysis of complex body fluids.
The processing of a CE-MS spectrum using MosaiquesVisu is shown in Figure 2. Signals (peaks above a certain signal-to-noise ratio, see spectra Figure 1B-F) within the individual spectra are recognized by the software and form the raw data plot (Figure 2A). In the next step, these peaks are combined to a list of “relevant signals.” Relevant signals are defined as peaks that are present in at least 3 consecutive spectra. These relevant signals are graphically depicted in Figure 2B and as part of the resulting peak list in Figure 2D (left panel). After collecting all relevant signals and assigning a charge to each peak, the actual mass is calculated based on the mass-per-charge ratio of the individual polypeptides (Figure 2C-D, right panel). As a last step, the data are normalized with respect to migration time and amplitude, using a set of internal standards present in all samples screened to date.15 The data obtained for each individual sample are deposited as peak lists in a Microsoft Access database (Microsoft, Seattle, WA) containing the information on mass and CE migration time as a unique identity of the polypeptides and signal intensity, corresponding to the relative abundance of the molecules.
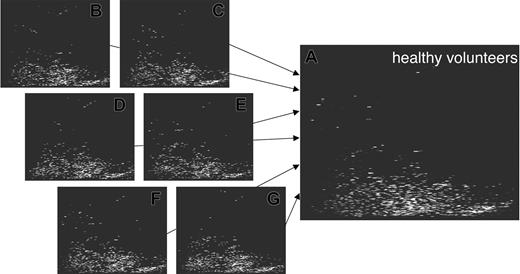
This type of analysis yields highly comparable spectra and hence enables the generation of a high-resolution polypeptide pattern, which is generally present in healthy individuals.15 The information present in the individual spectra is compiled to createtypical polypeptide patterns (Figure 3). To avoid that polypeptides present in only one or a few samples appear as “typical,” a penalty algorithm is utilized to reduce the signal intensity of these peptides. Hence, only consistently observed spots are displayed.
Generation of patterns for groups of test persons. The screening of samples obtained from different healthy individuals yielded the generation of several hundreds of plots to date. The storage of all data within the database allows the comparison of the individual data and the compilation of the data into a general pattern significant for health (shown here). This allows screening for common molecules excreted in different individuals and can also be applied toward the data exploitation of patients with different diseases or even different stages of disease. In analogy to the generation of the control pattern, pattern for patients undergoing HSCT were generated.
Generation of patterns for groups of test persons. The screening of samples obtained from different healthy individuals yielded the generation of several hundreds of plots to date. The storage of all data within the database allows the comparison of the individual data and the compilation of the data into a general pattern significant for health (shown here). This allows screening for common molecules excreted in different individuals and can also be applied toward the data exploitation of patients with different diseases or even different stages of disease. In analogy to the generation of the control pattern, pattern for patients undergoing HSCT were generated.
For this phase 1 diagnostic study, spot urine samples from 40 patients were collected after HSCT (35 allo-HSCT, 5 auto-HSCT) at different time points, ranging from the time before conditioning until 100 days after transplantation or discharge from the hospital. The clinical data of these patients showing the type of transplantation, conditioning treatment, and specific problems occurring within the observation period are summarized in Table 1. In addition, spot urine samples of 5 ICU patients with sepsis were collected. After performing the CE-MS analysis, the data were compiled and compared with healthy controls. The patient samples were grouped according to the conditioning regimens, resulting in 3 groups: those receiving reduced-intensity conditioning (n = 19), those receiving standard-intensity conditioning (n = 16), and those with the autologous protocols (n = 5). The analysis of these data showed significant differences between patients and controls, as expected. Based on a list of 21 polypeptides differentially excreted in the urine (Table 2), patients could be distinguished from the controls with a specificity of 95% and a sensitivity of 100% after cross-validation using support vector machines.20 As evident from Table 2, a comparison of the data from the 3 distinct groups of patients revealed no significant discrepancy between the different conditioning regimens. Hence, the differences seen between the healthy control and the patients were most likely due to the underlying disease and not due to different conditioning regimens.
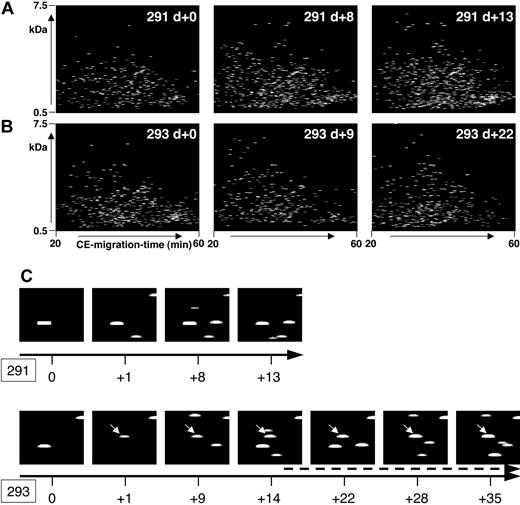
In patients who did not develop severe complications after HSCT within the observation period, the polypeptide pattern did not show any significant changes during this period. As an example, data from patient 291, who was treated according to the reduced-intensity conditioning prior to HSCT,16 is shown in Figure 4A. No statistically significant change occurred in the polypeptide patterns from this patient when all the samples were compared with each other.
Polypeptide plots from patient no. 291 (no complications) and patient no. 293 (GVHD). Polypeptide plots (polypeptide mass over CE migration time) are shown for 2 patients, no. 291 (A) and no. 294 (B), at an early posttransplantation period. While patient 291 had no complications in the observation period, patient 294 was diagnosed with GVHD on day +14. To visualize the search for biomarkers and to show the differences between these patients, panel C shows a magnified view of the plots obtained at different days after HSCT (0 to +13/+35 as shown by the black arrow) of the polypeptide 1.85 kDa/34 minutes. This polypeptide appears in the samples of patient 293, as early as day +1, showing increasing intensity over the progression of GVHD (arrow, starting at day +15, indicating the clinical diagnosis of GVHD).
Polypeptide plots from patient no. 291 (no complications) and patient no. 293 (GVHD). Polypeptide plots (polypeptide mass over CE migration time) are shown for 2 patients, no. 291 (A) and no. 294 (B), at an early posttransplantation period. While patient 291 had no complications in the observation period, patient 294 was diagnosed with GVHD on day +14. To visualize the search for biomarkers and to show the differences between these patients, panel C shows a magnified view of the plots obtained at different days after HSCT (0 to +13/+35 as shown by the black arrow) of the polypeptide 1.85 kDa/34 minutes. This polypeptide appears in the samples of patient 293, as early as day +1, showing increasing intensity over the progression of GVHD (arrow, starting at day +15, indicating the clinical diagnosis of GVHD).
There were 18 patients who developed GVHD after allo-HSCT, between day 13 and day 85 (mean: day +26). The polypeptide data from the samples collected at the diagnosis of GVHD were compared with the data from the patients without complications. This comparison revealed significant changes of polypeptide excretion at the time of the clinical diagnosis of GVHD. Only polypeptides present/absent with an absolute difference of more than 50% or with a more than 10-fold difference in the signal intensity between the 2 groups were accepted as significant disease markers. Under these very stringent conditions, 16 polypeptides potentially significant for GVHD could be identified. The molecular weight of some of these polypeptides and their appearance in the “GVHD,” “no complications,” or “septic” groups are shown in Table 3.
Figure 4B shows some of the polypeptide patterns from samples of patient 293 over a period of 35 days after HSCT. Grade II GVHD was diagnosed on day +14 with an increase of severity over time resulting in grade IV GVHD of the intestine. The polypeptide plots were searched for differentially excreted peptides, defined in Table 3 as GVHD polypeptide pattern. As an example, the excretion of one of the marker peptides, defined via the actual mass of 1.85 kDa and the CE time of 34 minutes, is shown in Figure 4C (293). Peptide 1.85 kDa/34 minutes is excreted early before diagnosis of GVHD (day +1), gaining signal intensity over the progression of GVHD. The same coordinates (1.85 kDa/34 minutes) are shown for patient 291 (Figure 4C) without problems after HSCT, and this polypeptide could not be detected.
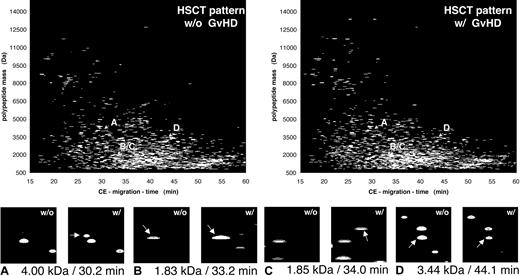
To show all data obtained from all patients in the groups, the compiled patterns and the distribution of some polypeptides with discriminatory value for all patients (GVHD indicated also as “w/” and “HSCT with no complication” indicated also as “w/o”) are shown in Figure 5. The magnified view in the lower panel of Figure 5 shows 4 differentially excreted polypeptides, defined by their particular mass and CE migration time. These changes reflect all changes in all patients without (w/o) or with (w/) GVHD. This allowed the generation of a typical polypeptide pattern that could be used to distinguish between “no complications” and GVHD. Applying the support vector machine algorithms, classification based on the 16 polypeptides shown in Table 3 is possible with a sensitivity of 100% and a specificity of 82% after cross-validation.
Compiled plots of patients with and without GVHD. The data obtained on the samples collected over the observation period were compiled for the patients without complications after HSCT (w/o GVHD) and compared with the polypeptide patterns obtained from patients at diagnosis of GVHD (w/GVHD). Comparison of the 2 patterns shows a number of differentially excreted polypeptides, as visualized here by inserts that magnify the particular parts of the pattern were the changes occur (marked by arrows). Shown are 4 discriminatory peptides, marked in each pattern with A to D and arrows indicating the position of each of these molecules in the compiled patterns, for patients without (w/o) or with (w/) GVHD. Panels A and C show polypeptides newly appearing in all patients with GVHD. Panel B shows a more than 10-fold increase in signal intensity observed in all samples of patients with GVHD, while panel D shows a more than 10-fold reduction of the intensity of the 3.44 kDa/44.1 minutes peptide.
Compiled plots of patients with and without GVHD. The data obtained on the samples collected over the observation period were compiled for the patients without complications after HSCT (w/o GVHD) and compared with the polypeptide patterns obtained from patients at diagnosis of GVHD (w/GVHD). Comparison of the 2 patterns shows a number of differentially excreted polypeptides, as visualized here by inserts that magnify the particular parts of the pattern were the changes occur (marked by arrows). Shown are 4 discriminatory peptides, marked in each pattern with A to D and arrows indicating the position of each of these molecules in the compiled patterns, for patients without (w/o) or with (w/) GVHD. Panels A and C show polypeptides newly appearing in all patients with GVHD. Panel B shows a more than 10-fold increase in signal intensity observed in all samples of patients with GVHD, while panel D shows a more than 10-fold reduction of the intensity of the 3.44 kDa/44.1 minutes peptide.
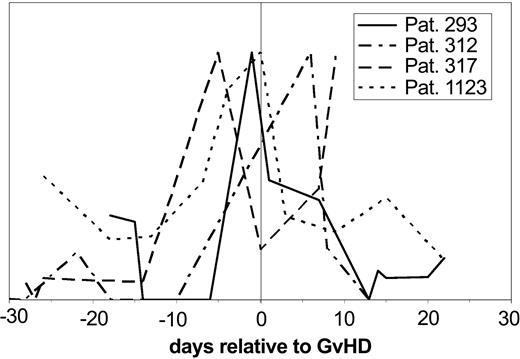
Subsequent evaluation of the samples obtained prior to the clinical diagnosis of GVHD for the same pattern revealed that the “GVHD-typical” pattern could be observed between 5 and 15 days in advance of the clinical diagnosis. The value of these polypeptides became even more obvious when single molecules significant for GVHD were followed over time after HSCT and changes of the signal intensity were plotted against the days relative to diagnosis of GVHD in 4 different patients (Figure 6). The excretion of one polypeptide (1.83 kDa) is shown relative to the time of the clinical diagnosis of GVHD. This particular marker peptide appears with significant intensity between 5 and 15 days before the clinical diagnosis of GVHD in all patients.
Individual polypeptides relevant for GVHD in individual patients. The signal intensity of the discriminating polypeptide (1.83 kDa/33.2 minutes CE migration time) is shown over the time course relative to GVHD development in 4 patients with GVHD relative to the time of GVHD diagnosis. The signal intensity of the molecule shown here rises at the time before diagnosis of GVHD, at least 5 days and up to 15 days before diagnosis.
Individual polypeptides relevant for GVHD in individual patients. The signal intensity of the discriminating polypeptide (1.83 kDa/33.2 minutes CE migration time) is shown over the time course relative to GVHD development in 4 patients with GVHD relative to the time of GVHD diagnosis. The signal intensity of the molecule shown here rises at the time before diagnosis of GVHD, at least 5 days and up to 15 days before diagnosis.
The excretion of polypeptides in GVHD might be similar to the polypeptides observed during sepsis and in patients with bacteriaemia. Since it is necessary to distinguish between these complications, we examined the urinary polypeptides in septic patients. To this end, samples from 5 ICU patients with sepsis were examined. As shown in Table 3, some of the indicative polypeptides for GVHD were, in fact, found in the septic patients. However, the majority of the GVHD-indicative polypeptides showed a distribution different from sepsis and, in addition, urine from septic patients contained several polypeptides that were not present in either “no complication” or GVHD patients. Hence, septic patients could be distinguished from patients with GVHD based solely on the polypeptide pattern. Using the panel of GVHD- and sepsis-specific polypeptides, sepsis could be distinguished from GVHD with 100% sensitivity and 97% specificity after cross-validation.
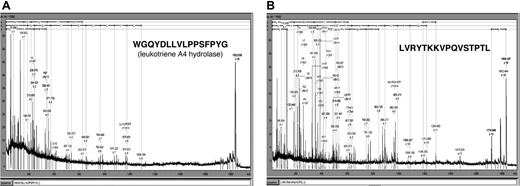
To further characterize the GVHD-specific polypeptides, 2 of the differentiating polypeptides indicative for GVHD development were sequenced. The sample from patient 312 was separated by CE and spotted onto the MALDI target. Figure 7 shows the MALDI-MS-MS spectra obtained. The 1.85-kDa polypeptide (CE migration time: 34 minutes) was identified as a fragment of leukotriene A4 hydrolase, the rate-limiting enzyme in the biosynthesis of leukotriene 4B, known as a mediator of inflammation.22,23 The 1.83-kDa polypeptide (CE migration time: 33.2 minutes) was a fragment of serum albumin excreted in the urine. This molecule was present with high abundance in patients with GVHD, while it was found with much lower signal intensity in healthy controls, patients with no problems after HSCT, and patients with sepsis or fever (Table 3).
Sequence of 2 discriminating polypeptides indicative for GVHD. Two prominently excreted polypeptides for GVHD (Table 3) were sequenced yielding peptides shown above as MALDI-MS-MS spectra as well as sequence. Searching of the databases revealed one 1.85 kDa/34 minutes polypeptide from leukotriene A4 hydrolase (A) and one 1.83 kDa/33.2 minutes polypeptide from serum albumin (B).
Sequence of 2 discriminating polypeptides indicative for GVHD. Two prominently excreted polypeptides for GVHD (Table 3) were sequenced yielding peptides shown above as MALDI-MS-MS spectra as well as sequence. Searching of the databases revealed one 1.85 kDa/34 minutes polypeptide from leukotriene A4 hydrolase (A) and one 1.83 kDa/33.2 minutes polypeptide from serum albumin (B).
Discussion
The results presented here as well as reports in the literature strongly suggest that proteomic analysis of body fluids will become increasingly important in the clinical diagnosis of various diseases.24,25
The aim of this study was to evaluate the application of CE-MS to hematopoietic stem cell transplantation, in order to identify indicative differences in polypeptide patterns generated from patients developing GVHD in comparison to patterns generated from patients without problems or different complications. The patients represent a cross-section of those undergoing HSCT and were treated according to the different conditioning regimens: autologous transplantation and reduced-intensity or standard-intensity conditioning. CE-MS currently appears to be the best-suited technology to apply proteom analysis toward clinical samples. The wealth of data obtained in a single analysis is impossible to display in a figure, but can be judged by the example shown in Figures 1 and 2. The high resolution of this technology would allow the examination of more than 100 000 different polypeptides in a single analysis within about 50 minutes. This high resolution is necessary, allowing an initial large number of different polypeptides to be examined, getting an unbiased view and leading eventually to a highly discriminatory but restricted “disease” or “complication-specific pattern.” The high resolution evidently requires software solutions for the automated extraction of the relevant data. The lack of such software has most likely hampered similar approaches in the past. New developments in the software applied for data processing now allow researchers to obtain information on polypeptides present in body fluids in a reproducible way.14
The reproducibility of this type of analysis is represented by Figure 3. In general, about 500 polypeptides are present with an absolute probability of more than 50% in urine samples, allowing compilation of the data and the generation of a typical pattern significant for health or certain disease. Randomly appearing polypeptides found in individual samples with low frequency most likely reflect individual alterations for example of diet, exercise, etc.11,15 Such polypeptides are excluded from the compilation, but still saved.
Due to the speed and accuracy of CE-MS, a rapid diagnosis of complications based on the pattern recognition will be possible, without the need for specific reagents or different matrices. This is important when aiming toward an unbiased diagnosis, allowing all potential molecules to be included in the generation of differentiating patterns.
The polypeptide data from the CE-MS analysis (Table 2) clearly allowed differentiation from healthy controls solely based on the polypeptide pattern with a specificity of 95% and a sensitivity of 100%. When the 3 different conditioning groups were compared, no significant difference between these 3 groups could be identified. Patients undergoing HSCT can be distinguished from the controls, most likely due to the underlying disease or the general pretreatment. The different conditioning regimens might induce more subtle changes in the polypeptides excreted, but these will only be found as more patients are examined.
The application of CE-MS yielded the identification of polypeptides that enable us to clearly distinguish between patients with GVHD and those with no problems after HSCT with a high specificity (82%) and a sensitivity of 100% (Table 3). Applying very stringent parameters, 16 polypeptides could be identified that each revealed more than 50% absolute difference between patients without problems and those with GVHD. Hence, each one of these polypeptides on its own is able to distinguish more than 50% of all examined GVHD patients from the controls. This further underlines the power of this type of analysis.
Examination of urine obtained from patients with septic complications yielded a pattern that included several of the polypeptides also indicative for GVHD, but a number of significant differences from the GVHD pattern could be found. It is not surprising that sepsis and GVHD present with partially similar biomarkers excreted in the urine, since both diseases have inflammatory components. However, an additional 13 polypeptides indicative for sepsis could be identified in these patients (Table 3). This allows the distinction of patients with sepsis from those with GVHD with a specificity of 97% and a sensitivity of 100% after cross-validation. Preliminary data suggest that other complications such as viral infections or organ failure result in specific patterns that can be distinguished from the GVHD pattern. Patterns from samples of 3 patients (483, 481, and 313) with cytomegalovirus reactivation alone and those of 2 patients (292 and 910) at the time of acute renal failure did not bear resemblance to the GVHD pattern.
The aim of this study was to detect polypeptide patterns common to all patients with GVHD, thus creating a pattern that would allow recognition of developing GVHD. The number and concentration of possible markers rises with the development and progression of GVHD. The patterns described here are “early GVHD patterns.” A number of additional polypeptides are excreted over the course of GVHD development and as the severity increases, more polypeptides are excreted at higher concentrations (Figure 4C, 293). Treatment of GVHD is usually initiated with steroids and is switched to second-line treatment if there is no response. Second-line treatment of GVHD includes the use of anti-T-cell antibodies such as antithymocyte globulin or OKT3, as well as antibodies directed against the IL-2 receptor or cytokines, such as tumor necrosis factor (TNF). In general, the outcome of patients requiring second-line treatment is poor and the early identification of patients with poor response to first treatment might improve the outcome.26 The decision to start with second-line treatment can be made based on the patient's polypeptide pattern. In order to obtain more insight into the nature of the polypeptides forming the GVHD pattern, sequencing using the MALDI-MS-MS was applied. To date, 2 polypeptides were identified via their sequence. The first one was a 1.85-kDa peptide from the leukotriene A4 hydrolase, the rate-limiting enzyme in the synthesis of leukotriene 4B.22 This enzyme was described previously as up-regulated during GVHD and most likely represents a marker for the inflammatory processes during GVHD development.23 This finding again underlines the ability of CE-MS to display polypeptides and subsequently enable the identification of peptides and proteins involved in the pathophysiology of different diseases.
The second polypeptide was a 1.83-kDa peptide from albumin, which was excreted at a high concentration in the urine of patients with GVHD (Table 3), but not in patients without problems or even in patients with sepsis. It is tempting to speculate that this albumin fragment is excreted at higher levels in patients with GVHD since increased proteolytic activity, as described for GVHD,27 might be found in the kidney as well as in other organs very early in initial inflammatory processes, well before clinical diagnosis.
While not all polypeptides detected in individual patients could already be considered in the generation of the patterns significant for GVHD or sepsis, all these data are saved and available in the database. Thus, increasing the number of patients with different complications will allow additional fine tuning of the results in later studies. The power of the technique presented here is based on the simultaneous analysis of several hundred polypeptides present in individual samples, allowing the generation of an array of biomarkers to be used for differential diagnosis. In conclusion, proteomic analysis using CE-MS may provide a powerful diagnostic tool for early identification of patients developing complications after HSCT, leading to an early and accurate diagnosis and timely and appropriate therapeutic intervention. Our data document that proteomic analysis of urine with CE-MS coupling is a fast, reproducible, and sensitive approach for the identification of complications evolving after allo-HSCT and may be helpful in reducing transplant-related mortality. The results have to be further validated in a prospective study, which is currently underway.
Prepublished online as Blood First Edition Paper, March 30, 2004; DOI 10.1182/blood-2004-02-0518.
Supported in part by grant no. 0312939 from BioProfile “Funktionelle Genomanalyse” and by grant no. 203.19-32329-5-461 from the Lower Saxony Ministry of Economy (H.M.).
T.K., H.M., and E.M.W. are employed by Mosaiques Diagnostics & Therapeutics, whose potential product was studied in the present work.
The publication costs of this article were defrayed in part by page charge payment. Therefore, and solely to indicate this fact, this article is hereby marked “advertisement” in accordance with 18 U.S.C. section 1734.
The authors thank Drs A. John Barrett (NHLBI, NIH) and J. Frederick Mushinski (NCI, NIH) for critical revision of the manuscript, Elke Dammann for excellent documentation of the patient data, and Meike Hillmann and Frank Hausadel for excellent technical support.

