The myelodysplastic syndromes (MDSs) are a group of clonal hematopoietic stem-cell disorders characterized by ineffective hematopoiesis and dysplasia. A wide spectrum of genetic aberrations has been associated with MDS, including chromosomal translocations involving the NUP98 gene. Using a NUP98-HOXD13 fusion gene, we have developed a mouse model that faithfully recapitulates all of the key features of MDS, including peripheral blood cytopenias, bone marrow dysplasia, and apoptosis, and transformation to acute leukemia. The MDS that develops in NUP98-HOXD13 transgenic mice is uniformly fatal. Within 14 months, all of the mice died of either leukemic transformation or severe anemia and leucopenia as a result of progressive MDS. The NUP98-HOXD13 fusion gene inhibits megakaryocytic differentiation and increases apoptosis in the bone marrow, suggesting a mechanism leading to ineffective hematopoiesis in the presence of a hypercellular bone marrow. These mice provide an accurate preclinical model that can be used for the evaluation of MDS therapy and biology.
Introduction
Myelodysplastic syndrome (MDS) is characterized by ineffective hematopoiesis and can be regarded as a premalignant condition that typically has 1 of 3 outcomes. Patients can survive for an extended period of time with the disease, patients can die as a result of complications of severe cytopenia, or the disease can transform to an acute leukemia.1 A number of chromosomal abnormalities, including deletions, amplifications, inversions, and translocations, have been identified in the malignant cells of patients with MDS.1-3
The NUP98 gene is fused to at least 15 different partner genes by chromosomal translocation in a wide spectrum of hematologic malignancies, including acute myeloid leukemia (AML), chronic myelogenous leukemia (CML), and precursor-T lymphoblastic lymphoma/leukemia (pre-T LBL), as well as MDS.4-18 NUP98 is located at chromosome 11p15.5 and encodes a nucleoporin protein that normally mediates transport of RNA and protein across the nuclear membrane.19,20 GLFG repeats within the amino-terminal region of NUP98 are thought to form a docking site for karyopherins, a family of nuclear transport signal receptor proteins.21
NUP98 fusion genes associated with hematopoietic malignancy invariably encode a fusion protein that joins the amino-terminal portion of NUP98, containing the FG repeats, to the carboxyterminal portion of the partner gene. The genes that are fused to NUP98 in malignant cells can be placed into 2 distinct categories: homeobox genes and nonhomeobox genes. Although HOXD cluster genes are typically not expressed in the hematopoietic cells, fusions of NUP98 with either HOXD11 or HOXD13 have been identified in the malignant cells of patients with myeloid malignancies and a t(2; 11)(q31; p15). These translocations have been reported in patients with MDS, AML-M4, and AML-M6.8,10 To elucidate the role of the NUP98-HOXD13 fusion gene in MDS, we generated transgenic mice that expressed a NUP98-HOXD13 fusion gene in hematopoietic tissues.
Materials and methods
Generation of transgenic lines
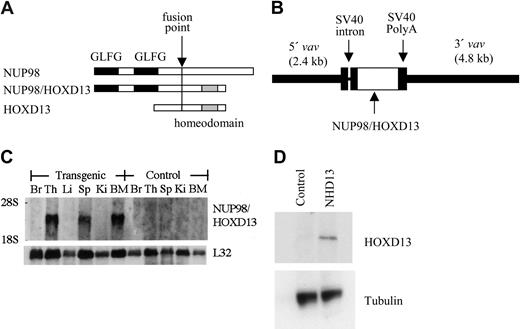
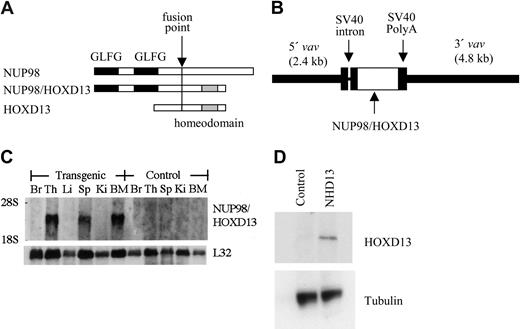
The NUP98-HOXD13 (hereafter NHD13) fusion cDNA consisted of the amino-terminal region of NUP98 fused to the homeodomain of HOXD13, as previously described (Figure 1A).10 This NHD13 cDNA was cloned into the HS21/45-vav vector.22,23 A fragment containing 5′ and 3′ vav regulatory sequences and the NHD13 cDNA was subsequently isolated by a partial HindIII digest and cloned into the HindIII site of pZeoSV2 (Invitrogen, Carlsbad, CA); this plasmid was designated pZVNHD13. All cloning junctions were sequenced to verify the construct. The pZVNHD13 plasmid (Figure 1B) was digested with PmeI, and the insert containing 5′ and 3′ vav regulatory elements and the NHD13 cDNA was purified from the plasmid backbone by agarose gel electrophoresis and Qiagen (Valencia, CA) gel purification, using the manufacturer's recommendations. The construct was microinjected into zygotes obtained from FVB/N or C57Bl6 mice. Founders were identified by Southern blot analysis using a human NUP98 probe; offspring were genotyped by polymerase chain reaction (PCR) amplification of the NHD13 transgene from tail biopsy DNA. Lines were maintained by mating with wild-type FVB/N or C57Bl6, respectively.
Generation of NUP98-HOXD13 (NHD13) transgenic mice. (A) Schematic of NHD13 fusion. The fusion point, NUP98 GLFG repeats, and HOXD13 homeodomain are indicated. (B) Construct used for pronuclear injection. The 5′ and 3′ vav regulatory elements, simian virus 40 (SV40) intron and polyadenylation signal, and NHD13 fusion cDNA are indicated. (C) Northern blot analysis of NHD13 expression. (Top) Human NUP98 probe and (bottom) L32 probe (used as an RNA-loading control). Br indicates brain; Th, thymus; Li, liver; Sp, spleen; Ki, kidney; BM, bone marrow. (D) Western blot of lysates from control and NHD13 transgenic thymocytes. A 53 kDa band is seen only in the transgenic thymocytes. The blot was reprobed with tubulin as a loading control.
Generation of NUP98-HOXD13 (NHD13) transgenic mice. (A) Schematic of NHD13 fusion. The fusion point, NUP98 GLFG repeats, and HOXD13 homeodomain are indicated. (B) Construct used for pronuclear injection. The 5′ and 3′ vav regulatory elements, simian virus 40 (SV40) intron and polyadenylation signal, and NHD13 fusion cDNA are indicated. (C) Northern blot analysis of NHD13 expression. (Top) Human NUP98 probe and (bottom) L32 probe (used as an RNA-loading control). Br indicates brain; Th, thymus; Li, liver; Sp, spleen; Ki, kidney; BM, bone marrow. (D) Western blot of lysates from control and NHD13 transgenic thymocytes. A 53 kDa band is seen only in the transgenic thymocytes. The blot was reprobed with tubulin as a loading control.
Expression of the NHD13 transgene
Expression of the NHD13 transgene was determined by Northern blot analysis. Total RNA was isolated from brain, thymus, liver, spleen, kidney, and bone marrow of mice using Trizol reagent (Invitrogen). Total RNA (10 μg) was size-fractionated on a 1% agarose/formaldehyde gel, transferred to a nitrocellulose membrane (Schleicher & Schuell, Keene, NH), and hybridized with a 32P-labeled human NUP98 probe (1.25RH).
Evaluation of clinically healthy mice
Peripheral blood was obtained from the tail vein using di-potassium EDTA (ethylenediaminetetraacetic acid) salt as an anticoagulant, and complete blood counts (CBCs) were determined using a HEMAVET Multispecies Hematology Analyzer (CDC Technologies, Oxford, CT). Statistical analysis of these CBCs was assessed by the Mann-Whitney U test. Morphology of the peripheral blood was evaluated using May-Grünwald-Giemsa (MGG) staining of air-dried smears. Genomic DNA was isolated from bone marrow cells obtained by flushing the femurs and tibiae of killed mice. Undigested genomic DNA was size-fractionated on a 0.8% agarose gel and stained with ethidium bromide to assess oligo-nucleosomal degradation. To investigate the repopulating potential of hematopoietic cells, 1 × 10⁴ bone marrow cells were plated onto 35-mm Petri dishes in Methocult M3434 methylcellulose medium (Stem Cell Technologies, Vancourver, BC) supplemented with cytokines (50 ng/mL recombinant mouse stem-cell factor [SCF], 10 ng/mL recombinant mouse interleukin-3 [IL-3], 10 ng/mL recombinant human interleukin-6 [IL-6], and 3 U/mL recombinant human erythropoietin [Epo]) and were incubated at 37°C in a 5% CO2 incubator. Colonies were enumerated (up to 300 colonies per 35-mm dish) after 7 to 10 days and harvested, and 1 × 10⁴ cells were replated in the same fashion.
Western blot analysis
Cell extracts were prepared by lysing tissue samples in HNTG buffer (50 mM HEPES (N-2-hydroxyethylpiperazine-N′-2-ethanesulfonic acid) pH 7.4, 150 mM NaCl, 1% Triton X-100, 10% glycerol, supplemented with Protease Inhibitor Cocktail (Sigma, St Louis, MO) for 1 hour. Whole cell lysate (40 μg) was separated on an 8% Tris (tris(hydroxymethyl)aminomethane)-Glycine Gel (Invitrogen) at 125 V for 90 minutes and then transferred to a nitrocellulose membrane. Membranes were blocked for 1 hour in Blotto (Pierce, Rockford, IL) and placed in appropriate primary antibody dilution (in TBS (tris-buffered saline), 5% Blotto, 2.5% Tween 20). Primary antibody was detected using horseradish peroxidase-linked goat anti-mouse or goat anti-rabbit immunoglobulin G (IgG) antibodies and visualized using the chemiluminescent detection system (Supersignal; Pierce). Polyclonal antisera were generated to a HOXD13 peptide (CRRVKDK-KIVSKLKDTVS) by Research Genetics (Huntsville, AL) and affinity purified using standard techniques.
Histologic analysis and immunophenotype
Hematoxylin-eosin (H&E), periodic acid Schiff (PAS), CD3 (DAKO, Carpinteria, CA), B220 (CD45R; Pharmingen, San Diego, CA), anti-myeloperoxidase (MPO; DAKO), F4/80 (Caltag, San Francisco, CA), and CD41 (Pharmingen) stained sections from tissues such as thymus, lymph nodes, spleen, liver, kidney, lung, and tibia were evaluated using conventional staining techniques. Bone marrow cells were harvested from both femurs by flushing with Iscoves media and assessed by both MGG-stained smears and cytospins. Bone marrow slides were evaluated in a blinded fashion, with mouse identification numbers covered with tape and coded with random letters. Two-color flow cytometry was used to determine the immunophenotype of single-cell suspension prepared from thymus, spleen, and/or bone marrow. The cells were stained with fluorescein isothiocyanate (FITC)-conjugated anti-mouse CD8, B220, Gr-1, and c-kit and phycoerythrin (PE)-conjugated anti-mouse CD4, IgM, Mac-1, and ScaI (Pharmingen). Diseases were classified according to the Bethesda proposals.24,25
Photomicrographs were taken with a Fuji FinePix 6800Z camera and Fuji acquisition software (Fuji, Tokyo, Japan) with a Carl Zeiss Standard 25 ICS microscope and a custom eyepiece adaptor (Accuscope, Frederick, MD). All original magnifications were either 100 × or 400 ×.
Southern blot analysis for TCRB gene rearrangements
Genomic DNA was isolated from mouse bone marrow or tissue as previously described26 and digested with either HindIII or SstI. Digested DNA was size-fractionated on a 0.8% agarose gel, denatured, neutralized, and transferred to a nitrocellulose membrane. The nitrocellulose membrane was hybridized to a 32P-labeled 0.4-kb TCRB probe that detects constant region of mouse Tcrb2 gene.
Gene expression profiling
RNA was isolated from liver infiltrated with hematopoietic cells and compared with reference RNA obtained from the liver of a healthy nontransgenic littermate. Both RNAs were isolated using the Trizol reagent and purified using the Qiagen RNeasy mini kit. First strand cDNA was synthesized and dye-coupled using a FairPlay Microarray labeling kit (Stratagene, La Jolla, CA). The experimental cDNA probe was labeled with carbocyanine 3 (Cy3), and the reference cDNA probe was labeled with Cy5. Purification of the dye-coupled cDNA was done using a Qiagen Mini Elute PCR purification kit. The Cy3-labeled experimental probe was combined with the Cy5-labeled reference probe, and the mixture was hybridized to a National Cancer Institute (NCI) production oligo DNA microarray containing 22 272 long oligo (70 mer) features (Compugen, San Jose, CA). The microarray was scanned using an Axon (Foster City, CA) GenePix scanner. The fluorescence ratio was quantified for each transcript and reflected the relative abundance of the gene in the experimental mRNA sample compared with the reference mRNA. The use of a normal liver RNA as a reference probe allowed us to detect genes abnormally expressed in liver infiltrated with leukemic cells.
Semiquantitative RT-PCR assay for Meis1
RNAs were isolated from bone marrows, and 1 μg RNA was reverse transcribed using Superscript II reverse transcriptase (RT) with oligo (dT, deoxythymidine) primer (Invitrogen). Aliquots of serial dilution (1:10, 1:100, and 1:1000) of the first strand cDNAs were amplified with mouse Meis1a primers (5′-TGGGGGTATGGATGGAGTAG-3′ and 5′-AGCGTGAATGTCCATGCCATGACTT-3′) or mouse β-actin primers (5′-GTGGGCCGCTCTAGGCACCAA-3′ and 5′-CTCTTTGATGTCACGCACGATTTC-3′) in the volume of 20 μL. After a “hot start” at 94°C, 30 cycles of 94°C for 30 seconds, 64°C for 30 seconds, and 72°C for 2 minutes were used, followed by a terminal 10-minute extension at 72°C. PCR products were analyzed by agarose gel electrophoresis and quantified using the software NIH Image 1.62 (National Institutes of Health, http://rsb.info.nih.gov/nih-image/).
TPA-induced differentiation
K562 cells were transfected with either an NHD13 expression vector (pVNHD13) or an empty vector (pSV2Zeo) using electroporation. Stable transfectants were isolated by limiting dilution. The K562 transfectants were treated with 10 nM TPA (12-O-tetradecanoylphorbol-13-acetate) for 48 hours, and morphology and protein kinase C ϵ (PKC-ϵ) expression were examined. Differentiating cells were defined as having more than 3 nuclei.27 The expression of PKC-ϵ was compared by means of RT-PCR.28 RNAs were isolated using Trizol reagent (Invitrogen) and 1 μg RNA was reverse transcribed using Superscript II reverse transcriptase with oligo (dT) primer (Invitrogen). Aliquots of the first strand cDNAs were amplified with PKC-ϵ primers (5′-TCAATGGCCTTCTTAAGATCAAAA-3′ and 5′-CCTGAGAGATCGATGATCACATAC-3′). The amplification profile consisted of incubation at 94°C for 5 minutes followed by 25 cycles of 94°C for 1 minute, 57°C for 2 minutes, and 72°C for 1 minute and a final cycle of 94°C for 1 minute, 57°C for 2 minutes, and 72°C for 10 minutes. β-Actin mRNA was amplified as a control with primers (5′-AGGCCGGCTTCGCGGGCGAC-3′ and 5′-CTCGGGAGCCACACGCAGCTC-3′). The amplification profile consisted of incubation at 94°C for 5 minutes followed by 20 cycles of 95°C for 1 minute, 58°C for 1 minute, and 72°C for 1 minute and a final cycle of 95°C for 1 minute, 58°C for 1 minute, and 72°C for 10 minutes. PCR products were size-fractionated on a 1.4% agarose gel and quantified using NIH Image 1.62 software. The expression of PKC-ϵ was normalized to the expression of β-actin.
Results
NHD13 mice develop an MDS that progresses to acute leukemia
To generate genetically identical mice that expressed the NHD13 transgene specifically in hematopoietic tissues, we cloned the NHD13 fusion cDNA into the HS21/45-vav vector23 (Figure 1). This vector uses 5′ and 3′ vav regulatory elements to direct expression of cDNA inserts specifically in hematopoietic tissues. Transgenic NHD13 mice were generated on an FVB/N background by pronuclear injection. Five potential founders, all male, were identified. One of these (mouse no. L7) was noted to be tachypneic and moribund at 3 months of age and was killed; the remaining 4 were mated to FVB/N females. Only 1 of these 4 mice (founder C1) transmitted the transgene; the other 3 potential founders did not transmit the transgene. As anticipated, the NHD13 transgene was expressed in hematopoietic tissues such as thymus, spleen, and bone marrow and was not expressed in nonhematopoietic tissues such as brain, liver, and kidney (Figure 1C). Western blot analysis (Figure 1D) demonstrated a NHD13 protein at the expected size of 53 kDa in thymocytes from the transgenic mouse but not from a control littermate.
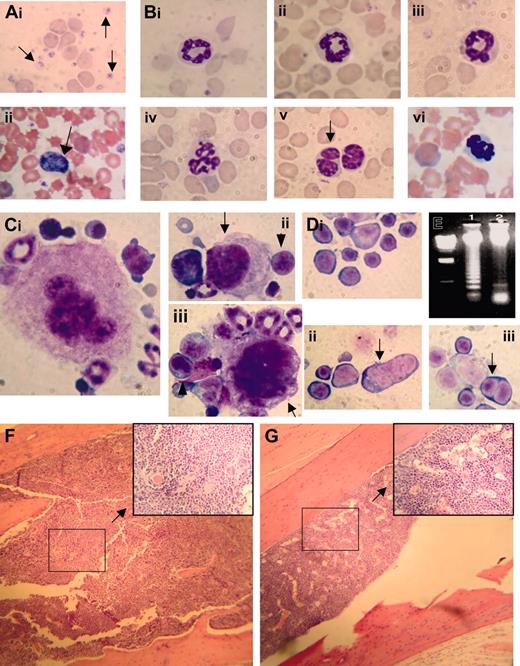
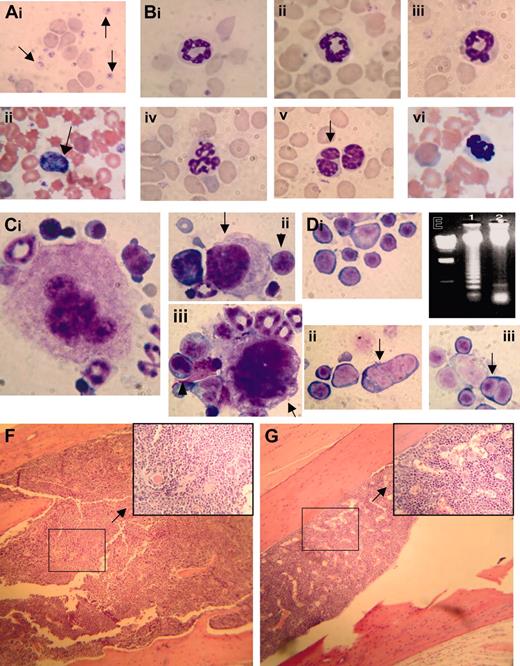
CBCs obtained from clinically healthy transgenic mice aged 4 to 7 months showed marked, highly reproducible abnormalities (leukopenia and anemia) compared with littermate controls (Table 1). Although the difference in mean red-cell volume (MCV) between clinically healthy transgenic mice and control littermates was not statistically significant, there was a trend toward increased MCV in the NHD13 transgenic mice, and several mice had markedly elevated MCV (> 60.0 fL in 4 mice). The elevated MCV reflects a macrocytosis that is consistent with dyserythropoiesis, among other conditions. Examination of the peripheral blood smear from the transgenic mice showed polychromasia, anisocytosis, poikilocytosis, circulating nucleated red blood cells (NRBCs), giant platelets, and hypersegmented neutrophils (Figure 2A-B).
Since these CBC findings were consistent with MDS, we killed 5 clinically healthy transgenic mice aged 5 months (nos. 1067, 1074, 1091, 1101, and 1103) and 5 healthy nontransgenic control mice (nos. 1093, 1094, 1096, 2749, and 1098) to determine whether the NHD13 mice had evidence of MDS in the bone marrow. The bone marrow from the NHD13 transgenic mice was normocellular to hypercellular (total number of nucleated cells obtained from the femur and tibia of 2 transgenic mice [nos. 1067 and 1074, respectively] was 60 × 106 and 45 × 106, total number of nucleated cells from 2 age-matched nontransgenic mice [nos. 2745 and 2749] was 21 × 106 and 23 × 106; see Figure 2), dysplastic, and showed an oligonucleosomal ladder, indicating excessive apoptosis (Figure 2E). Bone marrow from the transgenic mice contained 12% to 17% blasts (mean, 14.1% ± 1.9%) with 11% to 16% (mean, 12.8% ± 2.1%) dyspoietic erythroid cells (Figure 2D) and 4.1% to 7.7% (mean, 6.0% ± 1.3%) dyspoietic myeloid cells; dysplastic megakaryocytes (Figure 2C) were rare. In contrast, the bone marrow from the nontransgenic control mice contained 3.5% to 9.0% blasts (mean, 5.6% ± 1.8%) with 0.7% to 3.2% (mean, 1.5% ± 0.9%) dyspoietic erythroid cells and 0.8% to 3.3% (mean, 1.8% ± 1.0%) dyspoietic myeloid cells. The findings of peripheral blood cytopenia and dysplasia with a normocellular to hypercellular bone marrow (Figure 2F-G), in the absence of an acute leukemia, meets the diagnostic criteria for MDS24,29,30 ; this diagnosis is reinforced by the presence of increased apoptosis in the bone marrow.
Myelodysplastic syndrome in NHD13 transgenic mice. (Ai) MGG-stained peripheral blood smear from control nontransgenic mouse no. 1094; normal platelets are indicated with an arrow. (ii) MGG-stained peripheral blood from mouse no. 1145 showing a giant platelet (arrow), polychromasia, and poikilocytosis. (B) High-power view of normal (i-ii, mouse no. 1093; iii, mouse no. 1094) and transgenic (iv, mouse no. 1101; v, mouse no. 1103; vi, mouse no. 1145) neutrophils stained with MGG; note hypersegmented neutrophils in iv and vi, and a pseudo-Pelger-Huet anomaly in v. (Ci) A normal megakaryocyte in bone marrow from nontransgenic control mouse (no. 1093). (ii-iii) Dysplastic megakaryocytes (arrows) from NHD13 transgenic mouse (no. 1101) showing hypolobulated nuclei and increased nuclear-cytoplasmic ratio. Erythroblasts with clefted nuclei are also seen, indicated with arrowheads. (Di) Normal erythroid precursors from a control, nontransgenic mouse (no. 1094). (ii-iii) Dysplastic, multinucleated erythroblasts (indicated with arrows) from NHD13 mice (nos. 1101 and 1145). (E) Agarose gel electrophoresis of genomic DNA isolated from transgenic (mouse no. 1103, lane 1) or nontransgenic (mouse no. 1093, lane 2) mouse bone marrow. Size standard (far left lane) is HindIII-digested λ-phage DNA. (F-G) Low-power and (inset) high-power view of H&E-stained bone marrow from NHD13 transgenic (F, mouse no. 1103) and nontransgenic control (G, mouse no. 1094).
Myelodysplastic syndrome in NHD13 transgenic mice. (Ai) MGG-stained peripheral blood smear from control nontransgenic mouse no. 1094; normal platelets are indicated with an arrow. (ii) MGG-stained peripheral blood from mouse no. 1145 showing a giant platelet (arrow), polychromasia, and poikilocytosis. (B) High-power view of normal (i-ii, mouse no. 1093; iii, mouse no. 1094) and transgenic (iv, mouse no. 1101; v, mouse no. 1103; vi, mouse no. 1145) neutrophils stained with MGG; note hypersegmented neutrophils in iv and vi, and a pseudo-Pelger-Huet anomaly in v. (Ci) A normal megakaryocyte in bone marrow from nontransgenic control mouse (no. 1093). (ii-iii) Dysplastic megakaryocytes (arrows) from NHD13 transgenic mouse (no. 1101) showing hypolobulated nuclei and increased nuclear-cytoplasmic ratio. Erythroblasts with clefted nuclei are also seen, indicated with arrowheads. (Di) Normal erythroid precursors from a control, nontransgenic mouse (no. 1094). (ii-iii) Dysplastic, multinucleated erythroblasts (indicated with arrows) from NHD13 mice (nos. 1101 and 1145). (E) Agarose gel electrophoresis of genomic DNA isolated from transgenic (mouse no. 1103, lane 1) or nontransgenic (mouse no. 1093, lane 2) mouse bone marrow. Size standard (far left lane) is HindIII-digested λ-phage DNA. (F-G) Low-power and (inset) high-power view of H&E-stained bone marrow from NHD13 transgenic (F, mouse no. 1103) and nontransgenic control (G, mouse no. 1094).
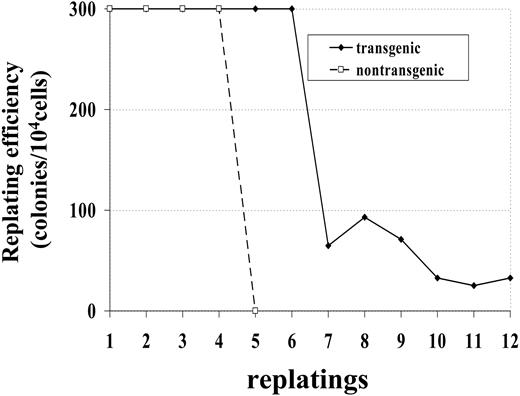
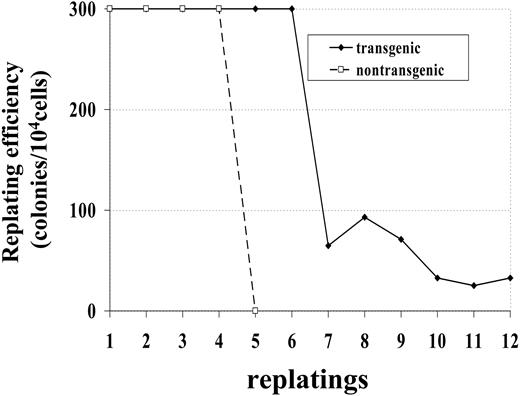
Bone marrow cells from a control (no. 1094) and transgenic (no. 1101) mouse were maintained in methylcellulose culture in the presence of IL-3, SCF, IL-6, and Epo. Whereas the bone marrow cells from control mice died after 4 replatings, bone marrow cells obtained from transgenic mice survived more than 12 replatings (Figure 3). This experiment was repeated with bone marrow obtained from 2 additional mice; similar to the first experiment, bone marrow from the nontransgenic mouse (no. 1093) survived 4 replatings, while bone marrow from the transgenic mouse (no. 1101) was replated 8 times, at which point the experiment was ended. These results indicate that bone marrow cells expressing the NHD13 fusion had increased proliferative potential compared with bone marrow cells from nontransgenic littermates.
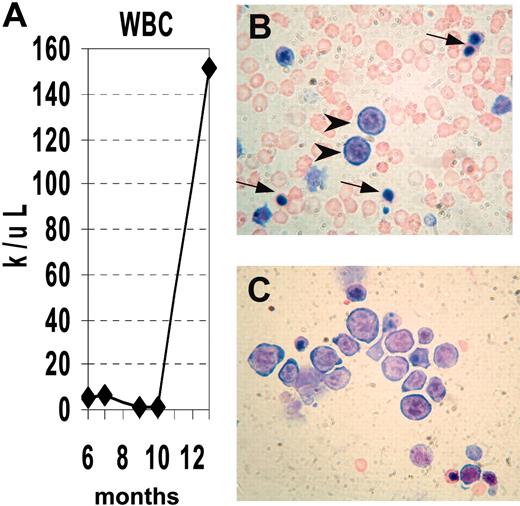
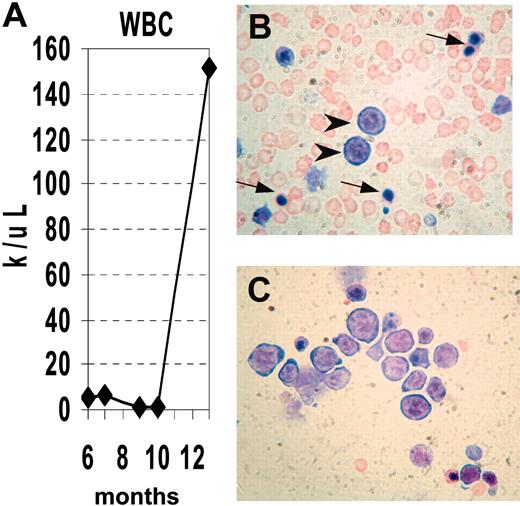
We obtained serial CBCs from several NHD13 mice (Supplemental Table S1, available at the Blood website; see the Supplemental Materials link at the top of the online article). Similar to the situation seen in human MDS, the disease progressed to an acute leukemia in a subset of mice. Mouse no. 1018 had a normal CBC at 6 months of age, but CBCs at 10 and 11 months of age were consistent with MDS, showing anemia, neutropenia, macrocytosis, and giant platelets. (Figure 4). At 13 months of age, the mouse was noted to be lethargic. A CBC at that time showed a markedly elevated white blood cell (WBC) count with progressive anemia, and the peripheral blood smear showed circulating erythroblasts and NRBCs; the bone marrow was replaced by erythroblasts (Figure 4B-C).
NHD13 mice develop a wide spectrum of hematologic malignancies
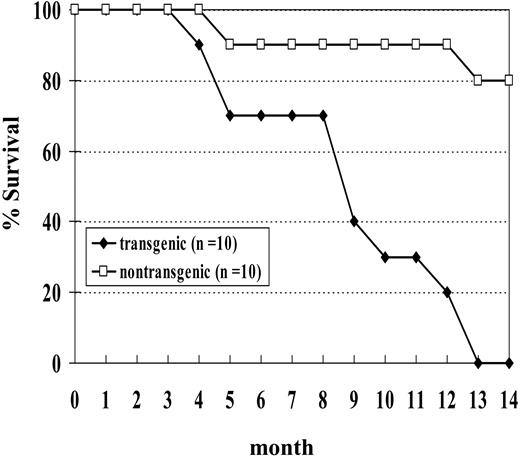
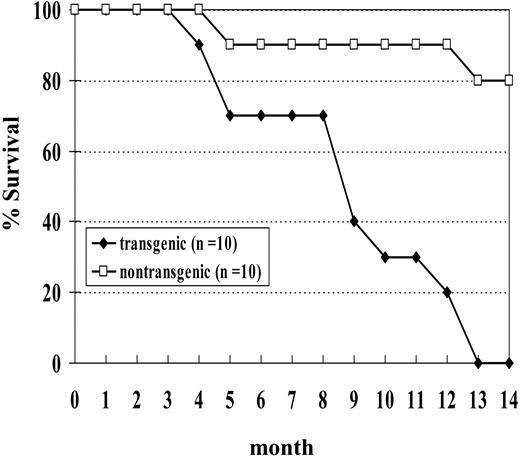
We initially studied a cohort of 10 transgenic and 10 nontransgenic mice; none of the transgenic mice from this cohort survived beyond 14 months of age (Figure 5). Necropsy of these mice showed a wide spectrum of hematologic malignancy, including MDS, megakaryocytic leukemia, erythroid leukemia, undifferentiated leukemia, myeloid leukemia with maturation, and pre-T LBL (Table 2). Two of the mice (nos. 1145 and 1903) in this cohort died with severe MDS and without evidence of transformation to acute leukemia. Both of these mice were anemic and neutropenic, with abnormal peripheral blood findings, including polychromasia, poikilocytosis, and circulating erythroblasts. One (no. 1145) of these was killed at the age of 5 months because of severe anemia (Hb, 40.0 g/L [4.0 g/dL]). This mouse had 9% myeloblasts in the bone marrow and dysplastic cells in multiple lineages, including abnormal erythroblasts characterized by binucleate erythroblasts, hypersegmented neutrophils, and hypolobulated megakaryocytes. The second mouse (no. 1903) was killed when it was noted to be moribund and had a large abscess on the left eyelid. This mouse had 11% myeloblasts in the bone marrow as well as dysplastic, binucleate erythroblasts.
Increased replating potential of NHD13 bone marrow. Bone marrow was obtained from 1 transgenic (no. 1101) and 1 nontransgenic (no. 1094) mouse. Dishes with more than 300 colonies were scored as 300 colonies.
Increased replating potential of NHD13 bone marrow. Bone marrow was obtained from 1 transgenic (no. 1101) and 1 nontransgenic (no. 1094) mouse. Dishes with more than 300 colonies were scored as 300 colonies.
Progression of MDS to acute leukemia. (A) Serial analysis of WBC counts from mouse no. 1018. Note initially normal count, followed by marked leukopenia, terminating with leukocytosis. (B) Peripheral blood showing erythroblasts (arrowheads) and nucleated RBCs (arrows). (C) Bone marrow replaced by erythroblasts, stained with MGG.
Progression of MDS to acute leukemia. (A) Serial analysis of WBC counts from mouse no. 1018. Note initially normal count, followed by marked leukopenia, terminating with leukocytosis. (B) Peripheral blood showing erythroblasts (arrowheads) and nucleated RBCs (arrows). (C) Bone marrow replaced by erythroblasts, stained with MGG.
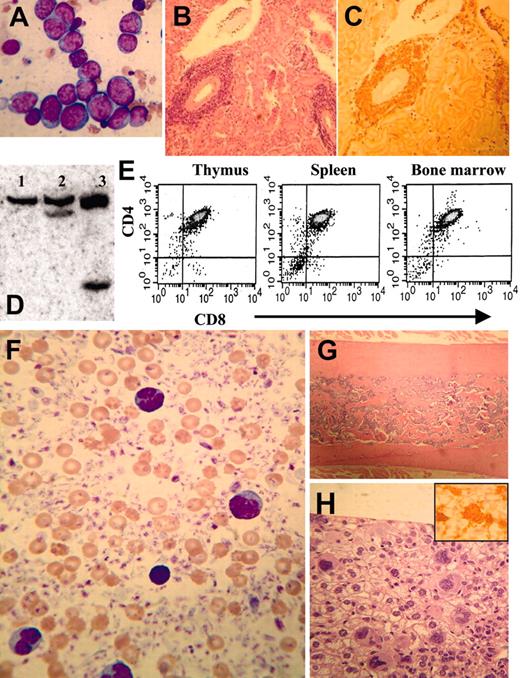
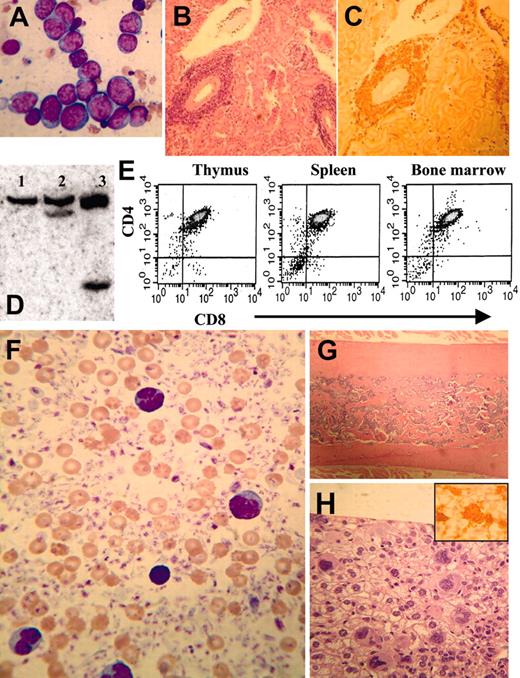
Two mice (nos. 1019 and 1897) had an undifferentiated leukemia, with marked infiltration of the liver, spleen, or both with malignant blasts. Immunohistochemical staining indicated that the blasts infiltrating the liver were negative for CD3, B220, F4/80, PAS, and MPO. Three mice developed a pre-T LBL (nos. 1018, 1149, and 1901; Figure 6A-E) that was similar to the human disease in terms of immunophenotype, organ infiltration, and clonality as evidenced by TCRB gene rearrangements.
Mouse no. 1017 had a dramatically elevated platelet count (> 3500 × 109/L by Coulter counter, estimated as 15 000 × 109/L by manual count) with numerous giant platelets, circulating megakaryoblasts, and widespread megakaryocytic organ infiltration (Figure 6F-H). The bone marrow was sclerotic, and a CBC obtained 3 months prior to death showed a platelet count of 3200 × 109/L. These findings suggest that the thrombocytosis was long-standing and that the osteosclerosis may have been a reaction to chronic thrombocytosis, similar to that seen in patients with chronic idiopathic myelofibrosis (CIMF).31,32 Since prior CBCs from this mouse had shown leukopenia and mild anemia, we think it is likely that this mouse had an MDS that progressed to a chronic megakaryocytic proliferation resembling CIMF, before ultimately transforming to a megakaryoblastic leukemia.
Mouse no. 1018 developed both pre-T LBL and erythroid leukemia. This mouse had a preceding MDS, characterized by leukopenia, anemia, polychromasia, and hypersegmented neutrophils and was killed at 13 months of age when noted to be lethargic. The CBC at this time showed an elevated WBC count of 151.1 × 10⁹/L, with circulating blasts. Necropsy revealed a markedly enlarged thymus and hepatosplenomegaly. Surprisingly, the malignant blasts in the peripheral blood and bone marrow did not appear to be lymphoblasts by MGG staining (Supplemental Figure S1), and the liver and spleen were infiltrated with malignant cells that were negative for CD3 (Supplemental Figure S1C-D). However, the thymus was strongly CD3+, as was a population of cells infiltrating the lung (Supplemental Figure S1E-F). Consistent with the CD3 staining, clonal TCRB gene rearrangements were detected in thymus and lung, but not in liver, kidney, or spleen (Figure Supplemental Figure S1G). We concluded that the cells invading the bone marrow, liver, and spleen were distinct from the malignant T lymphoblasts invading the thymus and lung. These cells morphologically appeared to be erythroblasts; this interpretation is supported by the observation that they did not stain for CD3, B220, MPO, CD41, or F4/80. To better characterize the malignant cells that had invaded the liver, we compared the gene expression profile of the invaded liver with that of a normal liver using a 2-color microarray assay. A large number of genes typically expressed in erythroid precursors (LMO2, Eraf, HbbY, EpoR, and glycophorin A) were more than 8-fold elevated in the invaded liver compared with normal liver, supporting the diagnosis of an erythroid leukemia. In sum, the thymus and lung were infiltrated with malignant T cells, whereas the bone marrow, liver, spleen, and kidney were infiltrated with malignant erythroid precursors.
As noted previously, one of the potential founders, mouse L7, was positive for the NHD13 transgene by tail biopsy and was killed at the age of 3 months because of tachypnea and severe lethargy. Although the CBC from this mouse was only mildly abnormal (WBC count, 2.0 × 10⁹/L; Hb, 133 g/L [13.3 g/dL]; platelets, 688 × 109/L; and MCV, 57.0 fL), necropsy revealed a massively enlarged thymus and generalized lymphadenopathy. The malignant blasts expressed NHD13 and were positive for CD3; Southern blot analysis showed a monoclonal TCRB gene rearrangement. We conclude that this mouse had developed a pre-T LBL.
Expression of NHD13 generates a similar phenotype in a C57Bl6 background
Since the results we described in the previous section were based primarily on offspring of a single founder, we generated additional transgenic lines to rule out the possibility that the malignancies we saw were due to an insertional effect of the transgene. We chose to inject the construct into fertilized C57Bl6 embryos to investigate whether the leukemogenic effect of the transgene was strain specific. We obtained one founder (designated G2) that transmitted the transgene. The expression of the transgene was again restricted to hematopoietic tissues (Supplemental Figure S2). Similar to the situation seen with NHD13 mice generated on an FVB/N background, these mice showed peripheral blood cytopenias and dysplasia that, in a subset of mice, transformed to acute leukemia. At 14 months of age, 17 of 20 (85%) C57Bl6 mice positive for the transgene have developed a hematologic malignancy or been found dead, while only 1 of 14 nontransgenic littermates has been found dead (Supplemental Figure S2).
Survival curve of NHD13 transgenic mice. Mice were observed for 14 months. Two nontransgenic control mice were found dead without signs of acute leukemia.
Survival curve of NHD13 transgenic mice. Mice were observed for 14 months. Two nontransgenic control mice were found dead without signs of acute leukemia.
Pre-T (mice nos. 1149 and 1901) or megakaryocytic (mouse no. 1017) leukemia in NHD13 transgenic mice. (A) Bone marrow from mouse no. 1901 infiltrated with lymphoblasts characterized by high nuclear-cytoplasmic ratio, variably condensed nuclear chromatin, and prominent nucleoli, stained with MGG. (B-C) Perivascular infiltration of kidney from mouse no. 1901 with lymphoblasts, stained with H&E (B) or anti-CD3 (C). (D) Genomic DNA from control (lane 1) or pre-T LBL (mice nos. 1149 and 1901, lanes 2-3) mice digested with SstI and hybridized to a T-cell receptor β (TCRβ) probe. Clonal rearrangements are indicated with arrows. (E) Cells from mouse no. 1901 with pre-T LBL (thymus, spleen, and bone marrow) were stained with CD4 and CD8 and analyzed by fluorescence activated cell sorting (FACS). (F) Peripheral blood (from mouse no. 1017) smear showing dramatically increased platelet count, giant platelets, and megakaryoblasts, stained with MGG. (G) Osteosclerotic bone marrow (from mouse no. 1017) stained with H&E. (H) Liver infiltrated with megakaryocytes and megakaryoblasts, stained with H&E (inset, × 400) or anti-CD41.
Pre-T (mice nos. 1149 and 1901) or megakaryocytic (mouse no. 1017) leukemia in NHD13 transgenic mice. (A) Bone marrow from mouse no. 1901 infiltrated with lymphoblasts characterized by high nuclear-cytoplasmic ratio, variably condensed nuclear chromatin, and prominent nucleoli, stained with MGG. (B-C) Perivascular infiltration of kidney from mouse no. 1901 with lymphoblasts, stained with H&E (B) or anti-CD3 (C). (D) Genomic DNA from control (lane 1) or pre-T LBL (mice nos. 1149 and 1901, lanes 2-3) mice digested with SstI and hybridized to a T-cell receptor β (TCRβ) probe. Clonal rearrangements are indicated with arrows. (E) Cells from mouse no. 1901 with pre-T LBL (thymus, spleen, and bone marrow) were stained with CD4 and CD8 and analyzed by fluorescence activated cell sorting (FACS). (F) Peripheral blood (from mouse no. 1017) smear showing dramatically increased platelet count, giant platelets, and megakaryoblasts, stained with MGG. (G) Osteosclerotic bone marrow (from mouse no. 1017) stained with H&E. (H) Liver infiltrated with megakaryocytes and megakaryoblasts, stained with H&E (inset, × 400) or anti-CD41.
The clinical, morphologic, and immunohistochemical data from transgenic NHD13 mice generated on a C57Bl6 background were largely similar to that seen with the offspring of the C1 founder described above (Table 3). Clinically healthy mice aged 4 to 7 months showed peripheral blood cytopenias (WBC count, 2.3 ± 0.7 × 10⁹/L; neutrophils, 0.26 ± 0.13 × 10⁹/L; lymphocytes, 1.8 ± 0.55 × 10⁹/L; and Hb, 118 ± 16.0 g/L [11.8 ± 1.6 g/dL]; n = 14), compared with values for nontransgenic control littermates (12.3 ± 2.0 × 10⁹/L, 2.2 ± 0.4 × 10⁹/L, 9.4 ± 2.0 × 10⁹/μL, and 146.0 ± 13.0 g/L [14.6 ± 1.3 g/dL], respectively; n = 3). One mouse from this cohort died of progressive MDS, with tachypnea, lethargy, severe anemia (Hb, 48.0 g/L [4.8 g/dL]) and leukopenia (WBC count, 1.58 × 10⁹/L). The peripheral blood smear revealed polychromasia, poikilocytosis, NRBCs, and hypersegmented neutrophils, and the bone marrow had 16.8% blasts, consistent with a diagnosis of MDS-RAEB (refractory anemia with excess blasts). Four mice developed myeloid leukemia with maturation (Supplemental Figure S3), and 3 mice developed an undifferentiated leukemia that was characterized by hepatosplenic infiltration of blasts negative for all antigens and stains tested, including CD3, B220, F4/80, MPO, PAS, and CD41. Two mice developed a typical pre-T LBL that was characterized by infiltration of CD3+, CD4+, and CD8+ lymphoblasts in thymus, spleen, liver, and bone marrow.
In addition to the leukemic subtypes described in the previous section, which were seen in offspring of both the C1 and G2 founders, some G2 mice developed a precursor B lymphoblastic lymphoma/leukemia (pre-B LBL), while still others developed a myeloproliferative disease-like (MPD-like) leukemia (Table 3). A single mouse developed a biphenotypic leukemia. This mouse had thymic enlargement and hepatosplenomegaly, with infiltration of all 3 organs with blasts that were positive for both CD3 and MPO.
Leukemic cells from NHD13 mice express the NHD13 transgene and were immortal
We verified that mice that developed different types of leukemia continued to express the NHD13 transgene (Supplemental Figure S4). In addition, we have been able to establish nonlymphoid leukemia cell lines from 3 mice (nos. 63, 251, and 254), all of which presented with myeloid leukemia with maturation. These cells are Mac1+/Sca-1+/Gr-1lo/c-kit- and have been maintained in Iscoves modified Dulbecco medium (IMDM) and 10% fetal bovine serum (FBS) without supplementary hematopoietic cytokines for more than 18 months (Supplemental Figure S5). A pre-T LBL cell line was established from a mouse with a pre-T LBL (no. 1901) and has been maintained in RPMI1640 and 10% FBS, without supplementary cytokines, for more than 12 months. Finally, similar to the situation seen in mice with MDS, leukemic bone marrow cells can be replated at least 11 passages in methylcellulose supplemented with SCF, IL-3, IL-6, and Epo, while bone marrow cells from normal mice did not survive beyond 4 replatings.
Meis 1 was not up-regulated in NHD13 leukemia
Since it has been shown that Meis1 cooperates with HOXA cluster genes in murine leukemia models,5,33-36 and with NHD13 in a bone marrow transduction/reconstitution model,37 we wondered whether NHD13 might collaborate with Meis1 in this current study. To investigate this question, we compared Meis1 expression from bone marrow of leukemic NHD13 mice with that of nontransgenic littermates by means of semiquantitative RT-PCR. We found there was no difference in Meis1 expression between normal control bone marrow and NHD13 leukemic bone marrow (Supplemental Figure S6).
NHD13 disrupts TPA-induced differentiation of K562 cells
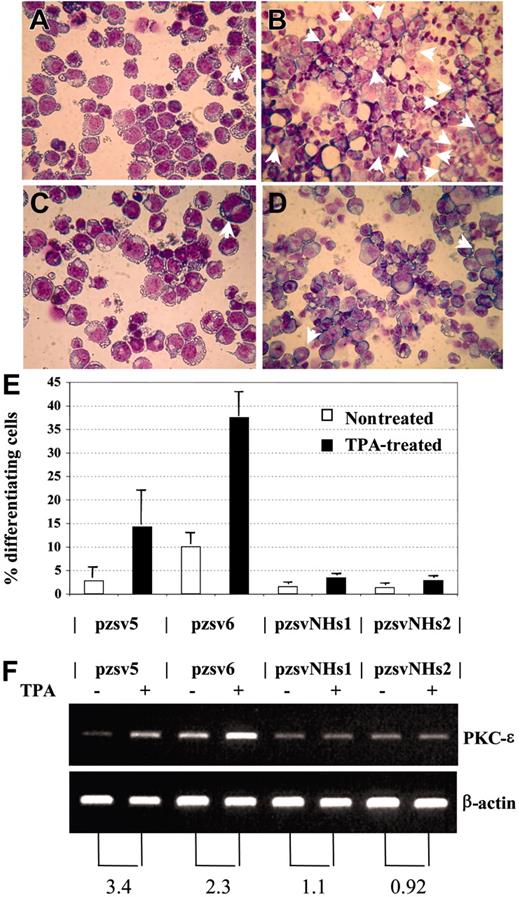
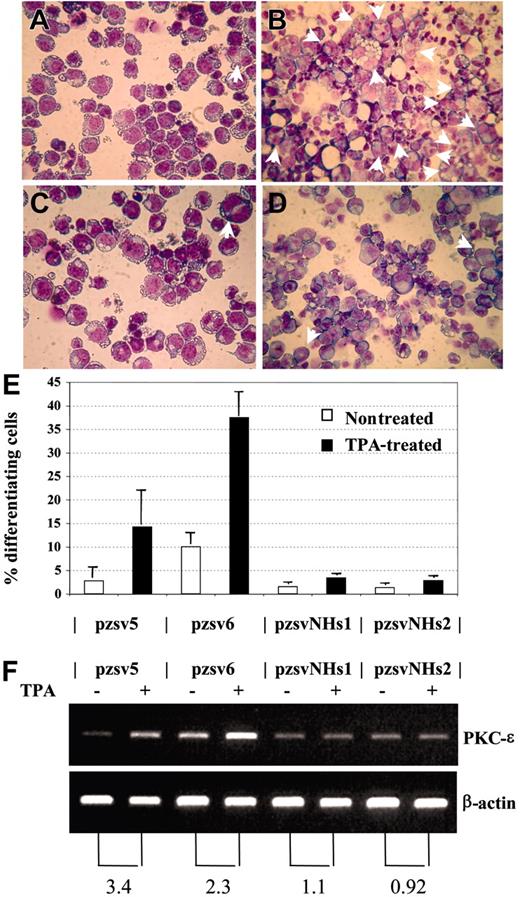
We considered the possibility that NHD13 might cause MDS by inhibiting the normal differentiation of hematopoietic precursors. This hypothesis is supported by the observation that embryonic stem (ES) cells which express NHD13 fail to contribute to the adult animal following blastocyst injection and are impaired in their ability to differentiate to hematopoietic colonies in vitro.38 To investigate the role of NHD13 in hematopoietic differentiation, we studied the effect of NHD13 expression on an established model of megakaryocytic differentiation using the K562 cell line. The K562 cell line has been shown to differentiate into megakaryocytic lineage cells following treatment with 12-0 Tetradecanoylphorbol 13-Acetate (TPA).27,28 We transfected K562 cells with the pVNHD13 expression vector, selected stable clones by limiting dilution, and assayed the stable transfectants for NHD13 mRNA expression. Two clones, K562-pzsvNHs1 and pzsvNHs2, which expressed the NHD13 mRNA, were isolated and compared with 2 control clones that harbored the empty vector (K562-pzsv5 and pzsv6). Upon 48 hours of treatment with 10 nM TPA, the control clones showed clear evidence for megakaryocytic differentiation, as shown by increased numbers of multinucleated cells27 and increased expression of PKC-ϵ,28 whereas the clones that expressed NHD13 showed no increase in either of these 2 assays (Figure 7). Thus, TPA-induced differentiation along the megakaryocytic pathway in K562 cells was inhibited by expression of NHD13.
Discussion
Overtly healthy NHD13 transgenic mice had MDS. This MDS was highly penetrant and reproducible, resembled the human disease in terms of peripheral blood cytopenias and dysplasia, and was characterized by increased apoptosis in the context of a hypercellular or normocellular bone marrow. Furthermore, the clinical course of the disease was similar to human MDS. Some mice remained overtly healthy for an extended observation period with mild-to-moderate cytopenias and dysplasia, and no supportive care. Other mice died of progressively more severe cytopenias, while still others transformed to acute leukemia.
The NHD13 mice developed a wide variety of distinct leukemic subtypes. Nonlymphoid leukemias seen in these mice included myeloid leukemia, erythroid leukemia, megakaryocytic leukemia, undifferentiated leukemia, biphenotypic leukemia, and MPD-like leukemia. Lymphoid leukemias included pre-T LBL and pre-B LBL. The finding of pre-T LBL and, less commonly, pre-B LBL in NHD13 mice was unanticipated, since human MDS only rarely transforms into a lymphoid malignancy,39-41 and since NHD13 fusions have not been identified in human patients with T-cell malignancies. However, it should be noted that other NUP98 fusion genes, such as NUP98-RAP1GDS1 and NUP98-ADD3, have been found in patients with pre-T LBL,15,17 suggesting that expression of NUP98 fusion genes can lead to T-cell malignancies as well as myeloid malignancies. Additionally, one of the NHD13 mice developed both erythroid leukemia and pre-T LBL (Supplemental Figure S1), raising the possibility that the erythroid leukemia had evolved from a preexisting MDS, and the pre-T LBL had originated in the thymus from thymic precursors independent of the MDS clone, and spread to the lung (but not liver or spleen). Moreover, an independent potential NHD13 founder (L7; Supplemental Figure S4) expressed the NHD13 transgene and died at a young age with a pre-T LBL, indicating that the pre-T LBL phenotype was unlikely to be secondary to an integration site effect. Taken together, these findings support the notion that the NHD13 transgene is oncogenic in mouse lymphoid cells as well as myeloid cells.
NHD13 inhibits megakaryocytic differentiation. (A-B) Control transfectant pzsv5, untreated (A) or treated (B) with TPA. Multinucleated cells are indicated with arrows. (C-D) Stable transfectant that expresses NHD13 (pzsvNHs1), either untreated (C) or treated (D) with TPA. (E) Percentage of differentiating cells (mean and SD of 3 independent experiments). Pzsv5 and pzsv6 are control transfectants; pzsvNHs1 and pzsvNHs2 are stable NHD13 transfectants. (F) RT-PCR for PKC-ϵ and β-actin. (Top) PKC-ϵ, (bottom) β-actin. The numbers below the picture indicate the fold increase of PKC-ϵ expression normalized to β-actin expression.
NHD13 inhibits megakaryocytic differentiation. (A-B) Control transfectant pzsv5, untreated (A) or treated (B) with TPA. Multinucleated cells are indicated with arrows. (C-D) Stable transfectant that expresses NHD13 (pzsvNHs1), either untreated (C) or treated (D) with TPA. (E) Percentage of differentiating cells (mean and SD of 3 independent experiments). Pzsv5 and pzsv6 are control transfectants; pzsvNHs1 and pzsvNHs2 are stable NHD13 transfectants. (F) RT-PCR for PKC-ϵ and β-actin. (Top) PKC-ϵ, (bottom) β-actin. The numbers below the picture indicate the fold increase of PKC-ϵ expression normalized to β-actin expression.
It seems likely that the NHD13 transgene exerts its oncogenic effect through the inhibition of normal hematopoietic differentiation. Using an established model of megakaryocytic differentiation, overexpression of an NHD13 cDNA inhibited megakaryocytic differentiation. Moreover, ES cells expressing an NHD13 fusion did not contribute to formation of an adult mouse following blastocyst injection, and NHD13 ES cells were severely impaired in their ability to differentiate in vitro.38 These findings are consistent with those obtained using a similar NUP98 fusion gene, NUP98-HOXA9, which has been shown to induce acute leukemia in concert with BCR-ABL or TEL-PDGFβR.42 In this setting, BCR-ABL or TEL-PDGFRβ conferred a proliferative or survival advantage to the cells, while NUP98-HOXA9 was thought to confer a differentiation block.
Previous reports have shown that mice that received a transplant with syngeneic bone marrow cells that had been transduced with a retroviral NHD13 expression vector developed an MPD, which did not evolve to acute leukemia.37 In that study, coinfection with both NHD13 and Meis1 rapidly induced an aggressive AML 3 months after bone marrow transplantation, demonstrating cooperativity between Meis1 and NHD13.37 Similarly, bone marrow transduced with NUP98-HOXA9 resulted in an MPD that subsequently progressed to AML; this progression could be accelerated by cotransduction of Meis1.36,43 In the present study, the fact that only a subset of mice progressed to acute leukemia, as well as the relatively long latency prior to leukemic transformation, suggests that NHD13 requires cooperative genetic events to produce an acute leukemia. On the basis of the previous retroviral transduction studies, we anticipated that Meis1 might be up-regulated in the leukemic cells; however, semiquantitative RT-PCR indicated that Meis1 was not overexpressed in cells from the leukemic bone marrow compared with cells from the normal bone marrow.
Progress in understanding and treating human MDS has been hampered by a lack of suitable mouse models for this disease; current models either do not transform to acute leukemia,44 or develop an incompletely penetrant, mixed MPD/MDS disease.45 We have now used a fusion gene that is associated with human MDS to develop a mouse model for MDS that faithfully recapitulates all of the key features of the human disease. The model we report here is highly penetrant and reproducible and shows peripheral blood cytopenias, ineffective hematopoiesis with dysplasia, and increased apoptosis in the bone marrow. Moreover, the clinical course resembles that of the human disease in that the MDS progresses to acute leukemia in some, but not all, of the NHD13 transgenic mice. Similar to the human condition, the acute leukemia that develops in NHD13 mice can be myeloid, erythroid, megakaryocytic, or undifferentiated leukemia.
Prepublished online as Blood First Edition Paper, March 8, 2005; DOI 10.1182/blood-2004-12-4794.
Y.-W.L. designed and performed the research, analyzed the data, and wrote the first draft of the paper; C.S. designed and performed the research and analyzed data; Z.Z. performed the research and analyzed data; P.D.A. designed and performed the research, analyzed the data, and wrote the final draft of the paper.
Y.-W.L. and C.S. contributed equally to this study.
The online version of the article contains a data supplement.
The publication costs of this article were defrayed in part by page charge payment. Therefore, and solely to indicate this fact, this article is hereby marked “advertisement” in accordance with 18 U.S.C. section 1734.
We thank our colleagues R. Keith Humphries, Linda Lowe, Du H. Lam, Yue Cheng, and Tamas Varga for discussion, and we thank Du H. Lam and Ramona Deveney for assistance in vector construction. We thank Lionel Feigenbaum of the NCI Transgenic core facility for microinjection and animal husbandry. We thank Jerry Adams (Walter and Eliza Hall Institute) for his kind gift of the pvav vector. We also thank Dr Masue Hayashi for editorial advice and helpful discussion.

