Abstract
We conducted a phase 1/2 study of the combination of 5-aza-2′-deoxycytidine (decitabine) and the histone deacetylase inhibitor valproic acid (VPA) in patients with advanced leukemia, including older untreated patients. A group of 54 patients were treated with a fixed dose of decitabine (15 mg/m2 by IV daily for 10 days) administered concomitantly with escalating doses of VPA orally for 10 days. A 50 mg/kg daily dose of VPA was found to be safe. Twelve (22%) patients had objective response, including 10 (19%) complete remissions (CRs), and 2 (3%) CRs with incomplete platelet recovery (CRp). Among 10 elderly patients with acute myelogenous leukemia or myelodysplastic syndrome, 5 (50%) had a response (4CRs, 1CRp's). Induction mortality was observed in 1 (2%) patient. Major cytogenetic response was documented in 6 of 8 responders. Remission duration was 7.2 months (range, 1.3-12.6+ months). Overall survival was 15.3 months (range, 4.6-20.2+ months) in responders. Transient DNA hypomethylation and global histone H3 and H4 acetylation were induced, and were associated with p15 reactivation. Patients with lower pretreatment levels of p15 methylation had a significantly higher response rate. In summary, this combination of epigenetic therapy in leukemia was safe and active, and was associated with transient reversal of aberrant epigenetic marks. This trial was registered at www.clinicaltrials.gov as #NCT00075010.
Introduction
5-aza-2′-deoxycytidine (decitabine) is a cytosine analog with clinical activity in myelodysplastic syndromes (MDSs)1 and other myeloid leukemias.2,3 Both in vivo and in vitro, decitabine induces global and gene-specific DNA hypomethylation.3,4 DNA methylation is an epigenetic modification of DNA that has a role in the control of gene expression.5 Aberrant DNA methylation of promoter associated CpG islands is frequent in leukemias.6,7 By inactivating genes important for cell function, aberrant DNA methylation is considered a functional equivalent to the genetic disruption of these genes. It is postulated that reversal of abnormal methylation patterns that characterize a significant subset of patients with leukemia6,7 may result in the reactivation of aberrantly silenced genes and in suppression of the malignant leukemic clone. Nucleosome-associated histone tails can undergo several changes in their biochemical composition, including acetylation. The biochemical composition of these tails is associated with specific gene activation states.8 For instance, acetylation of specific residues in histone H3 and H4 is associated with an open chromatin configuration and gene transcription. In contrast, deacetylation of these residues is associated with a repressive state.8 These changes in histone acetylation are mediated by enzymes with histone acetylase and deacetylase activity,9 and are therefore reversible. Inhibition of deacetylase activity results in accumulation of histone acetylation and a permissive gene expression state.10 To exploit this phenomenon clinically, biochemical compounds with histone deacetylase (HDAC) inhibitory activity, of which valproic acid (VPA) is one, are being developed as antineoplastic agents.10 VPA is a short-chained fatty acid used clinically as an antiepileptic and mood stabilizer.11 VPA also inhibits HDAC activity,12,13 and has modest clinical activity in MDS.14,15 DNA methylation of promoter-associated CpG islands and modifications in the biochemical composition of nucleosome-associated histone tails cooperate in the control of gene expression.16 It is it not currently known which alteration is dominant, but in most instances the combination of a hypomethylating agent with an HDAC inhibitor results in enhanced gene reactivation.17 We previously studied the cellular and molecular effects of the combination of decitabine with VPA in leukemia cell lines and demonstrated this combination to have synergistic antileukemia activity in a sequence-independent manner.18 Based on this information, we designed a phase 1/2 clinical trial to evaluate the safety, clinical efficacy, and molecular consequences of the combination of decitabine and VPA in patients with leukemia.
Patients, materials, and methods
Study group eligibility
Criteria differed between the phase 1 and 2 portions of the study. For phase 1, patients with acute or chronic leukemia and MDS were eligible. Phase 2 was restricted to patients with acute myelogenous leukemia (AML) or high-risk MDS (bone marrow blasts ≥ 10%). Untreated patients older than 60 years of age with AML or MDS who refused or were not candidates for front-line chemotherapy were eligible for both phases of the study. Whether a patient was a candidate for intensive chemotherapy was determined by the treating physician after discussion with the patient. Other inclusion criteria were age older than 2 years; performance status of 2 or less (Eastern Cooperative Oncology Group [ECOG] scale), and adequate liver and renal functions. Patients must have been off chemotherapy for 2 weeks prior to entering this study, although the use of hydroxyurea for patients with proliferative disease was allowed in the first 2 weeks on therapy. Patients were asked to continue birth control for the duration of the trial. Nursing and pregnant females were excluded, as well as patients with active and uncontrolled infections, or illnesses, evidence of a history of hepatitis B or C, alcoholic liver disease, or hepatopathy. Patients already receiving VPA were also excluded. All patients signed informed consent following institutional guidelines. Approval was obtained from the University of Texas M. D. Anderson Cancer Center institutional review board (IRB) for these studies.
Treatment
Treatment varied depending on whether a patient was treated in phase 1 or 2 of the study. In both phases, a fixed low dose of decitabine, 15 mg/m2 by IV daily infused over 1 hour for 10 consecutive days, was administered. This dose was selected as the optimal dose in a prior phase 1 study of single-agent decitabine.2 VPA was administered orally in 2 or 3 divided doses (depending on the total dose) daily for 10 days on the same days as decitabine. In phase 1, 3 dose levels of VPA were studied: 20, 35, and 50 mg/kg orally daily for 10 days. The doses of VPA were calculated based on prior data indicating that the optimal dose of single-agent VPA that induces maximal acetylation is around 20 to 30 mg/kg.18 In phase 2, the combination of decitabine and VPA at its maximally tolerated dose (MTD), or the highest dose level possible, was administered. Courses of therapy were repeated not earlier than every 4 weeks. A maximum of 24 courses of therapy were planned. Patients could receive supportive care measures as clinically indicated, including prophylactic antibiotics and antiemetics. Growth factors support was limited to patients with significant neutropenia after therapy.
Response criteria and statistical methods
A complete response (CR) required the disappearance of all signs and symptoms related to disease, normalization of peripheral counts with an absolute neutrophil count of 109/L or higher, platelet count of 100 × 109/L or higher, and a bone marrow with 5% or fewer blasts. A CRp was defined as a CR except for a platelet count increase by 50% to more than 30 × 109/L but less than 100 × 109/L. Remission duration was calculated from date of first response until relapse, and survival from start of therapy until death from any cause.
In phase 1, cohorts of 3 patients were entered at each dose level. If 1 patient developed grade 3 or higher nonhematologic toxicity, 3 more patients were accrued at that dose level. If 2 or more patients developed grade 3 or higher nonhematologic toxicity, the dose of VPA was considered toxic. The MTD was defined as the dose below the one producing dose-limiting toxicity (DLT) in 2 or more of 3 to 6 patients. A total of 10 patients were to be treated at the MTD, or highest dose of VPA. The MTD was based on toxicities during the first course of therapy. Toxicity was graded using the National Cancer Institute Common Toxicity Criteria (NCI CTC version 3).
Phase 2 was designed to evaluate the activity of the combination. The study would stop early if the probability was less than 10% that the response rate (CR + CRp) was at least 0.3. We used data based on an overall response rate of 30% observed in the phase 1 study of single-agent low-dose decitabine in this calculation.2 A maximum of 40 patients could be treated in phase 2. The probability of a patient response was evaluated after every cohort of 10 patients. The study was to stop if responses were 0 of 10, 3 or more of 20, or 5 or less of 30 patients. Otherwise, the study would accrue a maximum of 40 patients. Patients treated during phase 1 of the study at the highest dose of VPA who met criteria for phase 2 were included in the phase 2 analysis.
Groups were compared with the 2-sample t test. In particular, groups were compared with respect to gene methylation by adjusting for baseline methylation of that gene. We anayzed the logarithms of gene methylation levels, since this transformation made the residuals appear more normally distributed. All P values are 2-sided, and we declared statistical significance if the 2-sided P value was below .05. We did not adjust for multiple comparisons.
Cytogenetic analysis
Cytogenetic analysis was performed in the clinical cytogenetics laboratory at our institution. Baseline cytogenetic analysis was performed prior to therapy, and subsequently with each course of therapy when possible in patients with baseline abnormal cytogenetics
Detection of VPA levels
Free and bound VPA levels were measured using commercially available assays. These levels were analyzed on days 0 (prior to therapy), 5, and 10 of each course of therapy.
Isolation of human mononuclear cells
Blood and marrow aspiration specimens from patients and healthy volunteers were drawn into heparin (30 U/mL). Mononuclear cells were separated using Ficoll-Paque PLUS gradient centrifugation (Amersham Biosciences AB, Uppsala, Sweden). The monocyte-enriched cell fraction was collected and washed twice with calcium and magnesium-free phosphate-buffered saline (PBS). After centrifugation, PBS was removed and the samples were immediately frozen at –80°C.
Analysis of DNA methylation
The following loci and genes were analyzed: long interspersed nuclear element (LINE), p57KIP2, p15, p73, MDR1, and THBS2. DNA was extracted from patient samples using standard phenol-chloroform methods. DNA was modified with sodium bisulfite. Methods for bisulfite modification of DNA and subsequent polymerase chain reaction (PCR) techniques used in this study are described on the M. D. Anderson website (http://www3.mdanderson.org/leukemia/methylation), and as previously described.19 Two different bisulfite PCR assays were used depending on the locus analyzed. For p57KIP2, MDR1, and THBS2, the combined restriction analysis (COBRA)20 was used as previously described.7,19 PCR conditions, primer sequences, GenBank sequence numbers, and the restriction enzyme used are shown in Supplemental Table S1 (available at the Blood website; see the Supplemental Tables link at the top of the online article). The proportion of methylated versus unmethylated PCR product (digested vs undigested, respectively) was quantified by densitometric analysis to determine the level of methylation (as a percentage). Densitometric analysis was performed using a BioRad Geldoc 2000 digital analyzer (Hercules, CA) equipped with the Quantity One version 4.0.3 software (BioRad). For the analysis of LINE, p15, and p73 methylation, bisulfite pyrosequencing was used.3 For DNA pyrosequencing, bisulfite-treated DNA was amplified by PCR with primers and conditions shown in Table S2. The degree of methylation was calculated using the PSQ HS 96A 1.2 software (Biotage AB, Uppsala, Sweden). Sequencing primer, sequence analyzed and dispensation orders are shown in Table S3.
Analysis of histone H3, H4 acetylation and DNA methyltransferase (DNMT1)
Histone H3 and H4 acetylation and DNMT1 were analyzed by Western blot using antibodies directed against acetylated histone H3, H4, or DNMT1. Proteins were extracted using a lysis buffer (10 mM HEPES [pH 7.9], 1.5 mM MgCl2, 10 mM KCl, 0.5 mM DTT, and 1 mM PMSF). Protein from each cell lysate (30 μg) were separated in 12% sodium dodecyl sulfate (SDS)–polyacrylamide gels (BioRad) and transferred to Immobilion-P Transfer Membranes (Millipore, Billerica, MA). Membranes were blocked in 3% nonfat milk in PBS containing 0.1% Tween 20 (PBS-T) probed overnight at 4°C with 1:2000 dilution of acetylated histone H3 or H4 antibody (Upstate Biotechnology, Waltham, MA) or DNMT1 antibody (New England Biolabs, Beverly, MA). Membranes were washed 3 times with PBS-T and incubated with an antirabbit peroxidase-conjugated secondary antibody in all experiments (1:2000; Amersham Biosciences, Piscataway, NJ) for 1 hour at room temperature. Membranes were washed 3 times in PBS-T and the film was developed using enhanced chemiluminescence (ECL; Amersham Pharmacia Biotech, Piscataway, NJ). β-Actin (1:5000; Sigma, St Louis, MO) was used as internal control.
Real-time PCR analysis of mRNA gene expression
Total cellular RNA was extracted using Trizol (Invitrogen, Carlsbad, CA). A portion (2-3 μg) of total RNA was used for reverse transcription (RT) reactions using the Moloney murine leukemia virus RT enzyme (Invitrogen).
Levels of p21CIP1 and p15 mRNA expression were analyzed using real-time PCR. Primers and probes were purchased from Applied Biosystems and analyzed using an Applied Biosystems Prism 7000 Sequence Detection System (Applied Biosystems, Foster City, CA). PCR reactions were performed using 20X Assays-On-Demand Gene Expression Assay Mix (contained unlabeled PCR primers and TaqMan probes) and TaqMan Universal PCR Master mix (Applied Biosystems). PCR conditions were 95°C for 10 minutes and then 95°C for 15 seconds and 60°C for 1 minute, repeated for 40 cycles. Experiments were performed in triplicate. Glyceraldehyde-3-phosphate dehydrogenase (GAPDH) was used as internal control. Quantitative values were obtained from the cycle number (CT value) at which the increase in fluorescent signal associated with an exponential accumulation of PCR products was detected. The amount of target gene was normalized to the endogenous reference GAPDH to obtain the relative threshold cycle (ΔCT) and then related to the CT of the control to obtain the relative expression level (2–ΔΔCT) of target gene.
Results
Study group
A group of 54 patients were treated. Patient characteristics are shown in Table 1. Of those patients, 22 patients were treated in phase 1 and 8 patients were evaluable for both phases 1 and 2. Two patients treated at the highest dose level of VPA did not meet criteria for phase 2 of the study, as they had less than 10% marrow blasts. More than half (32) patients were treated in phase 2. Eleven (20%) patients older than 60 years had not received prior therapy (Table 1). These patients were not considered candidates for, or refused, intensive chemotherapy.
VPA dose escalation and toxicities observed
Three dose levels of VPA (20, 35, and 50 mg/kg orally daily for 10 days) were studied in combination with a fixed dose of decitabine (15 mg/m2 by IV infused over 1 hour daily for 10 days). No significant nonhematologic toxicities attributable to decitabine were observed at any dose level. The severity of nonhematologic drug-related toxicities observed during the first course are shown in Table 2. No significant toxicities were observed with VPA at 20 mg/kg. With VPA at 35 mg/kg, 2 of the first 6 patients developed grade 3 neurotoxocity; both were also receiving high doses of other neurotropic agents. After IRB approval, 3 more patients were treated and no further toxic events were observed. The dose of VPA was escalated to 50 mg/kg. Ten patients were treated at this dose level, and 2 developed grades 3 to 4 toxicity, mainly neurotoxicity. Table 3 summarizes the most frequent toxicities observed with the therapy.
Clinical activity
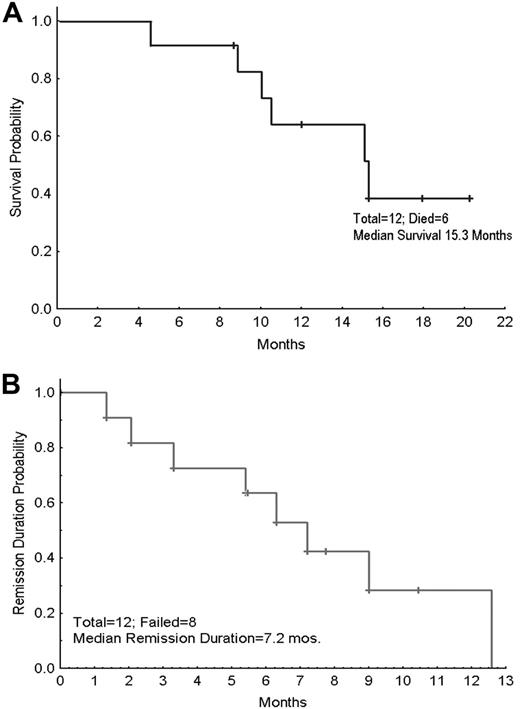
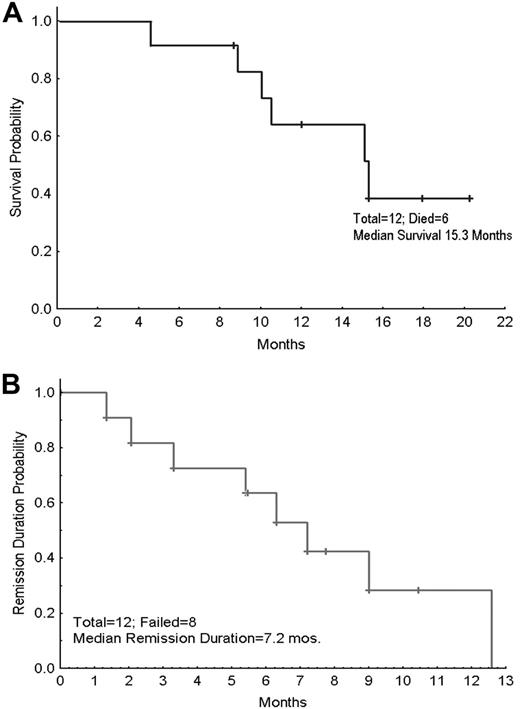
Responses are summarized in Table 4. Of the 54 patients treated, 1 patient was invaluable for response assessment as he was taken off study because of the presence of the Philadelphia chromosome abnormality, and was changed to imatinib-based therapy. Twelve (22%) patients responded to therapy, with 10 CRs and 2 CRp's. This included 5 (50%) of the 10 previously untreated patients registered on the study. The clinical characteristics of responders versus nonresponding patients are shown in Table 5. The median time to response was 60 days (range, 29-138 days). Only 1 (2%) patient died during the first 4 to 6 weeks of therapy. With a median follow-up of 5.6 months (range, 0.7-20.2 months), 12 patients are alive and 4 patients remain on study as of March 2006. The overall survival (OS) was 6 months (range, 0.6-20.2+ months). Median survival was 15.3 months in responders (range, 4.6-20.2+ months; Figure 1), and 4.9 months (range, 0.6-17.8+ months) in nonresponders. Median remission duration was 7.2 months (range, 1.3-12.6+ months; Figure 1). Two (17%) responses were observed at VPA doses of 20 to 35 mg/kg VPA, compared with 10 (24%) at a dose of 50 mg/kg VPA.
Cytogenetic responses
Pretreatment cytogenetic characteristics are shown in Table S4. Of the 8 responders with informative cytogenetics, sequential cytogenetic information is known in 6: 4 achieved a complete cytogenetic response, and 2 a partial cytogenetic response (5% and 10% abnormal metaphases, respectively). Of these 6 patients, 2 remain in complete cytogenetic response and 1 in partial cytogenetic response. Cytogenetic responses were gradual. The median time to maximal cytogenetic response was 4 months (range, 1-6 months), and the median duration of cytogenetic response was 8 months (range, 2-13+ months). Cytogenetic responses were observed 4 months (range, 0-5 months) after morphologic response. In 1 of 3 patients who achieved a cytogenetic response, cytogenetic relapse anteceded morphologic relapse by 4 months; in the other 2 patients it was simultaneous.
VPA levels
Free (milligrams per liter) and bound (micrograms per milliliter) VPA acid levels during course 1 of therapy are shown in Table 6. Nonhematologic toxicity was associated with higher VPA levels: both free and bound day-5 VPA levels were higher in patients who experienced grades 3 to 4 nonhematologic toxicity (free, 30.2 mg/Lin patients without toxicity vs 50 mg/L in patients without; bound, 103 μg/mL versus 127.3 [mg]g/mL; P = .01).
Overall, no association between response and VPA levels was observed when the whole group of patients was analyzed. Median free VPA levels on days 5 and 10 of course 1 in responding patients were 33.0 mg/L (range, 17-43 mg/L) and 32.4 mg/L (range, 15-44 mg/L). In nonresponders, they were 26 mg/L (range, 0-54 mg/L) and 23.0 mg/L (range, 0-59 mg/L) (P = .27 and .14, respectively). Median VPA bound levels were 124.5 μg/mL (range, 103-153 μg/mL) and 132 μg/mL (range, 99-158 μg/mL) on days 5 and 10 in responders compared with 123.5 μg/mL (range, 5-190 μg/mL) and 111.5 μg/mL (range, 5-201 μg/mL) in nonresponders (P = .53 and .21, respectively).
When only previously untreated patients were analyzed, higher VPA levels were observed in responders versus nonresponders. Day 10 free VPA levels were 32.4 mg/L (range, 27-44 mg/L) in responders versus 14.0 mg/L (range, 6-30 mg/L) in nonresponders (P = .03). Bound VPA levels were 144 μg/mL (range, 105-195 μg/mL) in responders versus 102 μg/mL (range, 51-117 μg/mL) in nonresponders (P = .08).
Induction of histone acetylation
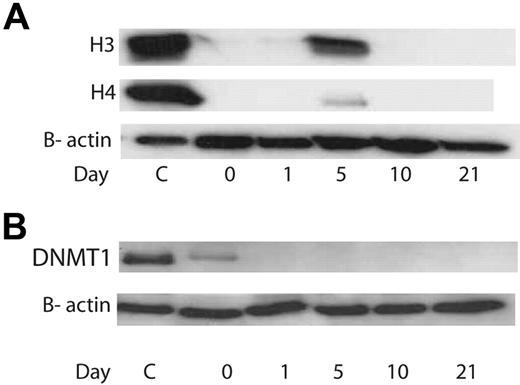
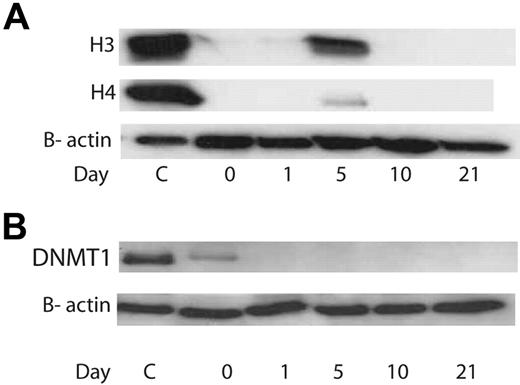
Histone H3 and H4 acetylation was measured using Western blots on days 0, 1, 5, 10, and 21 in 48 patients (Figure 2). Only 1 (10%) of 11 patients at VPA doses of 20 to 35 mg/kg had evidence of histone acetylation, compared with 13 (35%) of 37 receiving 50 mg/kg (P < .001). Day-5 or -10 free or bound VPA levels did not differ among patients with histone acetylation versus others. No association between histone acetylation and response was observed.
DNMT1 levels
Pretreatment DNMT1 protein expression was detected in only 2 of 48 patients and therefore was not informative. In both patients, DNMT1 levels were not detectable by day 1 of therapy (Figure 2).
Analysis of DNA methylation
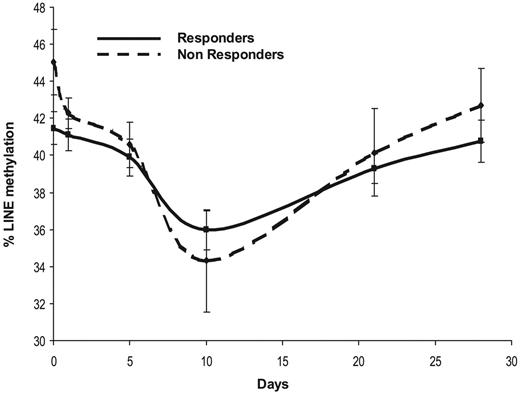
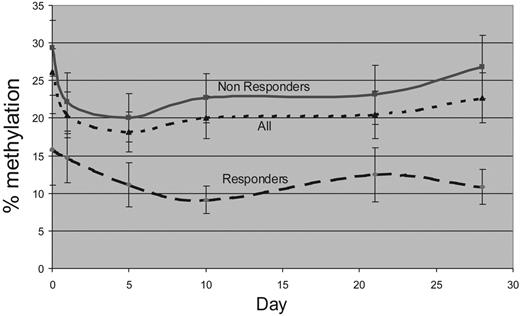
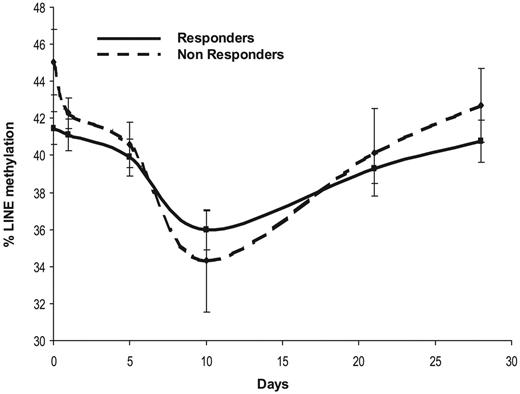
DNA methylation was analyzed on days 0, 1, 5, 10, 21, and 28 of each course of therapy. To assess the effect of decitabine on global DNA methylation, we used the LINE pyrosequencing assay,3 which was measured in 48 patients. Figure 3 shows the dynamics of LINE hypomethylation with treatment. Levels of LINE methylation declined gradually with therapy to a maximal point coinciding with the last day of treatment, and returned to baseline prior to the next course of therapy. No differences at any of the endpoints studied were observed between responders and nonresponders.
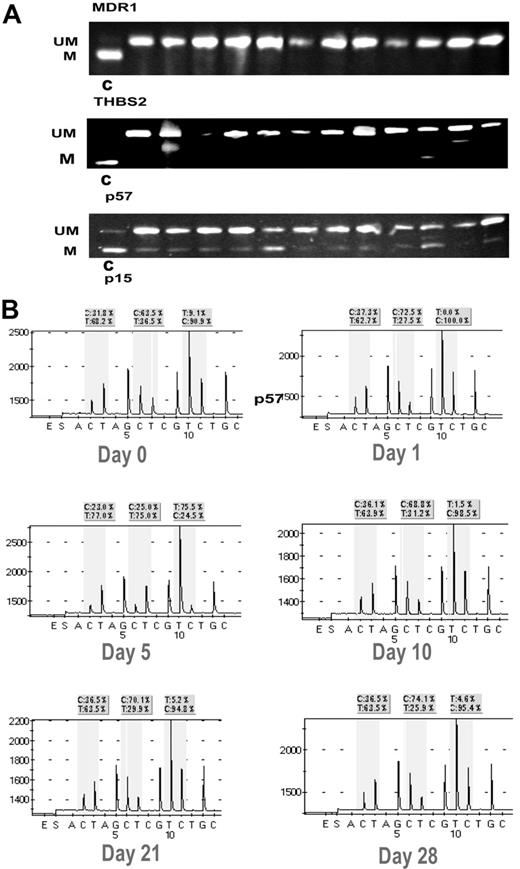
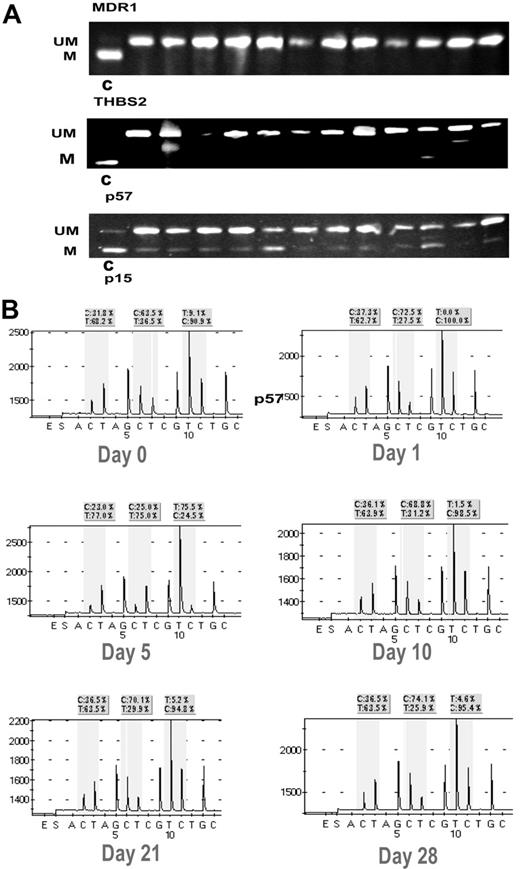
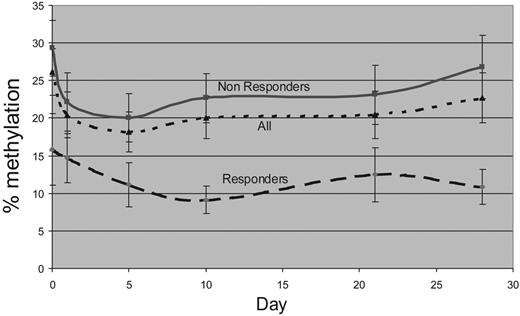
To analyze the effects on gene specific methylation, the following genes were studied: p15, p57KIP2, THBS2, MDR1, and p73 (Figure 4). Table 7 summarizes pretreatment methylation characteristics. Of the 5 genes screened, p15 was the most informative, and its methylation was analyzed sequentially on the same days as LINE. Pretreatment p15 methylation was significantly lower in responders (11.4%; range, 0%-80.9%) versus nonresponders (22.3%; range, 0%-59.36%) (P = .06). This effect was observed also on days 10 and 28 (Figure 5). Neither the absolute change in p15 methylation from baseline to day 10 nor the percentage of change was statistically significant, comparing responders with nonresponders.
Analysis of gene reactivation
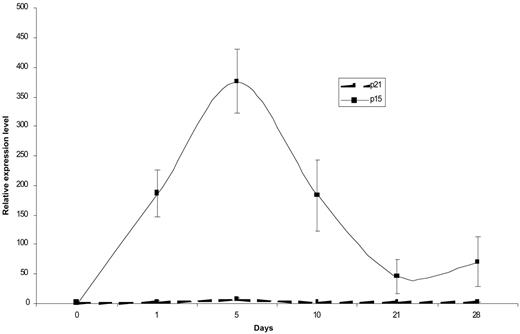
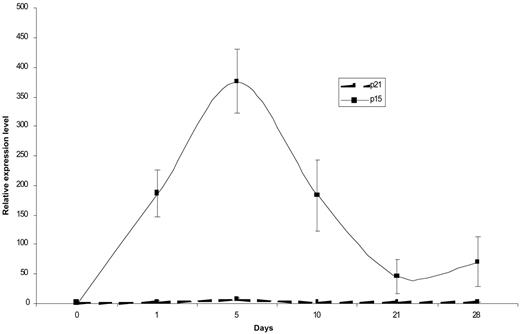
The effect on mRNA expression of p15 and p21CIP1 was evaluated sequentially on the same days studied for methylation. Reactivation of p15 but not of p21 was observed (Figure 6). For p15, this effect was proportional to the demethylation of the gene (data not shown). It should be noted that p21CIP1 is not methylated in leukemia.21 Gene reactivation was not associated with response.
Subset analysis of pediatric patients
Seven (13%) patients aged 4 to 21 years were treated in this study. All of them had relapsed/refractory AML. Four patients had relapsed after bone marrow transplantation (1 autologous and 3 allogeneic). Three patients that relapsed after transplantation were also refractory to salvage reinduction with standard ara-C–based chemotherapy. No significant toxicities were observed in this age group. Although no CRs or CRp's were documented, 3 patients achieved a complete marrow response (defined by the presence of less than 5% blasts), and in 1 patient, marrow blasts were 6% with improvement of transfusion dependency. Histone acetylation was observed in 14% of patients. No differences in the dynamics of DNA hypomethylation were observed between children and adult patients (data not shown).
Discussion
In this study of low-dose decitabine and VPA given for 10 days in patients with advanced leukemia, we defined a safe and effective schedule using decitabine at 15 mg/m2 by IV daily for 10 days with VPA at a dose of 50 mg/kg daily also for 10 days on the same days as decitabine. Among 53 patients treated, the response rate was 22%, and it was 50% in patients without prior therapy. Induction mortality was very low (2%). This study has defined the MTD of VPA at 50 mg/kg orally daily for 10 days. Our experience suggests that VPA doses above 50 mg/kg for 10 days will be difficult to administer because of frequent grade 2 neurotoxicity, mainly transient confusion and somnolence. This usually peaked by the end of the 10-day course and resolved 1 to 3 days after stopping VPA. VPA neurotoxicity was enhanced when administered in combination with other neurotropic agents. Such patients, particularly if elderly, should be monitored closely. Further information supporting that a dose of VPA higher than 50 mg/kg daily for 10 days exceeds the MTD of VPA is derived from an ongoing study of the combination of 5-azacytidine, VPA, and ATRA. In this study, a VPA dose of 62.5 mg/kg daily for 7 days was determined to be above the MTD (G.G.-M., unpublished data). VPA is being used as a single agent in MDS. In the follow-up study of Kuendgen et al,22 VPA levels of 50 to 100 μg/mL were targeted. Among 119 patients with low-risk MDS, 1 patient achieved CR, 1 achieved CRp, and 23 saw hematologic improvement. The low rate of CR/CRp's in this study is not surprising, as in vitro data indicates that HDAC inhibition is observed at concentrations greater than 1 mM18 of VPA above the targeted VPA levels of 50 to 100 μg/mL targeted in that study. This is well above levels achievable with VPA at doses used for the treatment of neurologic disorders, as targeted in the study of Kuendgen et al.22 Our study aimed to synergize the antileukemia activity of decitabine. This was supported by our in vitro model.18 Our in vitro study also indicated that higher concentrations of VPA were superior to the lower concentrations in terms of synergisms, cytotoxicity, and histone acetylation.18 In this study, VPA levels were directly associated with toxicity but also with clinical activity in previously untreated patients. Of interest, no relationship was observed between histone acetylation and VPA levels, although histone acetylation was more frequent in patients receiving higher doses of VPA. The lack of correlation of VPA levels and histone acetylation may be related to the erratic pharmacokinetics of VPA, the sensitivity of the histone acetylation assays used on this study, the relatively small number of patients treated, and the specific patient's heterogeneity.
Survival of responders. (A) Overall survival. (B) Disease-free survival. Tick marks indicate censored data.
Survival of responders. (A) Overall survival. (B) Disease-free survival. Tick marks indicate censored data.
The combination of decitabine and VPA induced an overall response rate of 22%, and of 50% in the subset of elderly patients with untreated disease. The treatment mortality was only 1%. Based on our previous experience with high-dose cytarabine programs, or more conventional “7 + 3” programs, this therapy compares well in terms of response and early mortality rates. Whether this activity was influenced by the addition of VPA remains to be determined in comparative trials. Because of the characteristics of the study group, it is difficult to compare it with other studies of decitabine in MDS,1 but evidence for the benefit of adding VPA to decitabine can be inferred from several observations in this study. First, although an association between higher VPA levels and response was not observed for the whole group of patients, a significant trend was observed when the more homogeneous subset of older untreated patients was analyzed. Second, most responses occurred in those patients receiving higher doses of VPA. Finally, responses were attained earlier in patients receiving higher doses of VPA: median number of courses to response was 1 for patients receiving higher doses of VPA compared with 2 to 3 courses for patients at the lower dose levels.
Western blot analysis of acetylated histones H3 and H4 and DNMT1. (A) Representative example of histone H3 and H4 acetylation. C indicates control. HL-60 cells treated with 1 mM VPA for 24 hours. (B) Example of DNMT1 expression. C indicates control as in panel A.
Western blot analysis of acetylated histones H3 and H4 and DNMT1. (A) Representative example of histone H3 and H4 acetylation. C indicates control. HL-60 cells treated with 1 mM VPA for 24 hours. (B) Example of DNMT1 expression. C indicates control as in panel A.
The nature of the responses observed was not cosmetic. Responses were robust. The median response duration was 7.2 months. Responders had a median survival of 15.3 months, significantly longer compared with those patients not achieving a response. More importantly, clinical activity was observed in patients with poor-risk cytogenetics, and in those patients, therapy was associated with durable cytogenetic remissions.
This study allowed patients aged 2 years and older to be registered. The reason for the age restriction was based on data that VPA in younger children (younger than 2 years) is associated with significant hepatotoxicity.23-25 In this study, the combination of decitabine and VPA was safe in children with advanced relapsed/refractory leukemia. This combination needs to be further explored in childhood leukemia.
Dynamics of LINE methylation. LINE methylation was measured using a bisulfite pyrosequencing assay. Solid line indicates responders; dashed line, nonresponders. Error bars indicate standard error of the mean (SEM).
Dynamics of LINE methylation. LINE methylation was measured using a bisulfite pyrosequencing assay. Solid line indicates responders; dashed line, nonresponders. Error bars indicate standard error of the mean (SEM).
Examples of DNA methylation. (A) Pretreatment DNA methylation of MDR1, THBS2, and p57 using COBRA.20 Each lane represents a patient sample. UM indicates unmethylated; M, methylated; and C, methylated control. (B) Example of p15 methylation in a patient on days 0, 1, 5, 10, 21, and 28 of decitabine, VPA treatment. The 3 evaluated cytosines are enclosed in shaded squares. C indicates methylated cytosine; T, unmethylated site.
Examples of DNA methylation. (A) Pretreatment DNA methylation of MDR1, THBS2, and p57 using COBRA.20 Each lane represents a patient sample. UM indicates unmethylated; M, methylated; and C, methylated control. (B) Example of p15 methylation in a patient on days 0, 1, 5, 10, 21, and 28 of decitabine, VPA treatment. The 3 evaluated cytosines are enclosed in shaded squares. C indicates methylated cytosine; T, unmethylated site.
Both decitabine and VPA have produced reversal of in vitro epigenetic marks associated with gene silencing. In this study, we analyzed in vivo the effects of the combination on global and gene specific DNA methylation, histone acetylation, and gene re-expression. Consistent with in vitro data, decitabine induced both global and gene-specific DNA hypomethylation. DNA hypomethylation reached a nadir by the end of decitabine administration and returned to baseline by day 28 of therapy. No difference in global hypomethylation was observed between responders and nonresponders. Because LINE methylation is a normal physiologic phenomenon that occurs both in neoplastic and nonneoplastic cells, the value of the study of the dynamics of global methylation using the LINE assay could be considered a surrogate marker of biological activity of the drug not necessarily related to its clinical activity.
Dynamics of p15 methylation. P15 methylation was measured using a bisulfite pyrosequencing assay. Error bars indicate SEM.
Dynamics of p15 methylation. P15 methylation was measured using a bisulfite pyrosequencing assay. Error bars indicate SEM.
One difficulty in analyzing gene specific methylation in leukemia is its heterogeneity. To circumvent this problem, we used a strategy of screening 5 genes prior to therapy. The most frequently methylated gene, p15, was then monitored sequentially during therapy. Pretreatment p15 methylation levels were lower in patients achieving a response. This suggests that the lower pretreatment p15 methylation levels may identify a subset of patients with good prognosis when treated with this type of therapy, independent of other prognostic characteristics such as cytogenetics or other molecular alterations.
The distribution of abnormal karyotypes was similar between both groups of patients. Flt-3 alterations were also evenly distributed between both subgroups (data not shown).
Despite the lack of a correlation between VPA levels and histone acetylation, higher doses of VPA were associated with more frequent induction of both histone H3 and H4 acetylation. This was not associated with a better response rate. A similar phenomenon has been observed in patients treated with single-agent vorinostat26 and with the combination of 5-azacytidine and phenylbutyrate.27 The lack of association between response and induction of histone acetylation could be explained by the sensitivity of the assays used, or by the possibility that response is related to effects downstream from histone acetylation, or to acetylation of other proteins not related to histones.
The effect of the combination on gene reactivation was analyzed. An inverse correlation was observed between DNA hypomethylation and reactivation of p15. Of interest, p21CIP1, a gene invoked to be a key mediator of response to some HDAC inhibitors,28 was not reactivated in this study.
Decitabine exerts its function by trapping DNA methyltransferase in DNA. In vitro, the use of hypomethylating agents was associated with decreased DNMT protein levels, presumably by trapping of the protein.29 Using the same assay as Cheng et al,29 we could only detect DNMT1 levels in a minority of patients prior to therapy. Levels of DNMT1 disappeared upon drug exposure.
There are several limitations to our study. The first one is the choice of the HDAC inhibitor. A number of new HDAC inhibitors are currently being investigated.30 In vitro, VPA is the least effective HDAC inhibitor, and its clinical use at higher doses is limited by its toxicity profile. The combination of either decitabine or 5-azacytidine with other more effective and less toxic HDAC inhibitors may improve the results.30,31 Second, the optimal schedule of decitabine is currently being evaluated. Data from ongoing studies at our institution suggest that shorter schedules (20 mg/m2 by IV for 5 days)32 may be better. Third, maximal effect on gene reactivation has been observed when administering the hypomethylation agent followed by the HDAC inhibitor. In our in vitro model,18 the use of the sequence had no effect on cell kill, hence our choice of the schedule. That said, it is possible that a schedule using a sequence in which the hypomethylating agent is administered before the HDAC inhibitor may be more active clinically.
Induction of p15 and p21 mRNA expression. P15 and p21 mRNA expression was studied using real-time PCR sequentially during therapy. Error bars indicate SEM.
Induction of p15 and p21 mRNA expression. P15 and p21 mRNA expression was studied using real-time PCR sequentially during therapy. Error bars indicate SEM.
Finally, in this study we were unable to detect a direct relationship between DNA hypomethylation or the induction of histone acetylation and clinical response. This could be explained by several facts. First, the patient population studied here is relatively small and heterogeneous, including both patients with advanced disease and patients with untreated disease. Second, we are not certain about the sensitivity and specificity of some of the assays used here, in particular for histone acetylation, so it is possible that we may be underdetecting histone acetylation. Third, despite the fact that we studied the methylation dynamics of 5 genes, only one of them, p15, proved to be informative. It is possible that the analysis of methylation of other relevant genes may result in the identification of markers of response. It should be noted that when we designed this study, we were aware of the potential limitations of the correlative studies to be used and considered them exploratory in nature. Finally, we do not completely understand the mechanisms of action of either the hypomethylating agent or the HDAC inhibitor, so it is possible that their clinical activities are not related to the induction of DNA hypomethylation or histone acetylation.
In summary, this study suggests that the combination of a hypomethylating agent, decitabine, with an HDAC inhibitor, VPA, is safe and active. This therapy was associated with significant DNA hypomethylation, induction of histone acetylation, and gene reactivation. Despite the evidence of clinical activity of this combination, in particular in the older untreated patients, it should be noted that the number of patients treated is small and therefore the use of this combination should be considered investigational and should not be recommended outside the setting of a clinical trial. Future studies should explore new HDAC inhibitors with different schedules of decitabine.
Prepublished online as Blood First Edition Paper, August 1, 2006; DOI 10.1182/blood-2006-03-009142.
Supported by National Cancer Institute (NCI) grant CA105771, and the University of Texas M. D. Anderson Cancer Center's Physician-Scientist Program Award funded by the Commonwealth Cancer Foundation for Research (G.G.-M.).
The authors declare no competing financial interests.
B.S.-G. and H.Y. contributed equally to this study.
The online version of this article contains a data supplement.
The publication costs of this article were defrayed in part by page charge payment. Therefore, and solely to indicate this fact, this article is hereby marked “advertisement” in accordance with 18 USC section 1734.
SuperGen (Dublin, CA) and, subsequently, MGI Pharma (Bloomington, MN) provided 5-aza-2′-deoxycytidine. We are grateful to Marta Cuadros-Celorrio (Spanish Centro Nacional de Investigaciones Oncológicas [CNIO]) and Claritza Santos-Malave (University of Puerto Rico) for technical assistance, to Mark Brandt and Sherry Pierce for data collection, and to Deborah Goldwasser for data analysis.

