Abstract
Hedgehog (Hh) proteins are considered diffusible morphogens that can be membrane anchored, playing an essential role during development. Here we show that Hh morphogens are associated with microvesicles (MVs) shed from the plasma membrane of apoptotic/stimulated T cells. Hh+ MVs induced differentiation of human K562 pluripotent erythroleukemic cells toward megakaryocytic lineage, as testified to by the expression of αIIbβ3 integrin and CD42b and changes in the cell cycle. Blocking Hh pathway with either cyclopamine, neutralizing antibodies, or inhibitors of the protein kinase A pathway resulted in the inhibition of these effects. Activation of Hh signaling by SAG, a synthetic agonist, mimicked effects of Hh+ MVs on K562 cells. Human Hh+ MVs, circulating in vivo or derived from apoptotic/stimulated lymphocytes from healthy and diabetic individuals, elicited K562 cell differentiation, also inhibited by cyclopamine. In addition, Hh+ MV-treated primary human CD34+ cells presented an increase of CD41+CD42– and CD41+CD42+ megakaryocytic populations with an increase of corresponding polyploidy, both being reduced by blockers of the Hh pathway. Because virtually all cell types undergo plasma membrane remodeling when stimulated, derived MVs can therefore be considered true vectors in the transfer of morphogen-borne biologic information to remote responsive cells, and thereby contribute to the maintenance of homeostasis.
Introduction
Morphogen gradients are essential in the patterning of diverse tissues during development. Thus, morphogens stem from a tissue source and act on target cells by modifying programs of gene expression. Members of the hedgehog (Hh) morphogen family include Sonic (Shh), Indian, and Desert hedgehog signaling molecules.1 Hh precursor is first cleaved and the resulting 22-kDa N-terminal active peptide is modified by addition of a palmitate group and a cholesterol molecule and becomes associated with cholesterol-rich raftlike membrane microdomains.2,3 Such modifications play a critical role in regulating Hh binding to the plasma membrane and long-range activity.4,5 Once shed, Hh protein binds to the patched (Ptc) receptor, releasing the latent inhibition of smoothened (Smo), which is the signaling component of the Hh-receptor complex in the target cell.6 In vivo, Hh proteins play a key role during embryonic development, regulating not only the patterning of the central nervous system, but also cell differentiation and proliferation. Indeed, activation of Shh signaling pathway favors angiogenesis7,8 and promotes in vitro hematopoietic9 and thymocyte differentiation.10
Free diffusion of soluble Hh molecules in the extracellular space has been proposed as a model to explain the formation of morphogen gradients.11,12 Other studies have shown that membrane fragments, also termed argosomes, transporting morphogens such as wingless, might be used as a vehicle and be involved in tissue patterning, but no mechanistic insight was provided.13,14 Chen et al5 have reported that palmitoylation is required for producing Hh multimeric complexes able to form a morphogen gradient. In addition, the effects of Hh morphogens are not only dictated by a temporal gradient, but a spatial gradient seems also necessary.15,16 Indeed, as recently described by Williams and colleagues12 different morphogens in different developmental contexts may use different means of transport.
Vesiculation or microvesicle (MV) release occurs during activation of virtually all cell types by various agonists, shear stress, or apoptosis.17-19 The release of MVs or apoptotic bodies from senescent cells is a conserved event of the apoptosis execution phase.20 MVs, also termed microparticles, are small plasma membrane fragments (0.05-1 μm) shed by cells after membrane blebbing. At their surface MVs bear antigens characteristic of the cell of origin and carry other membrane and cytoplasmic constituents. They exhibit negatively charged phospholipids at their surface, accounting for their procoagulant character, and carry components responsible for their proinflammatory properties. Elevated levels of circulating MVs have been detected under pathologic situations, such as systemic lupus erythematosus, atherosclerosis, acute coronary syndrome, sepsis, and diabetes.21-25 Although the majority of in vivo circulating MVs are derived from platelets, the proportions of the different origins can differ. Thus, in diabetes for instance, not only the level of total MVs is enhanced, but MVs from leukocytic origin are about 2.5-fold increased when compared to healthy individuals.25
The secretion of the wingless morphogen from apoptotic cells stimulates growth of proliferation-sensitive neighboring cells and leads to compensatory proliferation.26 Because wingless as well as Hh morphogens can remain membrane-anchored,13,14 it is possible that apoptotic cells release morphogen-expressing MVs that induce changes in proximal or remote tissues. Up to now, MVs have been considered as cell dust; however, recent data bring evidence that MVs generated during cell activation or apoptosis can transfer biologic messages between different types of cells.27-29 Because of their smaller size and greater ability to diffuse, MVs can survive activated cells, which are promptly cleared by phagocytosis. Here, we propose that MVs derived from the plasma membrane of apoptotic/stimulated cells can disseminate morphogens, Hh proteins in particular. Hence, using a human heterologous system, MVs shed from CEM T lymphocytic cells were examined with respect to their capacity of harboring Hh proteins and inducing differentiation and changes in the cell cycle of human K562 pluripotent erythroleukemic and primary CD34+ cells. In addition, we have assessed the physiologic significance of human Hh+ MVs retrieved in vivo regarding their potential for induction of cell differentiation.
Materials and methods
Isolation of membrane MVs from CEM T cells
CEM T lymphocytic cells were used for MV production. Cells were seeded at 3 × 10⁵ cells/mL and cultured in serum-free X-VIVO 15 medium (Cambrex, Walkersville, MD). Cells were treated with phytohemagglutinin (PHA; 5 μg/mL; Sigma, St Louis, MO) for 72 hours, and then with phorbol-12-myristate-13-acetate (PMA; 20 ng/mL; Sigma) and actinomycin D (act D; 0.5 μg/mL; Sigma) for 18 hours. MVs were also generated from CEM T cells treated with PHA alone, PMA alone, act D alone, or the combination PHA/act D. MVs isolated from at least 5 independent preparations were analyzed for each experimental condition.
Supernatant was obtained by centrifugation at 750g for 15 minutes and then at 1500g for 5 minutes to remove cells and large debris, respectively. The latter supernatant was recentrifuged for 45 minutes at 14 000g. The pelleted MVs were resuspended in 15 mL HBSS and centrifuged again for 45 minutes at 14 000g. The pellet was recovered in 1 mL HBSS. Double determination of MV amount was carried out by (1) measuring their phosphatidylserine content by a prothrombinase assay after capture through immobilized antibody to Shh (N-19; Santa Cruz Biotechnology, Santa Cruz, CA) as described elsewhere,19 and (2) by measuring MV-associated proteins, using the method of Bradford with BSA (Sigma-Aldrich, St Louis, MO) as the standard.
Isolation of membrane MVs from healthy or diabetic individuals
To prepare circulating MV samples, peripheral blood was collected from 2 informed and consenting diabetic individuals with typical symptoms, such as microvascular complications, and 2 healthy volunteers, under the guidelines established by the ethics committee of the Hôpitaux Universitaires de Strasbourg, according to the Declaration of Helsinki. Circulating MVs were obtained after a 2-step centrifugation of plasma samples (1500g for 15 minutes; 14 000g for 2 minutes) and pelleted by centrifugation at 14 000g for 45 minutes at room temperature. The pellet was recovered in 1 mL.
Lymphocytes were isolated by differential centrifugation on Ficoll and were treated with PHA/PMA/act D to generate MVs, which were determined and characterized as described (see “Isolation of membrane MVs from CEM T cells”).
As previously detailed,29 circulating MVs from diabetic patients and from their act D–treated lymphocytes expressed surface markers (CD4, CD3, CD8, CD11a, Fas, and FasL) characteristic of CEM T cells.
Generation of a polyclonal antiserum to rat Smo proteins
Recombinant rat Smo protein (residues 629-792) was obtained after polymerase chain reaction (PCR) amplification of rat brain cDNA and subcloning of the expected DNA fragment into the pGEX-4T-1 vector (Amersham Biosciences, Uppsala, Sweden) allowing the production of a fusion protein with glutathione S-transferase (GST) in the bacteria strain Escherichia coli BL21. The fusion protein was purified and 100 μg was injected into a rabbit to generate antiserum. Preimmune serum was used as a control.
Western blots
The presence of Hh proteins in different samples of MVs (20 μg) was assessed by Western blots on a 12% sodium dodecyl sulfate–polyacrylamide gel electrophoresis (SDS-PAGE) with the rabbit antiserum 167 antibody directed to mouse Hh as described.2
Assessment of MV-induced differentiation of K562 cells
K562 cells were seeded at 2 × 10⁵ cells/mL in 12-well plates in RPMI 1640 supplemented with l-glutamine (2 mM), 1% nonessential amino acids, 1 mM sodium pyruvate, 20 μg/mL gentamicin, and 10% FCS. Exponentially growing cells were used for all experiments. The number of cells and viability were determined by trypan blue exclusion. MVs were added to K562 cells at the indicated final concentrations. Control cells were treated with the appropriate volume of vehicle. To verify the role of Hh in this system, cells were preincubated for 30 minutes in the presence of either cyclopamine (30 μM), the 5E1 monoclonal antibody (mAb) to Hh (10 μg/mL),30 or the polyclonal antiserum to mouse Smo (1:300 to 1:100) and then treated with MVs and incubated throughout the assay. In parallel, control experiments were performed using the irrelevant control 9E10 antibody (10 μg/mL) or preimmune serum (1:300 to 1:100) under the same conditions. Although a 1:100 dilution was responsible for maximal inhibition (30%), mortality was increased with respect to control cells; thus, experiments were performed at 1:150 dilution. In another set of experiments, the SAG agonist (0.1-30 nM)31 was added to K562 cells and incubated throughout the assay. To confirm that interaction of MVs with K562 cells activates the Hh pathway, 2 inhibitors of protein kinase A (H-89 and KT5720; Sigma-Aldrich) were used at 150 μM and 30 μM, respectively. After 72 hours of incubation, cells were washed in HBSS with 0.1% BSA and adjusted to 1.5 × 10⁵ cells/mL. Expression of αIIbβ3 and CD42b was assessed by incubation (4°C, 30 minutes) using a mAb recognizing the αIIbβ3-integrin complex (mouse anti–human αIIbβ3; 10 μg/mL; Immunotech, Marseille, France) or biotinylated mAb to GPIbα (2 μg/mL; gift of Dr François Lanza, U. 311 INSERM, Strasbourg, France), respectively. Cells were washed twice with HBSS with 0.1% BSA and incubated with phycoerythrin-conjugated goat anti–mouse IgG1 (2.5 μg/mL; Jackson ImmunoResearch Labs, West Grove, PA) or phycoerythrin-streptavidin (1 μg/mL; Sigma-Aldrich) at 4°C for 30 minutes. Irrelevant mouse IgG1 or biotinylated IgG1 was used as an isotype-matched negative control for each sample. Cells were then washed twice and resuspended in 400 μL HBSS with 0.1% BSA. Ten thousand events were analyzed for each sample by flow cytometry (Becton Dickinson, San Jose, CA). Cells treated as for flow cytometry analysis were also visualized by fluorescence laser scanning microscopy, using a Nikon Eclipse E1000 microscope (Nikon, Kanagawa, Japan) equipped with a 40×/0.75 NA objective. Fluorescence intensity was recorded with a Spot 2E camera and Spot 3.5.9 software (Diagnostic Instruments, Sterling Heights, MI). To enable comparison, all images were processed using the same parameters of laser power and photomultiplier sensitivity. Images showed are representatives of at least 4 separate experiments for each condition using identical values for contrast and brightness.
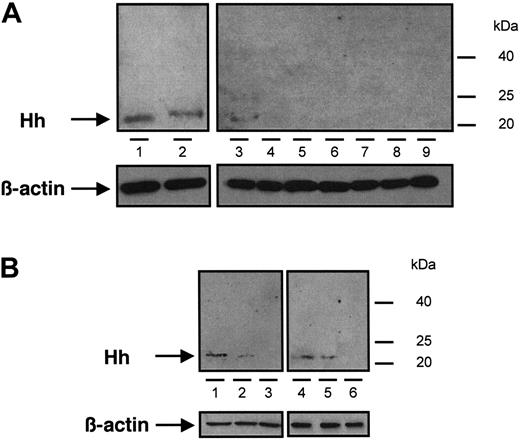
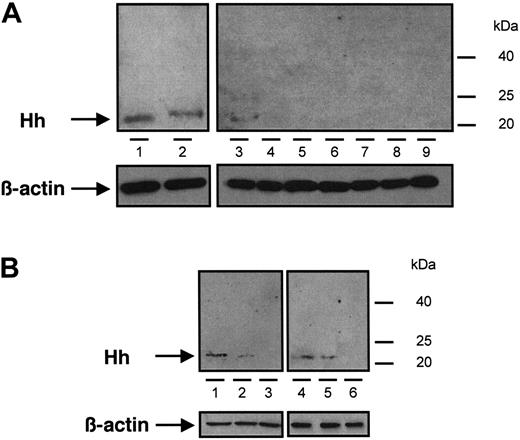
Immunoblot analysis of Hh content from different samples of MVs. (A) MVs generated from CEM T cells treated with PHA/PMA/act D (lanes 1 and 2, from 2 independent preparations), PHA/act D (lane 3), PMA (lanes 4 and 5, from 2 independent preparations), PHA (lanes 6 and 7, from 2 independent preparations), or act D (lanes 8 and 9, from 2 independent preparations). (B) MVs retrieved in vivo circulating in human peripheral blood (lanes 1 and 4) and MVs generated from lymphocytes treated with PHA/PMA/act D (lanes 2 and 5) or act D (lanes 3 and 6), from healthy (1-3) or diabetic individuals (4-6). Three determinations yielding similar results were performed. In panels A and B a β-actin control was included.
Immunoblot analysis of Hh content from different samples of MVs. (A) MVs generated from CEM T cells treated with PHA/PMA/act D (lanes 1 and 2, from 2 independent preparations), PHA/act D (lane 3), PMA (lanes 4 and 5, from 2 independent preparations), PHA (lanes 6 and 7, from 2 independent preparations), or act D (lanes 8 and 9, from 2 independent preparations). (B) MVs retrieved in vivo circulating in human peripheral blood (lanes 1 and 4) and MVs generated from lymphocytes treated with PHA/PMA/act D (lanes 2 and 5) or act D (lanes 3 and 6), from healthy (1-3) or diabetic individuals (4-6). Three determinations yielding similar results were performed. In panels A and B a β-actin control was included.
Cell cycle analysis
Cells were washed in HBSS containing 0.1% BSA, and 0.2 mL of a nuclear isolation medium (50 μg/mL propidium iodide, 0.6% NP-40, 100 μg/mL RNase, DNase-free, in HBSS) was added. Cells were then incubated (1 hour) at room temperature in the dark before addition of 0.4 mL HBSS and subjected to flow cytometric analysis. Up to 20 000 nuclei were analyzed per sample and the proportion of events distributed in the different cell-cycle phases was determined. All reagents were from Sigma-Aldrich.
Isolation and culture of CD34+ cells
Blood CD34+ cells were isolated from leukapheresis samples performed on patients after mobilization or from umbilical cord blood obtained under guidelines established by the ethics committee of the Institut Gustave Roussy. CD34+ cells were isolated using the magnetic-activated cell sorting (MACS) CD34 progenitor-cell isolation kit (Miltenyi Biotec, Bergisch Gladbach, Germany) according to manufacturer's instructions. After isolation, CD34+ cells were cultured and phenotyped as previously detailed.32
Quantification of clonogenic progenitors in semisolid cultures
Erythroid (erythroid burst-forming units [BFU-Es]) and granulocytic (granulocyte-macrophage colony-forming units [CFU-GMs]) progenitors were scored using previously described methylcellulose assays.32 Cultures were carried out in the presence of recombinant human growth factors: SCF (50 ng/mL), IL-6 (100 U/mL), IL-3 (100 U/mL), and human erythropoietin (1 IU/mL; Janssen-Cilag, Issy les Moulineaux, France). Hematopoietic progenitors were scored on day 12 using an inverted microscope.
Determination of megakaryocyte ploidy
Megakaryocytes derived from cord blood CD34+ cells were incubated for 30 minutes with anti-CD41-allophycocyanin (APC; Becton Dickinson), washed in PBS-EDTA, and then incubated for 2 hours with 0.01 mM Hoechst 33342 (Sigma-Aldrich) at 37°C in serum-free medium. Control cells were stained with an irrelevant APC-IgG1 mAb. Megakaryocytes were then analyzed according to their DNA content using a LSR II flow cytometer (Becton Dickinson). Ten thousand events were acquired and analyzed with the FacsDIVA software package (Becton Dickinson).
Statistical analysis
Data are presented as mean ± SEM. Statistical analyses were performed by the t test. Differences were considered significant at P less than .05.
Results
Hh+ MVs induce cell differentiation
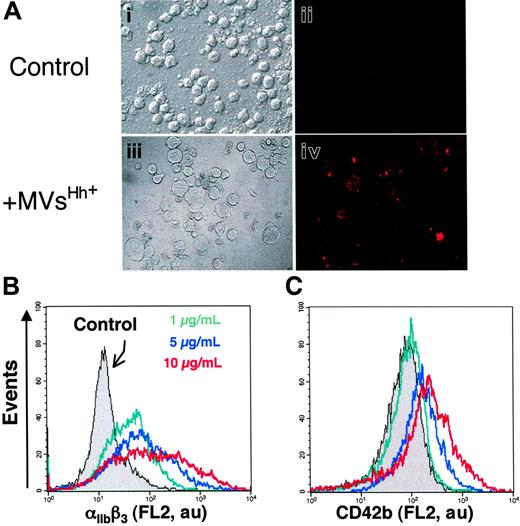
The presence of Hh in CEM T-derived MVs generated by PHA/PMA/act D treatment was examined by Western blot analysis (Figure 1A). As reported in developing and adult tissues,2 a signal corresponding to the active fragment of Hh was detected, which is in accordance with recent studies showing the expression of Shh and signaling pathway components in resting and activated T cells.33,34 We therefore investigated whether Hh+ MVs released from apoptotic/stimulated lymphocytic cells can induce the differentiation of erythroleukemia K562 cells. After exposure to specific stimuli, these cells are able to differentiate toward megakaryocytic, erythroid, or monocytic lineages.35 Hh+ MVs elicited expression of αIIbβ3 integrin (CD41/CD61, also referred to as glycoprotein IIb/IIIa complex) at the cell surface (Figure 2A), a specific marker of megakaryocytic differentiation and derived platelets. Hh+ MVs also caused morphologic changes in K562 cells. Cells treated with Hh+ MVs augmented in volume and became highly vacuolated, concomitantly with the increase of expression of αIIbβ3 integrin. These changes are considered a reliable indicator of megakaryocytic differentiation.36 On the other hand, control cells constituted a relatively homogeneous population with smaller size (Figure 2A).
To investigate the effect of Hh+ MV on K562 cell differentiation, flow cytometry assessment of the expression of 2 markers of megakaryocytic differentiation αIIbβ3 and CD42b (GPIbα) was carried out. Hh+ MVs induced a concentration-dependent increase of cell-surface expression of αIIbβ3 (Figure 2B; Table 1). These results corroborated observations obtained by fluorescence microscopy showing an increase of αIIbβ3 expression after exposure to Hh+ MVs (Figure 2A). CD42b expression was also enhanced after Hh+ MV treatment, although the increase was lower but more homogeneous than that observed for αIIbβ3 (Figure 2C; Table 1). It is important to mention that the expression of erythroid differentiation markers such as glycophorin-A was not modified by Hh+ MVs (not shown). These findings suggest a role for MVs in the specific induction of the megakaryocytic differentiation response and raise the possibility that Hh is the message disseminated through MVs.
Effect of MVs on the expression of cell-surface markers characteristic of megakaryocytic differentiation of K562 cells. (A) Cells were treated for 72 hours with medium (control, i-ii) or 5 μg/mL membrane MVs (with respect to protein content) obtained from CEM T cells treated with PHA/PMA/act D (iii-iv). Expression of αIIbβ3 (ii,iv) was detected by fluorescence microscopy after exposure to antibody to αIIb and revelation by phycoerythrin-labeled anti–mouse IgG. Panels i and iii show the corresponding phase-contrast images (original magnification ×40). (B-C) Flow cytometry histograms showing MV concentration dependence of the surface expression levels of αIIbβ3 and CD42b by K562 cells treated with either medium (control) or 1 to 10 μg/mL membrane MVs obtained from CEM T cells treated with PHA/PMA/act D. Fluorescence (FL2, red fluorescence channel intensity, log scale) is expressed in arbitrary units (au). The respective increases of mean fluorescence intensity (± SEM) reflecting the expression level of αIIbβ3 and CD42b after treatment by PHA/PMA/act D or PHA/act D–generated MVs are indicated in Table 1.
Effect of MVs on the expression of cell-surface markers characteristic of megakaryocytic differentiation of K562 cells. (A) Cells were treated for 72 hours with medium (control, i-ii) or 5 μg/mL membrane MVs (with respect to protein content) obtained from CEM T cells treated with PHA/PMA/act D (iii-iv). Expression of αIIbβ3 (ii,iv) was detected by fluorescence microscopy after exposure to antibody to αIIb and revelation by phycoerythrin-labeled anti–mouse IgG. Panels i and iii show the corresponding phase-contrast images (original magnification ×40). (B-C) Flow cytometry histograms showing MV concentration dependence of the surface expression levels of αIIbβ3 and CD42b by K562 cells treated with either medium (control) or 1 to 10 μg/mL membrane MVs obtained from CEM T cells treated with PHA/PMA/act D. Fluorescence (FL2, red fluorescence channel intensity, log scale) is expressed in arbitrary units (au). The respective increases of mean fluorescence intensity (± SEM) reflecting the expression level of αIIbβ3 and CD42b after treatment by PHA/PMA/act D or PHA/act D–generated MVs are indicated in Table 1.
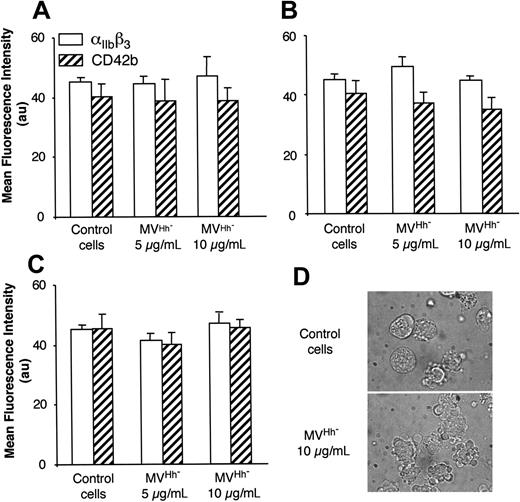
We also examined MVs shed from CEM T lymphocytes stimulated under different conditions. Although expression of αIIbβ3 and CD42b of K562 cells was increased after treatment with MVs obtained from lymphocytes stimulated by PHA/act D (Table 1), the enhancement of expression of both markers was lower than that obtained after exposure to MVs generated on PHA/PMA/act D stimulation, probably due to weaker expression of Hh (Figure 1). MVs generated from PHA-, PMA- or act D-treated lymphocytes did not harbor Hh (Figure 1) and had no effect on the expression of either αIIbβ3 or CD42b at the surface of K562 cells (Figure 3A-C). In addition, in the presence of act D-generated MVs, K562 cells underwent apoptosis with typical membrane features (Figure 3D).
Blockers of the Hh signaling pathway neutralize the differentiation potential of Hh+ MVs
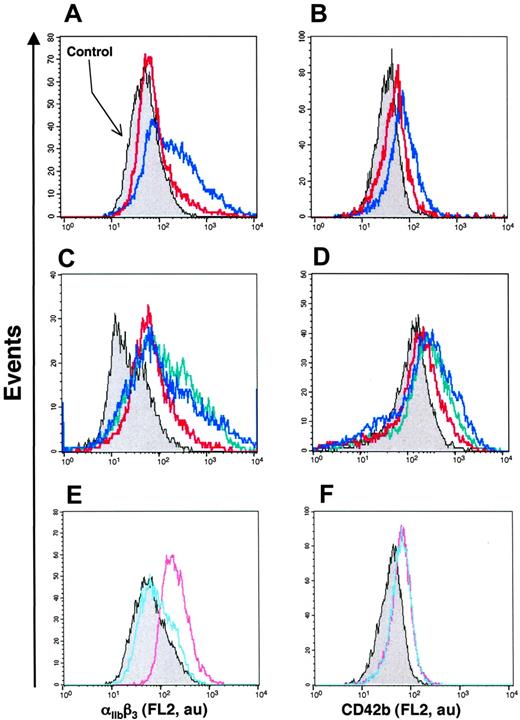
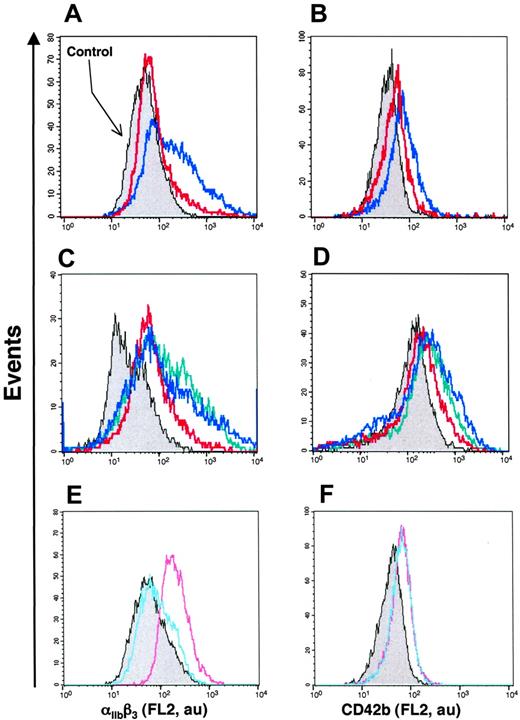
Up to now, investigations of the role of Hh morphogens in cell differentiation have been performed by using nonmembranous recombinant Hh proteins or by blocking the Hh pathway with the neutralizing antibody 5E130 or with the Smo receptor antagonist cyclopamine.37 However, the effect of membrane-bound Hh has not been studied in hematopoietic cells. To assess whether Hh indeed participates in the response induced by MV, K562 cells were preincubated in the presence of these 2 Hh signaling pathway blockers and then stimulated by Hh+ MVs generated by PHA/PMA/act D treatment. The level of differentiation induced by MVs was significantly reduced in the presence of cyclopamine (Figure 4A-B; Table 2). The effect of cyclopamine was concentration dependent, being maximal at 30 μM (not shown). Expression of both markers of megakaryocytic differentiation was also significantly reduced after 72 hours of incubation with 5E1 neutralizing antibody, but not with the isotype 9E10 matched control antibody (Table 2 and not shown). Hh+ MV-induced cell differentiation was also reduced by anti-Smo serum (1:150, directed to mouse Smo) but not in the presence of the preimmune serum (Figure 4C-D; Table 2). In addition, the anti-Smo serum significantly reduced the increase of αIIbβ3 or CD42b expression induced by PHA/act D-generated Hh+ MV (Table 2).
Effect of MV generated under different conditions of stimulation on the expression of megakaryocytic differentiation markers by K562 cells. MVs were obtained from CEM T cells treated with either medium (control) or PHA (A), PMA (B), act D (C-D), and added at the indicated concentration to K562-cell culture. After 72 hours of treatment, expression of αIIbβ3 or CD42b was analyzed by flow cytometry, and morphology was examined by phase-contrast microscopy (original magnification, ×100). In panels A-C results are expressed as the mean ± SEM (error bars).
Effect of MV generated under different conditions of stimulation on the expression of megakaryocytic differentiation markers by K562 cells. MVs were obtained from CEM T cells treated with either medium (control) or PHA (A), PMA (B), act D (C-D), and added at the indicated concentration to K562-cell culture. After 72 hours of treatment, expression of αIIbβ3 or CD42b was analyzed by flow cytometry, and morphology was examined by phase-contrast microscopy (original magnification, ×100). In panels A-C results are expressed as the mean ± SEM (error bars).
To determine whether MV-induced differentiation is mediated by activation of the PKA pathway associated with Hh signaling, K562 cells were treated with 2 PKA inhibitors, H-89 or KT5720. The effect of Hh+ MVs on αIIbβ3 expression was abolished or partially reduced in the presence of H-89 or KT5720, respectively, whereas CD42b expression was more moderately but still significantly reduced in the presence of PKA inhibitors (Table 2).
We have also analyzed the effect of SAG, a recently identified chlorobenzothiophene-containing Smo agonist that activates the Hh pathway.31 In the presence of SAG, the expression of both markers of megakaryocytic differentiation was increased (Figure 4E-F) indicating once again activation of the Hh pathway. These results and those obtained with cyclopamine and neutralizing antibody suggest that Hh+ MVs are vectors of the Hh-borne differentiation message and provide an indication of a rational mechanism of transfer of membranous Hh to undifferentiated tissues.
Hh+ MVs induce changes in the cell cycle
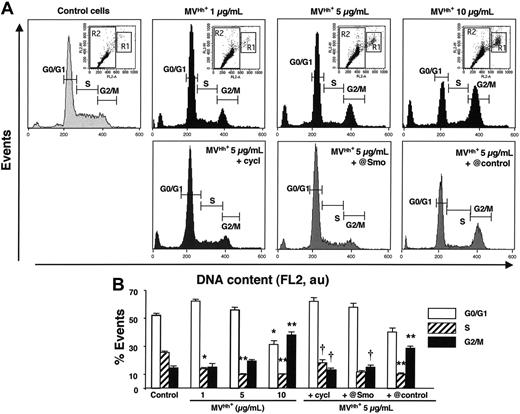
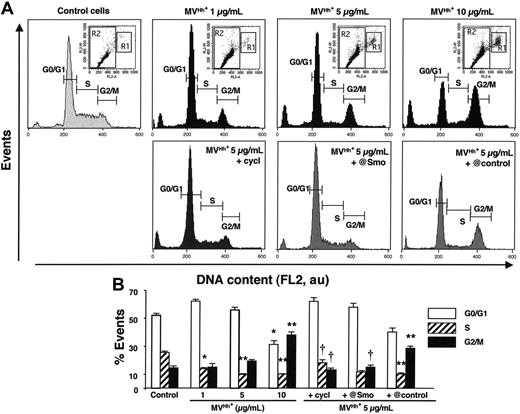
The effect of Hh on proliferation and differentiation can be explained, at least in part, by modifications of the cell cycle at different levels. In the present study, Hh+ MVs caused a significant and concentration-dependent decrease of the K562-cell population in S phase, whereas the proportion of cells in G2/M phase was increased compared to that of control cells (Figure 5). To establish whether these changes are mediated by Hh, asynchronous K562 cells were treated with either cyclopamine or anti-Smo serum. When compared to control cells, the inhibition of the Hh pathway led to similar patterns in the cell cycle, with a larger proportion of cells in S phase and fewer cells in G2/M phase (Figure 5), with no effect of the preimmune serum. When MVs were generated from PHA- or PMA-stimulated lymphocytes, no change on cell cycle was observed (Table 3). In contrast, MVs obtained from PHA/act D-treated lymphocytes were responsible for an accumulation of cells in G0/G1 phase, whereas the proportion of cells in S or G2/M phase declined. This indicates that MV treatment resulted in an antiproliferative effect by inducing arrest in G1, and this effect was not inhibited by the anti-Smo serum (Table 3). Hence, MVs generated from PHA/act D–treated lymphocytes induced Hh-dependent differentiation but Hh-independent cell-cycle changes, pointing to other MV constituents to be identified.
Modulation of the Hh pathway modifies the level of differentiation of K562 cells. (A-D) Cells were treated for 72 hours with either medium (control, gray) or 5 μg/mL MVs generated from PHA/PMA/act D-treated CEM T cells in the absence (blue trace) or in the presence of either 30 μM cyclopamine (red trace, A-B), 1:150 anti-Smo (red trace, C-D), or 1:150 preimmune sera (green trace, C-D). (E, F) Cells were treated with medium (gray), 1 nM (blue trace), or 3 nM (red trace) SAG (agonist of Smo) for 72 hours. Detection of αIIbβ3 and CD42b expression was performed by flow cytometry after labeling by the corresponding antibody. Fluorescence (FL2, red fluorescence channel intensity) is expressed in arbitrary units (au). Data are representative of 8 experiments yielding similar results.
Modulation of the Hh pathway modifies the level of differentiation of K562 cells. (A-D) Cells were treated for 72 hours with either medium (control, gray) or 5 μg/mL MVs generated from PHA/PMA/act D-treated CEM T cells in the absence (blue trace) or in the presence of either 30 μM cyclopamine (red trace, A-B), 1:150 anti-Smo (red trace, C-D), or 1:150 preimmune sera (green trace, C-D). (E, F) Cells were treated with medium (gray), 1 nM (blue trace), or 3 nM (red trace) SAG (agonist of Smo) for 72 hours. Detection of αIIbβ3 and CD42b expression was performed by flow cytometry after labeling by the corresponding antibody. Fluorescence (FL2, red fluorescence channel intensity) is expressed in arbitrary units (au). Data are representative of 8 experiments yielding similar results.
Hh+ MVs increase megakaryocytic differentiation of CD34+ cells
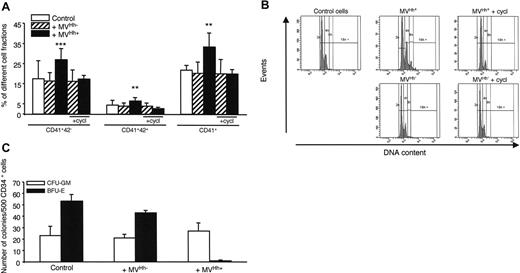
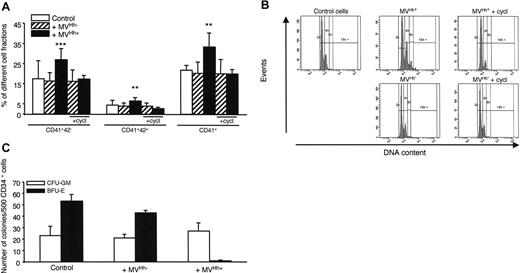
To confirm the results concerning K562 cells, we have performed experiments with CD34+ human primary megakaryoblast cells. Treatment of CD34+ cells derived from cord blood cells with 5 μg/mL Hh+ MVs generated from PHA/PMA/act D-treated lymphocytes increased the expression of CD41 compared to cells treated with Hh– MVs. In addition, Hh+ MVs led to a high increase in the megakaryocyte populations expressing the CD41+CD42– and CD41+CD42+ markers (Figure 6A). This was also observed with CD34+ cells from leukapheresis (not shown). At this concentration, Hh+ MVs and Hh– MVs evoked a decrease of proliferation, probably due to cytotoxic effect. In addition, cyclopamine consistently decreased expression of CD41 and CD42 surface markers (Figure 6A). Above 30 μM, cyclopamine turned toxic toward CD34+ cells, explaining why it was used at 15 μM. H-89 exerted a comparable inhibition to that noticed with cyclopamine, when also present at subtoxic concentration (1 μM; not shown).
Experiments were performed to determine the effect of Hh+ MVs on polyploidy of CD34+ cells derived from cord blood cells. Interestingly, Hh+ MVs, but not Hh– MVs, were able to increase the population with a more than than 4N DNA content (mean ploidy 3.5 for Hh+ MVs versus 2.8 for Hh– MVs). In addition, cyclopamine reversed this effect (Figure 6B).
To investigate the effects of Hh+ MVs on other hematopoietic progenitors, the growth of CFU-GM– and BFU-E–derived colonies from peripheral blood CD34+ cells was examined. As shown in Figure 6C, expansion of CFU-GM–derived colonies was not significantly affected by Hh+ MVs, whereas the growth of BFU-E–derived colonies was completely abolished indicating that Hh+ MVs suppressed the expansion of erythroid progenitors. This effect was probably Hh independent because it was not affected by the Hh inhibitor cyclopamine, given the fact that the latter could not be used at its optimal inhibitory concentration (not shown). As described, Hh– MVs did not produce any change in the CFU-GM– and BFU-E–derived colony expansion (Figure 6C).
Circulating and lymphocytic human Hh+ MVs induce megakaryocytic differentiation
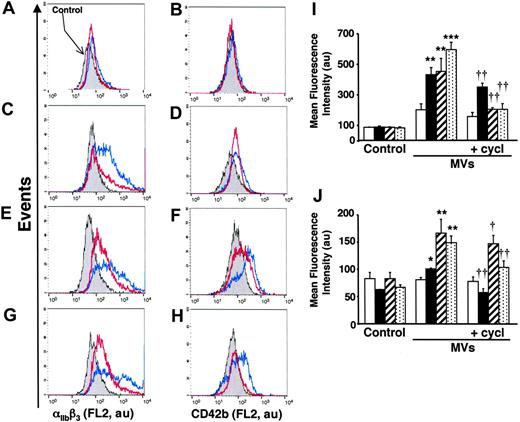
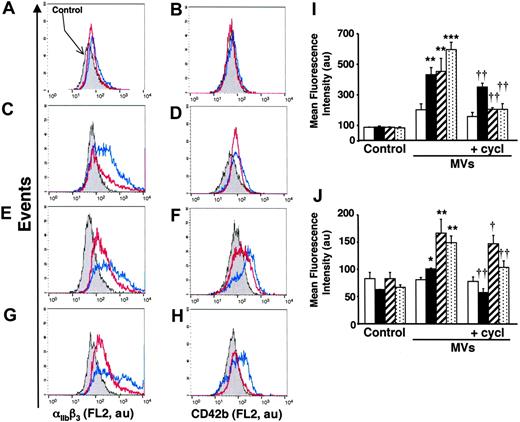
To evaluate the in vivo significance of MVs in the transfer of Hh morphogen message, MVs circulating in healthy volunteers and diabetic patients were isolated. As shown in Figure 1B, such MVs harbor Hh proteins. Because diabetic patients have about a 2.5-fold elevated level of circulating MVs,25 K562 cells were treated with either 2 or 5 μg/mL MVs from healthy volunteers and diabetic patients, respectively. Under these conditions, we have observed that in vivo MVs from healthy volunteers induced a weaker increase of cell-surface expression of αIIbβ3 and CD42b in K562 cells than those from diabetic patients. Again, cyclopamine reversed the differentiation effect elicited by both types of MVs (Figure 7A-D,I-J). Altogether, these results indicate that circulating human MVs can induce differentiation through the Hh pathway.
In another set of experiments, we analyzed the effect of isolated MVs generated by PHA/PMA/act D treatment of lymphocytes from either diabetic or healthy subjects (Figure 7E-H,I-J). Whereas the increase of CD42b expression was similar in K562 cells treated with both types of MVs, lymphocyte-derived MVs from diabetic individuals evoked a higher increase of αIIbβ3 expression than MVs from healthy individuals. This difference, dependent on the origin of MVs, is probably due to weaker expression of Hh in isolated MVs generated by PHA/PMA/act D treatment of lymphocytes from healthy volunteers (Figure 1B). In addition, the differentiation induced by MVs generated by PHA/PMA/act D treatment of lymphocytes from diabetic patients or healthy volunteers was also inhibited by cyclopamine (Figure 7E-H,I-J), confirming the involvement of the Hh pathway. Likewise MVs generated from act D-treated CEM T cells and MVs from act D-treated lymphocytes from healthy or diabetic individuals did not harbor Hh (Figure 1B) and had no effect on the expression of either αIIbβ3 or CD42b at the surface of K562 cells (not shown).
Changes in cell-cycle distribution of K562 cells induced by modulation of the Hh pathway. Cells growing asynchronously were preincubated for 30 minutes in the presence of medium (control), 30 μM cyclopamine (cycl), anti-Smo (@Smo; 1:150) or preimmune (@control; 1:150) sera, and treated with MVs generated from PHA/PMA/act D-treated CEM T cells (Hh+ MVs) for 72 hours, and were then stained with propidium iodide. Cell cycle was analyzed by flow cytometry. (A) Histograms represent the content of R2 gates corresponding to subpopulation with less than 4N DNA content as shown in inset dot plots. Dot plots were displayed as FL2-A versus FL2-W to show nuclei doublets. R1 and R2 gates correspond to populations with more than 4N and less than 4N DNA content, respectively. Fluorescence (FL2, red fluorescence channel intensity) is expressed in arbitrary units (au). Seven experiments yielding similar results were performed. (B) Histograms representing the mean (± SEM) of number of events reflecting each cycle phase of cells preincubated for 30 minutes in the presence of medium (control), 30 μM cyclopamine (cycl), anti-Smo (@Smo; 1:150) or preimmune (@control; 1:150) sera and treated with MVs generated from PHA/PMA/act D-treated CEM T cells (Hh+ MVs) for 72 hours. *P < .05, **P < .01, significantly different from nontreated control cells; †P < .05, significantly different from 5-μg/mL MV-treated cells.
Changes in cell-cycle distribution of K562 cells induced by modulation of the Hh pathway. Cells growing asynchronously were preincubated for 30 minutes in the presence of medium (control), 30 μM cyclopamine (cycl), anti-Smo (@Smo; 1:150) or preimmune (@control; 1:150) sera, and treated with MVs generated from PHA/PMA/act D-treated CEM T cells (Hh+ MVs) for 72 hours, and were then stained with propidium iodide. Cell cycle was analyzed by flow cytometry. (A) Histograms represent the content of R2 gates corresponding to subpopulation with less than 4N DNA content as shown in inset dot plots. Dot plots were displayed as FL2-A versus FL2-W to show nuclei doublets. R1 and R2 gates correspond to populations with more than 4N and less than 4N DNA content, respectively. Fluorescence (FL2, red fluorescence channel intensity) is expressed in arbitrary units (au). Seven experiments yielding similar results were performed. (B) Histograms representing the mean (± SEM) of number of events reflecting each cycle phase of cells preincubated for 30 minutes in the presence of medium (control), 30 μM cyclopamine (cycl), anti-Smo (@Smo; 1:150) or preimmune (@control; 1:150) sera and treated with MVs generated from PHA/PMA/act D-treated CEM T cells (Hh+ MVs) for 72 hours. *P < .05, **P < .01, significantly different from nontreated control cells; †P < .05, significantly different from 5-μg/mL MV-treated cells.
Discussion
The Hh pathway plays a major role not only during embryonic development but also in the differentiation and self-renewal of a large variety of cell types in adults, such as immune and hematopoietic cells.9,10,38-40 Here we show that the long-range Hh signal can be mediated by MVs. Membrane-bound Hh (Hh+ MVs) induce cell differentiation and this effect is directly mediated by the Hh pathway as illustrated by the reduction of expression of αIIbβ3 and CD42b of K562 and primary CD34+ cells in the presence of inhibitors of Hh receptor or cascade.
The concentrations of MVs used here are in the range of those able to promote stimulation of endothelial invasion,41 suggesting that low concentrations of MVs can elicit physiologic response. In addition, only MVs generated from PHA/PMA/act D–stimulated cells—that is, Hh+ MVs—induced K562 and primary CD34+ cell differentiation, whereas MVs generated from apoptotic act D-treated lymphocytic cells, that is, Hh– MVs, had no effect on K562 or CD34+ cell differentiation. Nevertheless, these observations suggest that the release of surface markers on MVs depends on the stimulus at their origin, and the response they elicit in target cells may vary accordingly.28 In addition, the fact that MVs harboring Hh+ increase differentiation and polyploidy of primary CD34+ megakaryocytic cells represents a genuine physiologic model, of course, supporting the results obtained with K562 cells. Abolition of erythroid colony formation in the presence of Hh+ MVs, concomitantly with the increased expression of αIIbβ3 and CD42b in megakaryocytic populations of CD34+ cells, emphasizes the effect of MVs on megakaryocytic differentiation.
The reduction of the effect of Hh+ MVs on K562-cell differentiation on inhibition of Hh signaling by cyclopamine, 5E1, or anti-Smo antibodies suggests that Hh molecules bound to membrane-derived MVs are active and induce intracellular responses in target cells probably after ligand/receptor interaction. Furthermore, a reduction of the differentiation potential of Hh+ MVs toward primary CD34+ cells from umbilical cord blood and from peripheral blood (not shown) was also observed in the presence of cyclopamine. Recently, it has been shown that Hh signaling requires activation of PKA and casein kinase I (CKI) pathways.42 The inhibition observed here in the presence of H-89 or KT5720 on αIIbβ3 and CD42b expression suggests that the effect of Hh+ MVs on K562 and CD34+ cell differentiation is mediated through the activation of the PKA pathway. The stronger inhibition elicited by H-89 could be related to its ability to inhibit both PKA and CKI enzymes, whereas that of KT5720 is more specific for PKA.
Effect of MVs on primary CD34+ cell differentiation and colony formation. (A) CD34+ cells were purified from blood cord samples and incubated with either medium (control), or 5 μg/mL MVs generated from act D-treated (MVHh–) or PHA/PMA/act D-treated (MVHh+) CEM T cells, in the absence or in the presence of cyclopamine (cycl, 15 μM). After 6 days of exposure to MVs, cells were triple-stained and sorted on different fractions according to CD34, CD41, and CD42 expression analyzed by flow cytometry.32 Three experiments yielding similar results were performed, values are expressed as mean ± SEM (bars). **P < .01, ***P < .001, significantly different from MVHh–-treated cells. (B) CD34+ cells were obtained as previously described and then incubated with either medium (control), or 5 μg/mL MVHh– or MVHh+, in the absence or in the presence of cyclopamine. Polyploidization of CD34+ cells was measured by flow cytometry. (C) CFU-GM and BFU-E colony formation from peripheral blood CD34+ cells. CD34+ cells were plated in methylcellulose in the presence of a combination of SCF, IL-6, IL-3, and erythropoietin (Epo) for 12 days. Colonies were scored under an inverted microscope. All results are expressed per 500 CD34+ cells.
Effect of MVs on primary CD34+ cell differentiation and colony formation. (A) CD34+ cells were purified from blood cord samples and incubated with either medium (control), or 5 μg/mL MVs generated from act D-treated (MVHh–) or PHA/PMA/act D-treated (MVHh+) CEM T cells, in the absence or in the presence of cyclopamine (cycl, 15 μM). After 6 days of exposure to MVs, cells were triple-stained and sorted on different fractions according to CD34, CD41, and CD42 expression analyzed by flow cytometry.32 Three experiments yielding similar results were performed, values are expressed as mean ± SEM (bars). **P < .01, ***P < .001, significantly different from MVHh–-treated cells. (B) CD34+ cells were obtained as previously described and then incubated with either medium (control), or 5 μg/mL MVHh– or MVHh+, in the absence or in the presence of cyclopamine. Polyploidization of CD34+ cells was measured by flow cytometry. (C) CFU-GM and BFU-E colony formation from peripheral blood CD34+ cells. CD34+ cells were plated in methylcellulose in the presence of a combination of SCF, IL-6, IL-3, and erythropoietin (Epo) for 12 days. Colonies were scored under an inverted microscope. All results are expressed per 500 CD34+ cells.
Effect of MVs from healthy and diabetic individuals on differentiation of K562 cells. (A-D) Cells were treated for 72 hours with medium (control, gray) or in vivo circulating MVs from healthy (2 μg/mL; A-B) or diabetic individuals (5 μg/mL; C-D) respectively, in the absence (blue trace) or presence of 30 μM cyclopamine (red trace). (E-H) Cells were treated for 72 hours with medium (gray) or 5 μg/mL MVs generated from PHA/PMA/act D-treated lymphocytes from healthy (E-F) or diabetic individuals (G-H) in the absence (blue trace) or presence of 30 μM cyclopamine (red trace). Detection of αIIbβ3 and CD42b expression was performed by flow cytometry after labeling by the corresponding antibody. Fluorescence (FL2, red fluorescence channel intensity) is expressed in arbitrary units (au). Data are representative of 4 experiments yielding similar results. (I-J) Histograms representing the increase of mean fluorescence intensity (± SEM) reflecting the expression level of αIIbβ3 (I) and CD42b (J), in control cells, or in cells treated with circulating MVs from healthy (2 μg/mL, white bars) or diabetic individuals (5 μg/mL, black bars) or 5 μg/mL MVs generated from PHA/PMA/act D–treated lymphocytes from healthy (hatched bars) or diabetic individuals (dotted bars) in the absence or presence of 30 μM cyclopamine (cycl). *P < .05, **P < .01, ***P < .001, significantly different from nontreated control cells; †P < .05, ††P < .01, significantly different from MV-treated cells.
Effect of MVs from healthy and diabetic individuals on differentiation of K562 cells. (A-D) Cells were treated for 72 hours with medium (control, gray) or in vivo circulating MVs from healthy (2 μg/mL; A-B) or diabetic individuals (5 μg/mL; C-D) respectively, in the absence (blue trace) or presence of 30 μM cyclopamine (red trace). (E-H) Cells were treated for 72 hours with medium (gray) or 5 μg/mL MVs generated from PHA/PMA/act D-treated lymphocytes from healthy (E-F) or diabetic individuals (G-H) in the absence (blue trace) or presence of 30 μM cyclopamine (red trace). Detection of αIIbβ3 and CD42b expression was performed by flow cytometry after labeling by the corresponding antibody. Fluorescence (FL2, red fluorescence channel intensity) is expressed in arbitrary units (au). Data are representative of 4 experiments yielding similar results. (I-J) Histograms representing the increase of mean fluorescence intensity (± SEM) reflecting the expression level of αIIbβ3 (I) and CD42b (J), in control cells, or in cells treated with circulating MVs from healthy (2 μg/mL, white bars) or diabetic individuals (5 μg/mL, black bars) or 5 μg/mL MVs generated from PHA/PMA/act D–treated lymphocytes from healthy (hatched bars) or diabetic individuals (dotted bars) in the absence or presence of 30 μM cyclopamine (cycl). *P < .05, **P < .01, ***P < .001, significantly different from nontreated control cells; †P < .05, ††P < .01, significantly different from MV-treated cells.
The effect of Hh on proliferation and differentiation can be explained, at least in part, by modifications of the cycle at different levels. In this respect, several studies have proposed a role for the Shh pathway on cell-cycle regulation.43-45 In the present study, Hh+ MVs caused a significant and concentration-dependent decrease of the K562 cell population in S phase, whereas the proportion in G2/M phase was increased compared to that of control cells (Figure 5). Although, this could indicate that MVs facilitate the progression from S to G2/M phase, 2 pieces of evidence suggest that it is attributable to the existence of a subpopulation of polyploid cells. In addition to the aberrantly broad G2/M peak, probably corresponding to a mix of diploid cells in G2/M and tetraploid cells in G0/G1 phases, cytometric dot plots revealed a small but distinct population of cells with a more than 4N DNA content (G2/M), indicative of tetraploid cells in G2/M or octaploid cells in G1 phases (Figure 5 insets). Indeed, this is a characteristic of megakaryocytic differentiation. Immature megakaryocytes thus increase ploidy to a more than 2N DNA content in the absence of cell division by a process termed endomitosis, leading to the formation of giant cells, the mature megakaryocytes, which give rise to platelets.46 In contrast, Hh– MVs were responsible for an accumulation of cells in G0/G1 phase, whereas the proportion of cells in S or G2/M phase declined, and no endomitosis was observed.
In several disorders, mainly cardiovascular22,47 and immune pathologies,19 circulating levels of MVs are enhanced. For instance, in diabetes, an increased vesiculation process in peripheral blood has been described.25 In particular, the proportion of leukocytic MVs was increased about 2.5 fold, whereas that of platelet- or endothelial-derived MVs was not modified. Moreover, it has been shown that the Hh pathway plays a role in pancreas development and in the insulin gene expression, in tumor development in pancreatic cancer, and in diabetes.48-52 Here, circulating MVs from diabetic patients and MVs from PHA/PMA/act D-stimulated lymphocytes from the same patients harbored Hh morphogens and induced K562-cell differentiation, probably through the Hh pathway, because cyclopamine reduced this effect. Although we cannot completely exclude the fusion of MVs with target cells and the subsequent transfer of αIIbβ3 and CD42b from circulating platelet-derived MVs, the increase of expression of both markers in K562 cells treated with circulating MVs from diabetic patients was strongly inhibited in the presence of the Hh pathway inhibitor cyclopamine. This suggests that Hh molecules bound to membrane-derived MVs are active and induce intracellular responses in target cells probably after ligand/receptor interaction independently of fusion of MVs of platelet origin. Furthermore, the effect of circulating MVs from healthy individuals was weak, whereas that of circulating MVs from diabetic patients and those generated from T lymphocytes from healthy or diabetic patients was stronger. One explanation for the different efficacy of MVs can be related to the different global MV composition in function of the stimulus at their origin. This in vivo insight, although with no epidemiologic implication, highlights the potential significance of MVs in physiology and pathology.
In conclusion, the present findings substantiate the view of MVs stemming from the plasma membrane of apoptotic/stimulated cells as true vectors in the transfer of biologic information borne by particular ligands they may harbor, Hh here. Membrane MVs are detected in healthy humans or those with disease,19,22,23,47 reflecting a normal or disrupted balance between cell proliferation, stimulation, and death. It can therefore be speculated that their variations are interpreted by various neighboring or remote tissues, including stem or mature cells, to elicit an appropriate response for the maintenance or restoration of homeostasis. On the other hand, Hh+ MVs could also participate in the activation of the Hh signaling pathway associated with tumorigenesis.53,54 Indeed, recently several studies have shown the potential role of MVs on cancer development.55-57 Hence, a productive hypothesis consists in considering MVs as ubiquitous key actors in tissue regeneration loops involving evolutionary conserved signaling pathways, which can turn adverse when proliferation of abnormal cells is promoted.
During the revision process, Tanaka et al58 reported that vesicular release of Shh is critical for left-right determination in mouse embryos. They termed “nodal vesicular parcels” carrying Shh the small membrane fragments that were released and unidirectionally transported leftward by the nodal flow. This strongly supports our hypothesis that MVs represent true vectors in the transfer of biologic information.
Prepublished online as Blood First Edition Paper, June 20, 2006; DOI 10.1182/blood-2006-04-019109.
Supported by institutional grants from INSERM, Université Louis Pasteur, and CNRS. An Inside Blood analysis of this article appears at the front of this issue.
The publication costs of this article were defrayed in part by page charge payment. Therefore, and solely to indicate this fact, this article is hereby marked “advertisement” in accordance with 18 U.S.C. section 1734.
We thank Drs A. Mann and A. Schoenfelder, (CNRS UMR 7081, Strasbourg, France) for SAG, H. Faure and E. Traiffort for antibody to Shh, K. Williams (Biogen, Cambridge, MA) for 5E1 and 9E10 monoclonal antibodies, and Pr J. L. Pasquali for providing blood samples. We want to express our gratitude to D. Meyer for support and advice.

