Abstract
Myelodysplastic syndromes (MDS) are characterized by ineffective hematopoiesis with potential for progression to acute myeloid leukemia (AML). We compared natural killer (NK) cytolytic function in 48 MDS patients with 37 healthy donors and found reduced activity in the patient population (K562 cytolysis, 19% ± 21% SD versus 40% ± 17%) (P < .001). NK cytotoxicity in MDS patients was reduced against 3 disparate tumor targets with differential activating receptor requirement, suggesting global defects in NK function. Reduced NK function in MDS was significantly associated with higher International Prognostic Score (P = .01), abnormal karyotype (P = .05), the presence of excess blasts (P = .01), and age-adjusted bone marrow hypercellularity (P = .04). MDS patients had a display of the activating receptor NKp30, and NKG2D down-regulation closely correlated with impaired NK function (P = .001). NKG2D ligands (MICA and MICB) were expressed on CD34+ cells from bone marrow of 30% of MDS patients and a leukemic cell line derived from an MDS patient (MDS1). Collectively, these findings suggest that impairment of NK cytolytic function derives in part from reduced activating NK receptors such as NKG2D in association with disease progression. Evasion of NK immunosurveillance may have importance for MDS disease progression.
Introduction
The myelodysplastic syndromes (MDS) are stem cell malignancies that display hematologic heterogeneity but share features of ineffective hematopoiesis and a potential for progression to acute myeloid leukemia (AML).1,2 Multiple factors have been implicated in the pathogenesis of MDS, including cytogenetic and molecular abnormalities and disturbance in cellular immunity. Abnormal natural killer (NK) function, including reduced antibody-dependent cell cytotoxicity (ADCC) and diminished direct NK cell cytolytic function, have been previously described; however, the biologic mechanisms underlying these changes have not be defined.3–7 Normal NK cells, γδ T cells, and some αβ T cells mediate their biologic action through 3 families of NK receptors: killer cell immunoglobulin-like receptors (KIRs), C lectin–like (NKG2) family receptors, and natural cytotoxicity receptors ([NCRs] eg, NKp30, NKp44, and NKp46).8 Regulation of innate immunity occurs through balanced signaling by these families of NK receptors with activating and inhibitory function.9–11 Constitutively expressed activating receptors such as NKp46 and NKp30 along with NKG2D mediate most non–major histocompatibility complex (non-MHC)–induced tumor-specific cytotoxicity by NK cells, and the activation-restricted NCR (NKp44) increases NK cytotoxicity after cytokine activation.12 Although many NK receptors with both activating and inhibitory function have been identified and details of their downstream signaling pathways have been elucidated, a void exists in the identification of activatory NK ligands and the pathologic situations in which they are induced in tumor and virally infected cells. The best-characterized NK receptor ligands are the stress-inducible MHC class I–related chain A (MICA), MICB, and UL16-binding proteins (ULBPs), which constitute the major cellular ligands for human NKG2D.13–17 In addition to viral-induced expression, NKG2D ligands are often expressed by tumor cells.18,19 Ligands for NKp30, NKp44, and NKp46 have not yet been delineated
In MDS, the pathogenesis and clinical implications of reduced NK cytotoxicity is unknown. Because morphologic and prognostic classifications allow segregation of patients according to disease risk, we investigated whether NK function correlated with clinical outcome and examined cellular abnormalities contributing to impaired NK cytotoxicity in patients with MDS. Our findings provide important insight into the mechanism of cellular immune dysfunction in patients with MDS and suggest a possible effector role for NK cells in disease immunosurveillance.
Patients, materials, and methods
Patient samples and healthy controls
MDS patients older than 18 years of age who provided signed informed consent in accordance with the Declaration of Helsinki and approved by the University of South Florida Institutional Review Board were enrolled in the study. Patients were categorized according to World Health Organization (WHO) category, age, sex, International Prognostic Scoring System (IPSS) score, and cytogenetics.20 We obtained 40 mL peripheral blood in sodium heparin tubes. Studies on peripheral blood of healthy individuals ages 55 to 85 were performed from buffy coats obtained from the Southwest Florida Blood Services, St Petersburg, FL. Bone marrow was obtained from selected MDS patients (1 to 2 mL) enrolled in the study, and bone marrow from healthy volunteers was purchased from Cambrex (Gaithersburg, MD). Peripheral blood mononuclear cells (PBMCs) and bone marrow mononuclear cells (BMCs) were isolated from patients and healthy donors by Ficoll-Hypaque gradient centrifugation, as previously described.21
Flow cytometry
NK receptor expression was determined in paired healthy and patient PBMCs by 3-color flow cytometry analysis, as described previously.22 NK receptor antibodies included in the analysis were phycoerythrin (PE) conjugates of anti-CD158a (KIR2DL1, KIR2DS1), anti-CD158b (KIR2DL2, KIR2DL3, KIR2DL3), anti-NKB1 (KIR3DL1), anti-KARp50 (KIR2DS4), anti-NKG2A, anti-NKG2D, anti-NKp30, anti-NKp44, and anti-NKp46, which were all obtained from BD Biosciences (San Diego, CA). For analysis of NKG2D ligands on CD34+ cells from bone marrow, and on K562 cells, MDS1 cells, 721.221 cells, and HL-60 cells, an antibody specific to MICA, MICB, or isotype controls was used and then, after washing, stained with goat anti–mouse PE conjugate as a secondary reagent, as previously described.23 Specific fluorescence indices (SFIs) of NKG2D ligand staining were calculated by dividing median fluorescences obtained with the respective specific monoclonal antibody (mAb) by median fluorescences obtained with the corresponding isotype control.23
Cytotoxicity assays
Cytotoxicity assays were performed as previously described using 5-hour 51Cr-release assays.21 Assays were not performed on frozen blood due to variable loss in NK activity after thawing. PBMCs and tumor targets were mixed at effector-target (E/T) ratios of 50:1, 25:1, 12:1, and 6:1, and the percentage of specific lysis (51Cr release) was determined by the following equation: [(experimental cpm − spontaneous cpm)/total cpm incorporated] × 100, where cpm indicates count per minute. All experiments were performed in triplicate, and the standard deviation (SD) usually accounted for approximately 5% of the mean or less. The MDS1 cell line served as one target in these reactions. This cell line was originally derived from an MDS patient with a trisomy 21 karyotype and coexpresses CD34 and the more mature myeloid marker CD15.24 In some experiments, purified CD56+ NK cells were obtained from buffy coats of healthy individuals by a negative selection process using RosetteSep, as recommended by the manufacturer (Stem Cell Separation Systems, Vancouver, BC, Canada). We found that 90% to 98% of the cells isolated in both healthy and MDS patients stained positively with anti-CD56 antibody with less than 1% CD3+ T cells and less than 5% CD19+ B cells and 0.1% CD15+ myeloid cells (data not shown).21 Dysplastic myeloid cells in the bone marrow are occasionally positive for CD56. CD56 was not expressed on myeloid cells in the peripheral blood of MDS patients. In some assays, NK tumor cell lines NK92 and NKL or PBMCs were cultured with 100 IU/mL IL-2–containing medium were used as effector cells.25
Statistical analysis
To assess the relationships between clinical parameters, Spearman correlation coefficients were calculated for all pairwise combinations of the continuous variables measured (age, hemoglobin, white blood cell count, lymphocyte count, platelet count, and NK killer cytotoxicity). Mean and standard deviations for NK killing cytoxicity were obtained by categorical variables (sex, age at blood draw [less than 61 years versus 61 years or more]), MDS subtype, IPSS risk group, karyotype, and age-adjusted bone marrow cellularity (hypocellular versus normal versus hypercellular). The NK function was compared between MDS cases and healthy controls in Figure 1A using the Wilcoxon rank sum test to account for the nonnormal distributions of NK function. Among healthy individuals, it is unclear whether relatively high levels of NK function confer any biologic advantage. Examining the extreme lower end of the distribution is more clinically meaningful for comparisons across patient characteristics. Therefore, NK function was dichotomized so that the prevalence of extremely low NK function among patient subgroups could be expressed. The distribution of NK killing was determined for the 37 healthy controls, and the value corresponding to the lowest 5% was designated as the dichotomous cut point for “low” (group A) versus “normal” (group B) NK killing. This cut point (NK killing cytotoxicity, 13%) was applied to the NK killing values for MDS cases, and the proportions of individuals with low versus normal NK killing were compared between MDS cases and healthy controls using the Fisher exact test. Associations between low versus high NK killing cytotoxicity and the categorical clinical variables were assessed using the χ2 test statistic, or the Fisher exact test was used when cells contained fewer than 5 patients. All tests were performed at the 2-sided .05 significance level. All statistical analyses were performed using SAS (version 9.1).
Results
Patients and healthy controls
Fifty-three MDS patients were enrolled in the study, and NK function was evaluated in 48 patients. Four patients with chronic myelomyonocytic leukemia (CMML), previously included in the French-American-British (FAB) classification, were excluded from the analysis, and one patient's diagnosis of MDS could not be confirmed. MDS patient data were compared with results from investigations of 37 healthy controls. Demographic features of the MDS patients are summarized in Table 1. Ages of healthy donors ranged from 55 to 85 years.
Impaired NK cytotoxicity in MDS
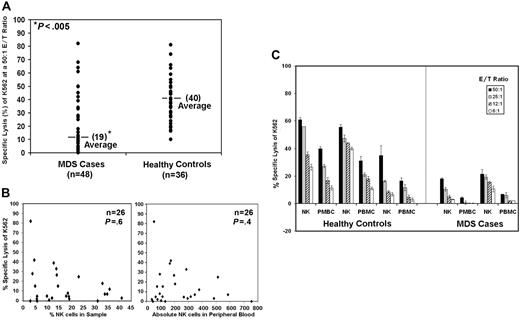
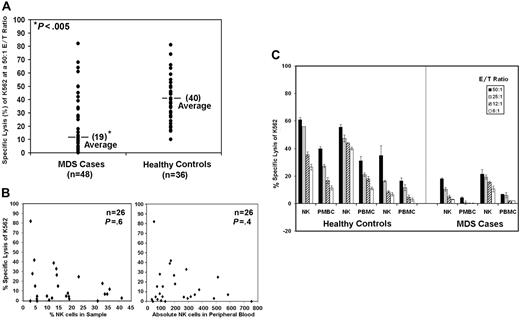
We examined K562 cytotoxicity by PBMCs from 48 MDS patients and 37 healthy donors. K562 is an MHC class I–deficient erythroleukemia cell line that displays sensitivity to freshly isolated human NK cells. NK lytic function was assessed in healthy controls and patients using 6:1, 12:1, 25:1, and 50:1 effector-target (E/T) cell ratios. Results at only the 50:1 E/T ratio are shown in Figure 1A. We found that lysis of K562 was significantly reduced (19% ± 21% SD) in MDS patients compared with healthy donors (40% ±17% SD) (Figure 1A; P < .001 using the nonparametric Wilcoxon rank sum test). Because of low cytotoxicity at the highest ratio, 50:1 E/T ratio, this ratio was chosen for further analyses.
K562 lysis is reduced in patients with MDS by direct cytotoxicity of target cells. Results are shown for 5-hour 51Cr-release assays using K562 as a target. (A) The graphic representation of the percent specific lysis at a 50:1 E/T ratio is shown using normal PBMCs (n = 37) and PBMCs from patients with MDS (n = 48). (B) Percent specific lysis of K562 at a 50:1 E/T ratio versus percentage of NK cells in the sample for 26 patients and the percent specific lysis of K562 at a 50:1 E/T ratio versus the absolute number of NK cells in the peripheral blood. (C) Percent specific lysis by highly enriched NK cells (NK) and PBMCs at 50:1, 25:1, 12:1, and 6:1 E/T ratios are shown from 3 healthy controls and 2 MDS patients. Samples used for these assays were never frozen. The graphs represent the average of triplicate samples; standard deviation is indicated by the error bars, and the asterisks represent statistical significance at P ≤ .001 as determined by the nonparametric Wilcoxon rank sum test.
K562 lysis is reduced in patients with MDS by direct cytotoxicity of target cells. Results are shown for 5-hour 51Cr-release assays using K562 as a target. (A) The graphic representation of the percent specific lysis at a 50:1 E/T ratio is shown using normal PBMCs (n = 37) and PBMCs from patients with MDS (n = 48). (B) Percent specific lysis of K562 at a 50:1 E/T ratio versus percentage of NK cells in the sample for 26 patients and the percent specific lysis of K562 at a 50:1 E/T ratio versus the absolute number of NK cells in the peripheral blood. (C) Percent specific lysis by highly enriched NK cells (NK) and PBMCs at 50:1, 25:1, 12:1, and 6:1 E/T ratios are shown from 3 healthy controls and 2 MDS patients. Samples used for these assays were never frozen. The graphs represent the average of triplicate samples; standard deviation is indicated by the error bars, and the asterisks represent statistical significance at P ≤ .001 as determined by the nonparametric Wilcoxon rank sum test.
To determine whether subnormal NK cell number was present in the samples from MDS patients, we plotted the percentage of NK cells present in the samples from 26 patients versus the percentage of cytotoxicity at a 50:1 E/T ratio (Figure 1B). Lower percentages of NK cells did not correlate with lower levels of cytotoxicity. Furthermore, lower specific target cell lysis also showed no correlation with lower absolute numbers of NK cells in the peripheral blood (Figure 1B). Purified NK cells from 5 MDS patients were obtained by negative selection. Cytotoxicity of K562 at 6:1, 12:1, 25:1, and 50:1 ratios was significantly lower than that of purified NK cells obtained from healthy donors, as illustrated in 2 MDS patients and 3 healthy donors (Figure 1C). Collectively, these results confirm that impaired NK cytolytic function in MDS does not result from reduced NK cell number, in agreement with previous reports4–7,26
Because the amount of NK cytotoxicity from peripheral blood varies in assays from healthy individuals, we performed repeat NK cytotoxicity assays on fresh blood from 10 patients that were seen in the clinic 4 to 8 weeks after the initial assessment. None of these patients had evidence of disease progression or were treated with new drug therapies for their disease. We found that results of the repeat killing assays were very similar to initial results obtained in all 10 patients (data not shown).
Association between low NK cytotoxicity and high-risk disease
Cytotoxicity of K562 by PBMCs from healthy donors ranged from 10% to 93%. Among healthy individuals using the 51Cr-release assay, it is unclear whether extremely high levels of NK function confer any biologic advantage. Ninety-five percent of these healthy donors exhibited more than 13% specific lysis at the 50:1 E/T ratio. Examining the extreme lower end of the distribution (ie, NK function corresponding to the lowest 5% of controls) for comparisons across patient characteristics, 13% was used as a dichotomous cut point. We grouped MDS patients into low NK function (group A, average 6.1% ± 4.4% SD, n = 30) and normal NK function (group B, average 39.7% ± 19.7% SD, n = 18) using K562 as the tumor target (Table 1). Younger age (60 years of age or less) has been previously shown to be associated with T cell–mediated immunosuppression of hematopoiesis27 ; in the present study, no difference was detected between age and NK function (P = .71).
Bone marrow was categorized as hypocellular, normal cellular, and hypercellular relative to healthy age-matched controls, as previously described.2 Both age-adjusted hypocellularity and hypercellularity were associated with low NK cytolytic function as compared with normal marrow cellularity, although only the association with hypercellularity reached statistical significance (P = .04; Table 1). With regard to the WHO diagnostic category, we found that patients with excess blasts (RAEB-1 and RAEB-2 and AML) were significantly more likely to be in the low killing group compared with the patients with RCMD (85% low killing versus 42% low killing, respectively) (P = .01; Table 1). Low NK function was statistically significantly associated with higher-risk IPSS groups (intermediate-2 and above) compared with the lower risk groups (low and intermediate-1) (P = .01) and abnormal versus normal karyotype (P = .05; Table 1). In summary, we report that MDS patients with high-risk disease, as characterized by higher IPSS score, presence of excess blasts, abnormal karyotype, and hypercellularity, displayed reduced NK cytotoxicity of K562 tumor cells.
Reduced NKG2D surface expression on NK cells correlates with impaired NK cytotoxicity
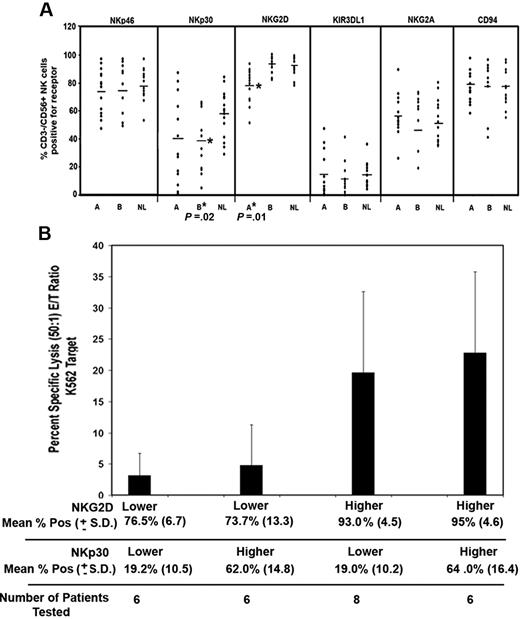
We analyzed NKp46, NKp30, NKG2D, KIR3DL1, NKG2A, CD94 (Figure 2A), and NKp44 (data not shown), which are NK receptors that are important for controlling direct tumor cell lysis by NK cells. Receptor expression was compared on CD56+-expressing NK cells. We found that the inhibitory receptors NKG2A and KIR3DL1, the adaptor protein CD94, and the activating receptors NKp46 and NKp44 were normally expressed on NK cells from patients compared with controls (Figure 2A and data not shown). As shown in Figure 2A, NKp30 expression tended to be lower in MDS patients versus healthy controls, a difference that was statistically significant among MDS patients with normal NK function and reduced NK function (ie, mean, 40% ± 26% SD and 58% ± 17% SD in MDS patients and healthy controls, respectively, P = .02). The distributions of NKG2D surface expression overlapped between MDS patients and healthy controls, although the downward shift in the distribution of NKG2D surface expression in MDS patients was statistically significant. We found that NKG2D expression was selectively diminished on CD3−/CD56+ NK cells from patients with low NK function as compared with healthy controls (P = .01), indicating that reduced NKG2D surface expression is associated with impaired cytotoxicity (Figure 2A).
NK receptor phenotype analysis in MDS patients and healthy controls. (A) The percentage of NK cells that coexpressed NKp46, NKp30, and NKG2D was determined relative to isotype control antibody staining. Receptor expression was compared between group A versus normal and group B versus healthy controls (NL) using the Wilcoxon rank sum test. P values are shown only for those comparisons that were statistically significant. Horizontal lines represent the mean of that group. (B) Twenty-six MDS patients were divided into 2 equal groups based on the median expression of NKG2D and median expression of NKp30. The percent specific lysis of K562 at a 50:1 E/T ratio was then compared between groups with lower NKG2D plus lower NKp30 (n = 6), lower NKG2D plus higher NKp30 (n = 6), lower NKp30 plus higher NKG2D, and higher NKp30 plus higher NKG2D. Error bars indicate SD. These groups were compared using the Wilcoxon rank sum test.
NK receptor phenotype analysis in MDS patients and healthy controls. (A) The percentage of NK cells that coexpressed NKp46, NKp30, and NKG2D was determined relative to isotype control antibody staining. Receptor expression was compared between group A versus normal and group B versus healthy controls (NL) using the Wilcoxon rank sum test. P values are shown only for those comparisons that were statistically significant. Horizontal lines represent the mean of that group. (B) Twenty-six MDS patients were divided into 2 equal groups based on the median expression of NKG2D and median expression of NKp30. The percent specific lysis of K562 at a 50:1 E/T ratio was then compared between groups with lower NKG2D plus lower NKp30 (n = 6), lower NKG2D plus higher NKp30 (n = 6), lower NKp30 plus higher NKG2D, and higher NKp30 plus higher NKG2D. Error bars indicate SD. These groups were compared using the Wilcoxon rank sum test.
To further evaluate the association between lower NKG2D expression, lower NKp30 expression, and lower cytotoxicity function in the MDS patients, 26 patients were divided into 2 equal groups based on the median CD56+/CD3− NK cells positive for NKG2D (76%) and NKp30 (33%). As shown in Figure 2B, the mean percent specific lysis of the lower NKG2D-expressing groups was significantly lower than the higher NKG2D expressers (P = .002), and this difference was not dependent on NKp30 expression. Furthermore, no significant difference in cytotoxicity was detected in lower and higher expressers of NKp30 (P = .85). These findings indicate that low cytotoxicity of K562 correlates with having fewer NKG2D-positive NK cells.
NK sensitivity of the MDS1 tumor cell line derived from bone marrow of an MDS patient
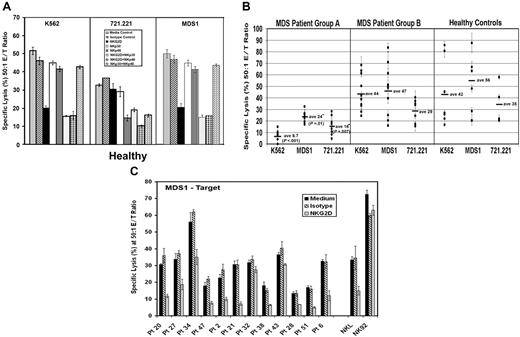
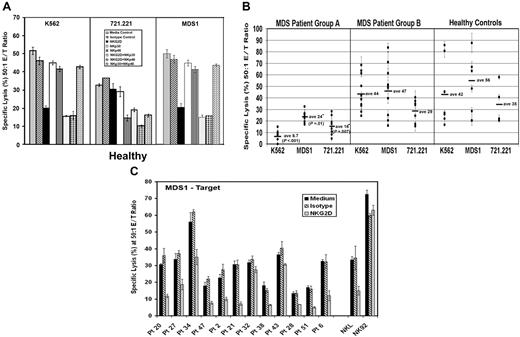
Our initial experiments focused on K562 cells as a target. Next, we determined whether a cell line derived from an MDS patient (MDS1) was lysed by NK cells using 5-hour 51Cr-release assays. As effector cells, we used normal PBMCs and purified NK, NK92, and NKL effector cells. MDS1 cells were readily lysed by these effector cells (Figure S1, available on the Blood website; see the Supplemental Materials link at the top of the online article). To uncover the NK receptors important for tumor cell lysis of MDS1, K562, and 721.221 cells in these assays, antibodies to NKp30, NKp46, and NKG2D receptors were added either alone or simultaneously to effector cells to mask the receptors prior to 51Cr release.12,28–30 Compared with medium alone and isotype control antibodies, the anti-NKG2D antibody was capable of blocking the lysis of MDS1 and K562. Antibodies to NKp30 and NKp46 further enhanced the blockade by anti-NKG2D but failed to block lysis when added alone, suggesting that NKG2D is primarily responsible for the lysis (Figure 3A). In contrast to MDS1 and K562, we found that the lysis of 721.221 cells was substantially inhibited by the anti-NKp46 antibody (Figure 3A). Combinations of antibodies to NKG2D and NKp30 also reduced the lysis of 721.221, which suggests that these receptors participate in the lysis of this target.
Generalized impairment in NK signaling in patients with MDS. (A) Using K562, 721.221, and MDS1 cells as the target, antibody blocking experiments were performed using PBMCs from healthy donors at a 50:1 effector-target (E/T) ratio in the presence of medium alone or 5 μg/mL of the following antibodies: isotype control antibody, anti-NKG2D, anti-NKp30, anti-NKp46, anti-NKG2D plus anti-NKp30, anti-NKG2D plus anti-NKp46, and anti-NKp30 plus anti-NKp46. (B) Direct cytotoxicity of K562, MDS1, and 721.221 tumor cells in 5-hour 51Cr-release assays using PBMCs at a 50:1 E/T ratio from MDS group A patients with low K562 lysis (less than 13%) (n = 8), MDS group B patients with normal lysis of K562 (13% or more) (n = 11), and healthy control donors (n = 12). Horizontal lines represent the mean of that group. (C) Antibody blocking experiments were performed using PBMCs from MDS patients at a 50:1 E/T ratio. Effector cells were incubated in the absence of blocking antibodies (medium, black bars) or in the presence of 5 μg/mL isotype control antibody (hatched bars) and anti-NKG2D antibody (gray bars). NKL and NK92 cells were used at a 10:1 E/T ratio. The graphic representation of the percent specific lysis at a 50:1 effector-target (E/T) ratio is shown. The graphs represent the average of triplicate samples; SD is indicated by the error bars, and asterisks indicate statistical significance at P ≤ .01 as determined by a Wilcoxon rank sum test.
Generalized impairment in NK signaling in patients with MDS. (A) Using K562, 721.221, and MDS1 cells as the target, antibody blocking experiments were performed using PBMCs from healthy donors at a 50:1 effector-target (E/T) ratio in the presence of medium alone or 5 μg/mL of the following antibodies: isotype control antibody, anti-NKG2D, anti-NKp30, anti-NKp46, anti-NKG2D plus anti-NKp30, anti-NKG2D plus anti-NKp46, and anti-NKp30 plus anti-NKp46. (B) Direct cytotoxicity of K562, MDS1, and 721.221 tumor cells in 5-hour 51Cr-release assays using PBMCs at a 50:1 E/T ratio from MDS group A patients with low K562 lysis (less than 13%) (n = 8), MDS group B patients with normal lysis of K562 (13% or more) (n = 11), and healthy control donors (n = 12). Horizontal lines represent the mean of that group. (C) Antibody blocking experiments were performed using PBMCs from MDS patients at a 50:1 E/T ratio. Effector cells were incubated in the absence of blocking antibodies (medium, black bars) or in the presence of 5 μg/mL isotype control antibody (hatched bars) and anti-NKG2D antibody (gray bars). NKL and NK92 cells were used at a 10:1 E/T ratio. The graphic representation of the percent specific lysis at a 50:1 effector-target (E/T) ratio is shown. The graphs represent the average of triplicate samples; SD is indicated by the error bars, and asterisks indicate statistical significance at P ≤ .01 as determined by a Wilcoxon rank sum test.
Next, we compared the amount of lysis of K562, MDS1, and 721.221 cells by PBMCs from MDS patients. This assay was performed to assess whether NK cells from MDS patients have a defect in killing against multiple tumor targets that are primarily killed by different receptors (ie, MDS1 and K562 by NKG2D and 721.221 by NKp46 in combination with NKG2D and NKp30). Results are shown for a subset of MDS patients that were studied in the original case-control analysis. Cytolysis was examined at 50:1, 25:1, 12:1, and 6:1 E/T cell ratios in 5-hour 51Cr-release assays (data shown for 50:1 E/T ratio only; Figure 3B). Interestingly, we found that PMBCs from group A patients with low cytoxicity of K562 also had impaired lysis of the other 2 tumor targets (Figure 3B), whereas PBMCs from group B patients had normal lysis of all 3 targets. These results suggest that MDS patients have generalized impairment of direct NK cytotoxicity against multiple tumor targets including but not limited to targets recognized by NKG2D.
Antibody-masking experiments confirmed the role of NKG2D and NKG2D ligand interactions in lysis of MDS1 by PBMCs from 10 of 12 MDS patients and the NKL cell line (Figure 3C). Anti-NKG2D antibody alone and in combination with anti-NKp30, anti-NKp46, and NKp44 failed to block NK92-mediated lysis of MDS1, suggesting that other receptor-ligand interactions can also mediate lysis of this target cell line (Figure 3C and data not shown). Collectively, these results suggest that lysis of MDS1 is primarily mediated by the NKG2D receptor in both healthy individuals and MDS patients.
NKG2D ligand expression on CD34+ cells from MDS patients
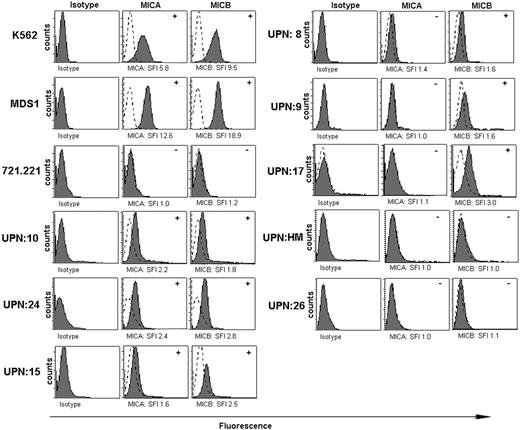
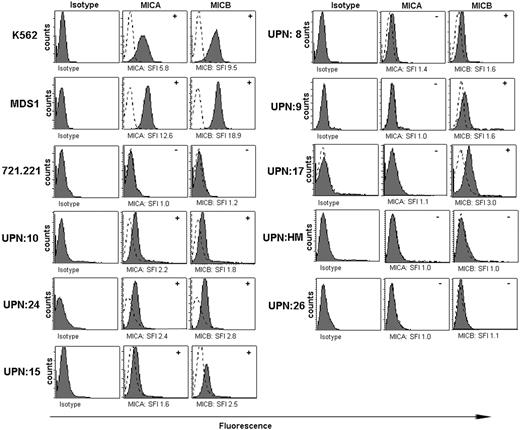
NKG2D–NKG2D ligand interactions were critical for lysis of a tumor cell line derived from an MDS patient as shown in Figure 3. We performed flow cytometric analyses of MICA and MICB expression on CD34+ cells from the bone marrow aspirates of MDS patients compared with healthy controls (Figure 4). Intensities of MIC cell surface stainings were, in general, much lower than class I surface stainings with the pan–HLA-A, -B, -C mAb W6/32 (data not shown). Therefore, we considered CD34+ cells positive for a particular MIC molecule when it was 1.5-fold greater SFI was observed above background (Figure 4A). Analysis of 20 MDS patients revealed that CD34+ cells of 30% of all patients (MICA in 3 of 20 and MICB positive in 6 of 20) expressed MICA and/or MICB compared with 0 of 5 negative controls that were also tested. We found that NKG2D ligands were expressed on K562 cells and on the MDS-derived cell line (MDS1) but failed to be expressed on 721.221 cells. ULBP2 but not ULBP1 or ULBP3 was also expressed on MDS1 cells, whereas ULBP1, ULBP2, and ULBP3 failed to be expressed on 721.221 cells (data not shown). These results support the contention that some CD34+ cells and an MDS-derived cell line express NKG2D ligands.
MICA and MICB expression on K562, MDS1, and 721.221 cell lines and on CD34+ bone marrow cells from MDS patients. Flow cytometry histograms for MICA/MICB expression on K562 cells, 721.221 tumor cells, and MDS1 cells. Isotype control expression (dotted line) was compared with samples stained with an equal amount of anti-MICA or anti-MICB antibody (solid line). Histograms represent results from individual patients (UPN). SFI was calculated using the equation described in “Patients, materials, and methods,” and specific value is shown in the histograms. The determination of positive (+) or negative (-) was based on an SFI value of at least 1.5 (indicated in the upper right hand corner of the histograms).
MICA and MICB expression on K562, MDS1, and 721.221 cell lines and on CD34+ bone marrow cells from MDS patients. Flow cytometry histograms for MICA/MICB expression on K562 cells, 721.221 tumor cells, and MDS1 cells. Isotype control expression (dotted line) was compared with samples stained with an equal amount of anti-MICA or anti-MICB antibody (solid line). Histograms represent results from individual patients (UPN). SFI was calculated using the equation described in “Patients, materials, and methods,” and specific value is shown in the histograms. The determination of positive (+) or negative (-) was based on an SFI value of at least 1.5 (indicated in the upper right hand corner of the histograms).
Sera of some cancer patients, but not that of healthy donors, contain elevated concentrations of soluble MICA and MICB as determined by enzyme-linked immunosorbent assays (ELISAs).23,31 Soluble MICA (sMICA) is a well-documented mediator of immune escape by tumor cells.23,31,32 We performed ELISA for sMICA and sMICB in the sera of 20 MDS patients and from the bone marrow plasma of 28 patients. In general there was no elevation in MIC molecules in patient sera with one exception—low levels in patient 25. These findings are in line with our previous reports showing that sMIC expression was greater in patients with solid tumors than in leukemic patients.23 We have also shown that there are elevated sMIC levels in sera of healthy donors and patients with benign diseases.32 These data exclude the possibility that sMICA or sMICB influenced the detection of NK receptors on NK cells from the peripheral blood of MDS patients.
Restoration of impaired NK function
To determine whether the function of MDS-derived NK cells is augmented by exposure to IL-2, we cultured PBMCs from MDS patients and healthy donors in medium (control) and 100 IU/mL IL-2 for 72 hours prior to cytotoxicity assays. We found that this treatment enhanced the lysis of K562, MDS1, and 721.221 by PBMCs from MDS patients and healthy controls (Figure 5A). In vitro NK receptor antibody-masking experiments were performed with normal NK cells activated by IL-2. In contrast to results in freshly isolated cells (Figure 2A), addition of single antibodies to NKp30, NKp46, NKG2D, and NKp44 failed to reduce the lysis of any targets tested, suggesting that multiple receptors were likely to cooperate under these conditions or that additional NK receptors were induced after IL-2 treatment (data not shown).
IL-2 restores impaired NK function in MDS patients. PMBCs from patients with MDS and PBMCs from healthy donors were cultured for 3 days in the absence (−IL-2) or the presence of 100 IU/mL IL-2 (+IL-2). (A) The graphic representation of the percent specific lysis at a 50:1 effector-target (E/T) ratio is shown for 5-hour 51Cr-release assays using K562, MDS1, and 721.221 cells as targets. From a subset of these samples, the (B) percentage and the (C) median fluorescence intensity (MFI) of NKG2D, NKp30, NKp46, NKp44, and CD69 was determined in CD56+/CD3− NK cells by flow cytometry. The number of patients and healthy controls included in each group is shown at the bottom of each graph. The graphs represent the average of duplicate samples; SD is indicated by the error bars, and asterisks indicate statistical significance as determined by a paired t test.
IL-2 restores impaired NK function in MDS patients. PMBCs from patients with MDS and PBMCs from healthy donors were cultured for 3 days in the absence (−IL-2) or the presence of 100 IU/mL IL-2 (+IL-2). (A) The graphic representation of the percent specific lysis at a 50:1 effector-target (E/T) ratio is shown for 5-hour 51Cr-release assays using K562, MDS1, and 721.221 cells as targets. From a subset of these samples, the (B) percentage and the (C) median fluorescence intensity (MFI) of NKG2D, NKp30, NKp46, NKp44, and CD69 was determined in CD56+/CD3− NK cells by flow cytometry. The number of patients and healthy controls included in each group is shown at the bottom of each graph. The graphs represent the average of duplicate samples; SD is indicated by the error bars, and asterisks indicate statistical significance as determined by a paired t test.
Next, we examined the NK receptors expressed on IL-2–treated NK cells from 6 MDS patients and 6 healthy controls. As predicted, the percentage of NK cells expressing CD69, which is an activation-associated molecule, was increased from both MDS patients and healthy controls after IL-2 treatment (Figure 5B-5C). In MDS patients, the percentage of NK cells that expressed NKp30 and NKp44 was significantly enhanced by IL-2 culture. The mean percentage of NKG2D expressers (77.5%, SD 30.7%, versus 92.1%, SD 8.7%) was also increased by IL-2, but this difference did not reach statistical significance (P = .24). As shown in Figure 5C, the number of NKG2D, NKp44, and NKp30 receptors per NK cell was enhanced in both MDS patients and control donors, as shown by an increase in the median fluorescence intensity (MFI) after culture with IL-2. IL-2 failed to modulate the expression of NKp46 (Figure 5B-C). Collectively, these results demonstrate that NK cytolytic function is enhanced by IL-2 in MDS patients, and we show that this functional effect was associated with increased expression of NKp30, NKG2D, and NKp44 activating receptors.
Discussion
These investigations are the first to show that NKp30 is reduced on NK cells from most MDS patients regardless of their functional capacity to lyse tumor targets and that other activating NCRs (NKp44 and NKp46) are expressed at normal levels. In the setting of HIV-1 infection, defects in NK function are attributed to defective NCR expression with parallel reduction in NKp30, NKp44, and NKp46, suggesting that the NCR receptors are coordinately modulated in some human disease settings.33 In addition, patients with large granular lymphocyte (LGL) leukemia, which shares pathogenetic overlap with bone marrow failure syndromes such as aplastic anemia and MDS, have reduction in both NKp30 and NKp46 expression and reduced NCR function.34 Similar to our findings, NCR expression in patients with LGL leukemia was restored by IL-2.34 Therefore, the reduced NKp30 expression in both MDS and LGL leukemia represents a biologic feature common to these syndromes.
We found that reduced expression of NKG2D closely correlated with impaired NK cytotoxicity against K562. Cytotoxicity of additional target cells such as 721.221 and MDS1 suggests that reduced NKG2D expression may reflect a generalized reduction in cellular-based cytotoxicity mechanisms. NCRs and NKG2D play complementary and sometimes synergistic roles in triggering NK-mediated tumor cell lysis.29,35,36 Control of the activation signaling pathway for cytotoxicity of tumor cells was previously shown to be dependent upon 2 important factors: (1) the surface density of NKG2D ligands expressed on a tumor target and (2) the surface density of NCRs relative to NKG2D expressed on NK cells. Our results suggest that NK functional impairment extends beyond the pathway for NKG2D with potential to impact immunosurveillance capacity against myeloblasts bearing ligands to multiple activating NK receptors.
NKG2D ligands (MICA and ULBPs) capable of inducing NKG2D-mediated NK cytolysis have been detected on human myeloid leukemic cells.23,31 If NKG2D signaling is important for immunosurveillance in MDS, we reasoned that NKG2D ligands may be expressed on the preleukemic or leukemic bone marrow progenitor cells of these patients. In support of this hypothesis, we found that a tumor cell line derived from an MDS patient, MDS1, was lysed through NKG2D-dependent signaling and that NKG2D ligands (MICA and MICB) were expressed on the CD34+ stem cells from some MDS patients. Because of the generalized reduction in NK function involving multiple activating receptors, we anticipate that abnormal stem cells expressing other unidentified NK receptor ligands may also escape immunosurveillance in this patient population.
We found that defective NK function was associated with higher IPSS score (intermediate-2 and high risk) in patients with MDS. In addition, the presence of excess blasts, which portends a higher risk of leukemia progression, was also associated with impaired NK function.1 Nine of the 47 patients included in this study had AML with 20% or more marrow blasts that arose from a background of MDS. Our findings are consistent with previous reports that NK function is suppressed in patients with AML.36–39 Animal models show that NK cells act as effectors to suppress tumor development and to delay tumor progression.33,40–42 Most animal models have focused on the role of NKG2D and NKG2D ligand interactions. Mice painted with chemical carcinogens have increased expression of the endogenous murine NKG2D ligand Rae-1 that is associated with protection against the development of melanoma.
We hypothesize that the bone marrow of MDS patients is actively monitored by NK cells that participate in suppression of the leukemic clone and that the loss of NK function contributes to disease progression. Identification of NK receptor ligand expression by marrow MDS CD34+ cells and NKG2D-dependent cytolysis of an MDS-derived cell line supports the notion that NK cells participate in immunosurveillance. Nonetheless, the mechanism by which NKG2D surface expression is reduced in MDS NK cells is unclear. In mouse models of sustained overexpression of MICA or Rae-1, NKG2D surface down-modulation may be elicited though constant ligand sheading.40 However, we did not detect soluble NKG2D ligand in the sera or bone marrow plasma of MDS patients. Analyses in the past have exclusively demonstrated that only myeloid lineages are abnormal in MDS with infrequent involvement of B lymphocytes in patients with chromosome 5q deletions.43–45 However, a recent study found that NK cells in patients with monosomy 7 were fluorescence in situ hybridization (FISH) positive.46 Our study showed no association between low NK function and abnormal karyotype. In future experiments, however, direct determination of clonotypic abnormalities in NK cells will be important. We suggest that NKG2D surface down-modulation in freshly isolated NK cells from MDS patients may be a clinically useful “biomarker” of suppressed NK function. Collectively, our results show a generalized loss in NK function in MDS patients, which may create an environment of reduced immunosurveillance that is associated with higher-risk disease.
The online version of this manuscript contains a data supplement.
The publication costs of this article were defrayed in part by page charge payment. Therefore, and solely to indicate this fact, this article is hereby marked “advertisement” in accordance with 18 USC section 1734.
Acknowledgments
This work was supported by grants from the Veterans Administration and the National Cancer Institute (R01 CA112112-01, CA098080, and AI056213). We thank Dr Alan Cantor of the Moffitt Cancer Center Biostatistics Program for assistance with this project.
National Institutes of Health
Authorship
Contribution: P.K.E.-B. wrote the paper, designed research, and analyzed data; D.B. analyzed data and performed statistical analysis; L.M. performed research; F.B. performed research; J.S.P. and M.K. performed research and analyzed data; D.E.R. analyzed data and wrote statistics; H.R.S. contributed vital new reagents; J.X.Z., E.K., B.Z., and S.W. performed research; and J.Y.D. and A.F.L. wrote the paper.
Conflict-of-interest disclosure: The authors declare no competing financial interests.
J.Y.D. and A.F.L. contributed equally to this study.
Correspondence: P. K. Epling-Burnette, H. Lee Mofffitt Cancer Center, MRC 3 West, Rm 3044, Tampa, FL 33612; e-mail: pearlie.burnette@moffitt.org.

