Abstract
Inhibition of osteoclast (OC) activity has been associated with decreased tumor growth in bone in animal models. Increased recognition of factors that promote osteoclastic bone resorption in cancer patients led us to investigate whether increased OC activation could enhance tumor growth in bone. Granulocyte colony-stimulating factor (G-CSF) is used to treat chemotherapy-induced neutropenia, but is also associated with increased markers of OC activity and decreased bone mineral density (BMD). We used G-CSF as a tool to investigate the impact of increased OC activity on tumor growth in 2 murine osteolytic tumor models. An 8-day course of G-CSF alone (without chemotherapy) significantly decreased BMD and increased OC perimeter along bone in mice. Mice administered G-CSF alone demonstrated significantly increased tumor growth in bone as quantitated by in vivo bioluminescence imaging and histologic bone marrow tumor analysis. Short-term administration of AMD3100, a CXCR4 inhibitor that mobilizes neutrophils with little effect on bone resorption, did not lead to increased tumor burden. However, OC-defective osteoprotegerin transgenic (OPGTg) mice and bisphosphonate-treated mice were resistant to the effects of G-CSF administration upon bone tumor growth. These data demonstrate a G-CSF–induced stimulation of tumor growth in bone that is OC dependent.
Introduction
Osteoclast (OC)–mediated bone resorption is an essential component in the development of osteolytic bone metastases arising from primary solid tumors such as breast and lung cancers.1,2 Tumor cells that infiltrate the bone marrow cavity can directly and indirectly enhance OC-mediated bone resorption by secreting growth factors such as parathyroid hormone (PTH), PTH-related peptide, interleukin-1 (IL-1), IL-6, IL-11, macrophage colony-stimulating factor (M-CSF), and receptor activator of nuclear factor (NF) κB ligand (RANKL).1,3 This increased resorption leads to the release of a number of bone-derived growth factors, such as transforming growth factor β (TGFβ) and insulin-like growth factor-1 (IGF-1), which in turn are thought to stimulate tumor growth in the marrow cavity.4 Enhanced tumor growth further releases osteoclastogenic factors, which result in more bone destruction and invasion, a process termed the “vicious cycle.”1,2,5,6 It has been shown that tumor-derived systemic parathyroid hormone enhances bone resorption, and leads to increased tumor growth within bone in animals.7 Furthermore, blockade of OC activity has been shown in animal models to decrease tumor growth in bone.8,9 Theoretically, conditions that enhance OC activity, such as hormonal therapies, poor nutrition, inactivity, chemotherapy, or growth factors, could increase proliferation of microscopic and macroscopic deposits of tumor cells in the marrow cavity of patients via the vicious cycle mechanism. We sought to investigate whether nontumor-mediated enhancement of OC activity could enhance tumor growth in bone.
Granulocyte colony-stimulating factor (G-CSF) is a hematopoietic cytokine that promotes the proliferation and differentiation of cells in the granulocyte lineage. It is predominantly produced by cells of the macrophage/monocyte lineage.10 G-CSF signals through the G-CSF receptor (G-CSF-R), which is expressed by a variety of target cells, including neutrophils, monocytes, and various nonhematopoietic cells.10 Exogenous G-CSF is routinely used during cancer chemotherapy to promote neutrophil proliferation and mobilization to decrease infections.11 In addition, G-CSF can be used to mobilize hematopoietic stem cells from healthy donors to harvest stem cells for transplantation.12 Mobilization of neutrophils and hematopoietic cells is believed to occur in part via disruption of the CXCR4/stromal-derived factor-1 (SDF-1) chemokine axis. CXCR4, the cognate G-protein–coupled receptor for SDF-1/CXCL12, is expressed by neutrophils and other hematopoietic cells and is thought to mediate their retention in the bone marrow, a microenvironment containing high levels of SDF-1.13 Treatment with exogenous G-CSF has been shown to cause neutrophil elastase–mediated cleavage of CXCR4 on hematopoietic progenitors,14 and has also been shown to lead to a general decrease in levels of SDF-1 within the bone marrow.15
Within the bone microenvironment, G-CSF affects the activity of the bone-forming cells (osteoblasts [OBs]) and the bone-resorbing cells (OCs). Transgenic mice overexpressing G-CSF have increased numbers of OCs and develop osteoporosis.16 Others have shown that a short course of G-CSF leads to an increase in bone resorption as measured by urine deoxypyridinoline (DPyr) levels.17 G-CSF–administered mice also exhibit decreased levels of osteocalcin, a marker of bone formation.17 More recently, it has been demonstrated that G-CSF administration in mice leads to a decrease in OB numbers in the bone as well as markedly reduced levels of the chemokine SDF-1 and osteocalcin, which are produced by OBs.15 These data suggest that exogenous G-CSF decreases OB activity and increases OC activity in vivo.
We sought to evaluate the effects of increased OC activity on tumor growth in 2 murine bone metastasis models using G-CSF pretreatment to promote OC bone resorption. We demonstrate that G-CSF administration leads to an increase in OC activity and an enhancement of tumor growth in the marrow cavity of mice. Furthermore, this enhancement of tumor growth is abrogated in OC-defective or OC-inhibited mice. These data underscore the importance of osteoclastic bone resorption to tumor growth in bone.
Materials and methods
Cells
The B16-F10 C57BL/6 murine melanoma cell line was purchased from American Type Culture Collection (ATCC; Manassas, VA). B16-F10 cells were transfected with the pGL3 vector containing firefly luciferase (Promega, Madison, WI) and selected in 1 mg/mL G418 (Promega) in Dulbecco modified Eagle medium (DMEM) with 10% fetal bovine serum (FBS). A clone expressing a high level of luciferase was selected directly from the plates by bioluminescence imaging (IVIS 100; Xenogen, Alameda, CA) in the presence of 150 μg/mL d-luciferin and called B16-FL. 4T1-GFP-FL BALB/c murine breast cancer cells were previously described.18
Animals
C57BL/6 mice were obtained from Harlan Laboratories (Indianapolis, IN). BALB/c mice were obtained from Taconic (Hudson, NY). Mice were housed under pathogen-free conditions according to the guidelines of the Division of Comparative Medicine, Washington University School of Medicine. The animal ethics committee approved all experiments. Transgenic C57BL/6.129 mice expressing osteoprotegerin (OPGTg) under the control of the apoE promoter have been previously described19 and were provided by Dr S. Simonet (Amgen, Thousand Oaks, CA). Genotypes were determined by polymerase chain reaction (PCR) on genomic DNA.
Drug administration
Mice were administered 200 μg/kg G-CSF (Amgen, Thousand Oaks, CA) in 100 μL of phosphate-buffered saline (PBS) with 0.1% bovine serum albumin (BSA) or 100 μL of vehicle subcutaneously daily for 8 days. Tumor cells were injected on the fifth day of G-CSF or vehicle administration. Blood counts were analyzed 3 hours after the final dose of G-CSF. For posttreatment experiments, tumor cells were injected and mice were then administered G-CSF or vehicle subcutaneously daily for the next 8 days. Alternatively, AMD3100 (Sigma, St Louis, MO) was administered at 5 mg/kg subcutaneously every 12 hours for 3 days. Tumor injections were performed 3 hours after the first dose. Blood counts were analyzed 3 hours after the final dose of AMD3100. A single 0.75 μg subcutaneous dose of zoledronic acid was given 1 day before tumor cell injection.
Peripheral blood analysis
Complete blood counts (CBCs) were determined using a Hemavet automated cell counter (CDC Technologies, Oxford, CT).
Serum TRAP 5b assay
Levels of tartrate-resistant acid phosphatase (TRAP) 5b were measured in serum collected from G-CSF or vehicle-administered mice using a TRAP 5b enzyme-linked immunosorbent assay (ELISA) system (IDS, Fountain Hills, AZ).
Intratibial bone metastasis models
Mice were anesthetized, and 1 × 10⁴ B16-FL or 4T1-GFP-FL cells in 50 μL PBS were injected into the right tibia. PBS (50 μL) was injected into the left tibia as an internal control. Animals were radiographed in 2 dimensions using an X-ray system to confirm intratibial placement of the needle (Faxitron Corp, Buffalo Grove, IL). In vivo bioluminescence imaging was performed on C57BL/6 mice on days 8, 10, and 12 following B16-FL tumor injections and on BALB/c mice on days 3, 5, and 7 following 4T1-GFP-FL tumor injections. OPGTg mice and wild-type C57BL/6.129 littermates were imaged on days 8 and 10 following B16-FL tumor cell injections. Mice with intramuscular locations of tumors were discarded from the analysis. Mice were killed and underwent blinded necropsy on the last day of imaging.
Intra-arterial bone metastasis model
For intra-arterial injections, operators were blinded to drug treatment. Mice were anesthetized and inoculated intra-arterially with 105 4T1-GFP-FL cells in 50 μL PBS as previously described.20 Mice were killed and underwent blinded necropsy on day 10 after tumor cell injection. Mice were discarded from the final analysis if the animal died before day 10 or if necropsy demonstrated a large mediastinal tumor indicative of injection of tumor cells into the chest cavity, not the left ventricle.
Subcutaneous tumor injections
Mice were anesthetized and 5 × 10⁵ B16-FL or 4T1-GFP-FL cells in 100 μL PBS were injected subcutaneously on the dorsal surface of the mouse. Tumor growth was monitored over the 12-day period following tumor cell injections, and tumor size was measured with calipers in 2 dimensions. Tumor volume was estimated based on calculating the volume of an ellipsoid [(4/3Π) × (L/2) × (W/2)2].
In vivo bioluminescence imaging
Mice were injected intraperitoneally with 150 mg/kg D-luciferin (Biosynthesis, Naperville, IL) in PBS 10 minutes prior to imaging. Imaging was performed using a charge-coupled device (CCD) camera (IVIS 100; exposure time of 1 or 5 minutes, binning of 8, field of vision [FOV] of 15 cm, f/stop of 1, and no filter) in collaboration with the Molecular Imaging Center Reporter Core (Washington University, St Louis). Mice were anesthetized by isoflourane (2% vaporized in O2), and C57BL/6 mice were shaved to minimize attenuation of light by pigmented hair. For analysis, total photon flux (photons per second) was measured from a fixed region of interest (ROI) in the tibia using Living Image 2.50 and IgorPro software (Wavemetrics, Portland, OR).21
Bone histomorphometry
Mouse tibias were fixed in formalin and decalcified in 14% EDTA. Paraffin-embedded sections were stained with hematoxylin and eosin, and separately for TRAP. Trabecular bone area, OC perimeter, and tumor area were measured according to a standard protocol using Bioquant Osteo (Bioquant Image Analysis Corporation, Nashville TN).22 Bone sections were blinded prior to analysis.
DEXA
Bone mineral density (BMD) of isolated femurs and tibias was measured and analyzed by a PIXImus2 scanner according to the manufacturer's protocol (Lunar Corporation, Madison, WI). Bones were blinded to treatment group prior to measurement.
OC functional assays
Whole bone marrow was isolated from wild-type C57BL/6 mice and plated at a concentration of 5 × 10⁵ cells/mL in M-CSF containing CMG-14-12 cell culture supernatant (1:10 vol) in α-MEM media containing 10% FBS in petri dishes to generate primary bone marrow macrophages (BMMs). BMMs were lifted and plated at a concentration of 5 × 10⁵ cells/mL in 48-well dishes. Cells were fed every day with OC media: α-MEM containing 10% FBS, CMG-14-12 supernatant (1:20 vol), and GST-RANKL (50 ng/mL), with or without 50 ng/mL G-CSF and incubated at 37°C in 5% CO2, 94% room air for 5 days to generate OCs.23,24 TRAP staining was performed according to manufacturer's instructions (Sigma). A quantitative TRAP solution assay (modified from Tintut et al25 ) was performed by adding a colorimetric substrate, 5.5 mM P-nitrophenyl phosphate, in the presence of 10 mM sodium tartrate at pH 4.5. The reaction product was quantified by measuring optical absorbance at 405 nm. For dose response experiments, cells were grown in OC media with or without 10, 30, or 50 ng/mL G-CSF for 4 days, and then a TRAP solution assay was performed. Calcium phosphate resorption assays were performed by plating 105 BMMs into wells of osteologic slides (BD Biosciences, San Jose, CA). Cells were fed every day with OC media with or without 50 ng/mL G-CSF for 4 days to generate OCs. On the fourth day, slides were processed as previously described.26 Resorbed area was quantitated while blinded using Bioquant Osteo. All samples were run in quadruplicate.
Neutrophil enrichment from bone marrow
A bone marrow population enriched for neutrophils was obtained using a discontinuous Percol gradient as described previously.27
Flow cytometry
A total of 106 BMMs or bone marrow enriched for neutrophils were stained with fluorescein isothiocyanate (FITC)–conjugated anti–mouse Gr-1 (eBioscience, San Diego, CA) and then analyzed on a FACScan Flow Cytometer (BD Biosciences, San Jose, CA).
Image acquisition
Images of cells and isolated tibias were taken at room temperature with a Nikon Eclipse TE300 inverted microscope (Nikon, Tokyo, Japan) connected to a Magnafire camera model S99802 (Optronics, Goleta, CA). All images were sharpened by the stretch intensity tool in the Magnafire software version 2.1C (Optronics, Goleta, CA). A 4× Nikon lens (40× magnification) with numerical aperture 0.13 was used.
RT-PCR
Mouse pre-OB cell line ST-2 (gift from Dr Steven Teitelbaum, Washington University School of Medicine) was cultured in α-MEM with 10% FCS. Total RNA from ST-2 cells, primary calvarial OBs (gift from Dr Roberto Civitelli, Washington University School of Medicine), primary BMMs, primary OCs, and tumor cell lines were isolated with the RNeasy mini kit (QIAGEN, Valencia, CA) and digested with deoxyribonuclease to eliminate genomic DNA. Complementary DNA was made using Superscript first-strand synthesis system for reverse transcription (RT)–PCR (Invitrogen, Carlsbad, CA). RT-PCR was performed with mouse gene specific primers for G-csf-r (G-csf receptor): sense, AAACCTATCCTGCCTCATGCACCT; and antisense, CTTGCACCCAGATGGCCATATACT; or Rank-r (Rank receptor): sense, CACAGACAAATGCAAAACCTTG; and antisense, GTCTTCTGGAACCATCTTCTCC.
Statistical analysis
For all experiments that involved bioluminescence imaging, we used mixed repeated measures linear modeling with nonorthogonal contrasts to test hypotheses of differences between treatment groups and interactions between time and treatment groups using SAS version 9 statistical software (Cary, NC). All other experiments were analyzed using the Student t test. In calculating 2-tailed significance levels for equality of means, equal variances were assumed for the 2 populations. Hypothesis tests were carried out in the context of linear models after assumptions were checked for the dataset as a whole and model fit was verified. These tests adjust for the different numbers of experimental subjects in the groups being compared.
Results
G-CSF administration increases OC number and decreases trabecular bone area in vivo.
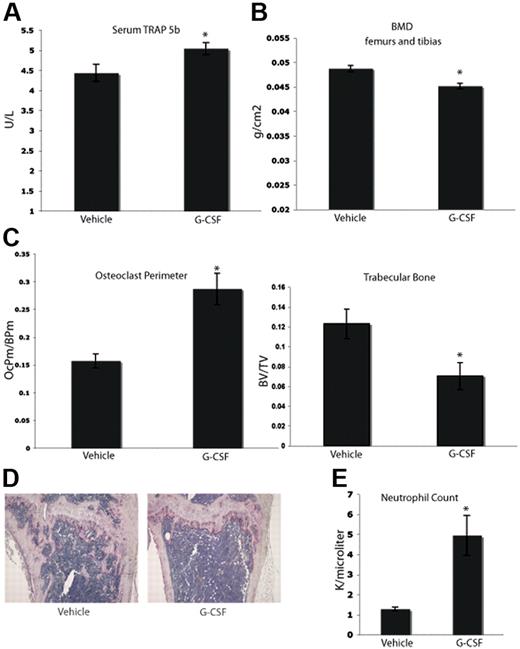
Clinically, it has been suggested that long-term treatment with G-CSF can lead to bone loss. Case reports have indicated that children with severe congenital neutropenia treated with G-CSF support develop osteopenia.28-30 In addition, data from other animal models suggest that G-CSF can enhance osteoclastogenesis.17,29,31 We tested whether or not a short-term course of G-CSF would enhance osteoclastogenesis in C57BL/6 mice. Mice were given a typical neutrophil-mobilizing course of 200 μg/kg of G-CSF or vehicle subcutaneously daily for 8 days. After the final dose (24 hours), serum was collected. Mice that were administered G-CSF demonstrated elevated levels of serum TRAP 5b, a marker specific to OCs, compared with vehicle-administered mice (Figure 1A). After the final dose of G-CSF (9 days), the mice were killed, and the leg bones were fixed in formalin and analyzed by dual-energy X-ray absorptiometry (DEXA) to assess BMD. Mice given G-CSF exhibited a statistically significant 7% decrease in BMD compared with vehicle controls (Figure 1B). Histomorphometric analysis of the tibial bones of mice administered G-CSF revealed a significant increase in OC perimeter as well as a 40% decrease in trabecular bone area compared with vehicle controls (Figure 1C-D). In addition, G-CSF led to mobilization of neutrophils as expected (Figure 1E). These data indicate that an 8-day course of G-CSF resulted in enhanced osteoclastogenesis and significantly decreased murine BMD in vivo.
G-CSF enhances OC activity and increases bone resorption in vivo. (A) Serum was collected from mice 24 hours after completion of an 8-day course of 200 μg/kg G-CSF (n = 5) or vehicle (n = 5). Levels of TRAP 5b were measured by ELISA. G-CSF–administered mice have a 14% increase in levels of serum TRAP 5b (P = .03). (B) Mice were administered 200 μg/kg G-CSF (n = 19) or vehicle (n = 17) for 8 days. After the final dose (9 days), mice were killed and isolated femurs and tibias were fixed in formalin. BMD was measured on formalin-fixed bones by DEXA. Mice administered G-CSF demonstrated a 7% loss in BMD compared with vehicle-administered controls (P < .001). (C) Mice were administered 200 μg/kg G-CSF (n = 13) or vehicle (n = 17) for 8 days. After the final dose (9 days), mice were killed and tibial bones were isolated, decalcified and TRAP-stained to visualize OCs. G-CSF–administered mice had a statistically significant increase in OC perimeter and decrease in trabecular bone area compared with vehicle-administered mice (P = .02 and P < .005, respectively). (D) Representative histology of vehicle-administered versus G-CSF–administered mice. (E) G-CSF–administered animals (n = 3) demonstrated elevated neutrophil counts compared with vehicle-administered animals (n = 3; P = .01). All error bars represent standard error of the mean. Asterisks indicate statistical significance.
G-CSF enhances OC activity and increases bone resorption in vivo. (A) Serum was collected from mice 24 hours after completion of an 8-day course of 200 μg/kg G-CSF (n = 5) or vehicle (n = 5). Levels of TRAP 5b were measured by ELISA. G-CSF–administered mice have a 14% increase in levels of serum TRAP 5b (P = .03). (B) Mice were administered 200 μg/kg G-CSF (n = 19) or vehicle (n = 17) for 8 days. After the final dose (9 days), mice were killed and isolated femurs and tibias were fixed in formalin. BMD was measured on formalin-fixed bones by DEXA. Mice administered G-CSF demonstrated a 7% loss in BMD compared with vehicle-administered controls (P < .001). (C) Mice were administered 200 μg/kg G-CSF (n = 13) or vehicle (n = 17) for 8 days. After the final dose (9 days), mice were killed and tibial bones were isolated, decalcified and TRAP-stained to visualize OCs. G-CSF–administered mice had a statistically significant increase in OC perimeter and decrease in trabecular bone area compared with vehicle-administered mice (P = .02 and P < .005, respectively). (D) Representative histology of vehicle-administered versus G-CSF–administered mice. (E) G-CSF–administered animals (n = 3) demonstrated elevated neutrophil counts compared with vehicle-administered animals (n = 3; P = .01). All error bars represent standard error of the mean. Asterisks indicate statistical significance.
Macrophages and OCs express the G-CSF-R, and addition of G-CSF leads to increased OC numbers in vitro
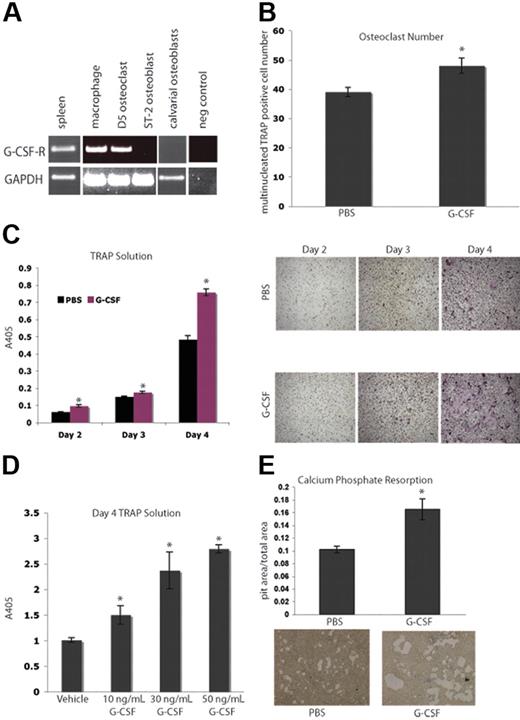
Next, we evaluated the ability of G-CSF to directly affect osteoclastogenesis. Isolated macrophages and bone marrow–derived OCs expressed G-csf-r by RT-PCR (Figure 2A). We demonstrated that this expression pattern was not due to neutrophil contamination by confirming the absence Gr-1 high-expressing cells in our macrophage cultures (Figure S1, available on the Blood website; see the Supplemental Materials link at the top of the online article.).32 It has previously been shown that M-CSF and RANKL are the cytokines necessary and sufficient to generate OCs from primary mouse BMMs in vitro.33,34 The addition of 50 ng/mL G-CSF to murine BMMs cultured in OC media resulted in enhanced OC numbers as well as increased OC-specific TRAP activity in vitro (Figure 2B-C), and are consistent with earlier reports showing G-CSF-R function on myeloid cells.35,36 This enhancement of osteoclastogenesis by G-CSF is a dose-dependent phenomenon, as increasing concentrations of G-CSF ranging from 10 to 50 ng/mL resulted in increasing levels of TRAP activity (Figure 2D). Furthermore, when 50 ng/mL G-CSF was added to BMMs plated on osteologic slides in OC media, there was an increase in calcium phosphate resorption area compared with cultures that received vehicle (Figure 2E). These data suggest that G-CSF increases M-CSF– and RANKL-induced OC differentiation and calcium phosphate resorption in vitro.
G-CSF enhances osteoclastogenesis in vitro. (A) RT-PCR was performed on mRNA from primary murine macrophages (Day 0), primary murine OCs (Day 5), a murine OB cell line, ST-2, and primary calvarial OBs. Macrophages and OCs express G-csf-r, while OBs do not. Spleen cDNA was a positive control. (B) Primary murine BMMs were grown in the presence of M-CSF and RANKL to promote differentiation of macrophages into OCs. Cultures were supplemented with 50 ng/mL G-CSF or PBS. Day-3 OCs were stained with TRAP; multinucleated TRAP-positive cells were counted. The addition of G-CSF led to a significant enhancement in osteoclastogenesis (P = .03). (C) A TRAP solution assay was performed to obtain relative levels of TRAP. The addition of G-CSF resulted in significant increases in TRAP activity at all days examined (P = .005, Day 2; P = .01, Day 3; and P < .005, Day 4). Representative images of the cells are shown. (D) To assess a dose response to G-CSF, a TRAP solution assay was performed to obtain relative levels of TRAP activity 4 days after plating BMMs in M-CSF and RANKL with 0, 10, 30, or 50 ng/mL G-CSF. Increasing doses of G-CSF resulted in increasing TRAP activity (P < .05 for each dose of G-CSF compared with vehicle). (E) Primary murine BMMs were grown in the presence of M-CSF and RANKL on osteologic calcium-phosphate–coated slides for 4 days. Cultures were supplemented with either 50 ng/mL G-CSF or PBS. Cultures supplemented with G-CSF demonstrated increased areas of calcium-phosphate resorption (P = .01). All error bars represent standard error of the mean. Asterisks indicate statistical significance.
G-CSF enhances osteoclastogenesis in vitro. (A) RT-PCR was performed on mRNA from primary murine macrophages (Day 0), primary murine OCs (Day 5), a murine OB cell line, ST-2, and primary calvarial OBs. Macrophages and OCs express G-csf-r, while OBs do not. Spleen cDNA was a positive control. (B) Primary murine BMMs were grown in the presence of M-CSF and RANKL to promote differentiation of macrophages into OCs. Cultures were supplemented with 50 ng/mL G-CSF or PBS. Day-3 OCs were stained with TRAP; multinucleated TRAP-positive cells were counted. The addition of G-CSF led to a significant enhancement in osteoclastogenesis (P = .03). (C) A TRAP solution assay was performed to obtain relative levels of TRAP. The addition of G-CSF resulted in significant increases in TRAP activity at all days examined (P = .005, Day 2; P = .01, Day 3; and P < .005, Day 4). Representative images of the cells are shown. (D) To assess a dose response to G-CSF, a TRAP solution assay was performed to obtain relative levels of TRAP activity 4 days after plating BMMs in M-CSF and RANKL with 0, 10, 30, or 50 ng/mL G-CSF. Increasing doses of G-CSF resulted in increasing TRAP activity (P < .05 for each dose of G-CSF compared with vehicle). (E) Primary murine BMMs were grown in the presence of M-CSF and RANKL on osteologic calcium-phosphate–coated slides for 4 days. Cultures were supplemented with either 50 ng/mL G-CSF or PBS. Cultures supplemented with G-CSF demonstrated increased areas of calcium-phosphate resorption (P = .01). All error bars represent standard error of the mean. Asterisks indicate statistical significance.
Tumor burden in bone is increased after G-CSF administration
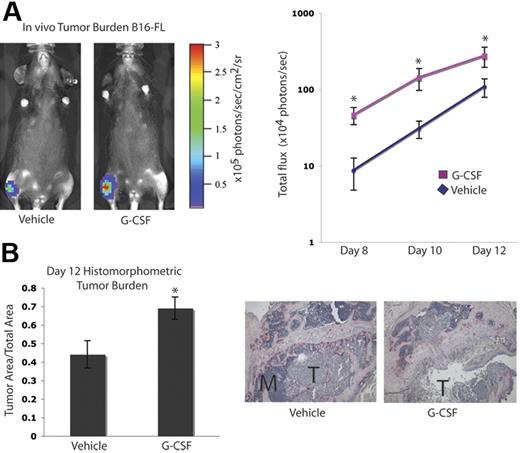
It has been suggested that tumor cell–mediated enhancement of OC activity in the bone marrow cavity results in release of growth factors from the bone matrix, which can augment tumor cell proliferation, an idea commonly referred to as the “vicious cycle.”1,5 Since we found that G-CSF administration increased OC activity, we evaluated tumor growth in the bones of mice administered G-CSF. C57BL/6 mice were given 200 μg/kg G-CSF or vehicle daily for 8 days. On the fifth day, B16-FL murine melanoma cells were injected into the tibias of the mice under X-ray guidance, and G-CSF administration was continued for 3 more days. Tumor burden was assessed by in vivo bioluminescence imaging at days 8, 10, and 12 following tumor cell injection. Mice given G-CSF demonstrated a greater than 2-fold increase in tumor burden compared with vehicle controls (Figure 3A). After B16-FL injections (12 days), mice were killed, and histomorphometric analysis of the tumor area within the bone marrow cavity confirmed the increased tumor burden observed by bioluminescence imaging (Figure 3B).
G-CSF administration increases tumor burden in bone in vivo. A. Mice were administered 200 μg/kg G-CSF (n = 13) or vehicle (n = 12) daily for 8 days. On the fifth day of treatment, 104 B16-FL tumor cells were injected into the right tibia. Tumor burden was assessed by bioluminescence imaging at days 8, 10, and 12 after tumor cell injection. A representative image from day 12 is shown here. G-CSF–administered mice demonstrated an increased tumor burden compared with vehicle-administered animals (P < .006, G-CSF vs vehicle; pooled data from 2 independent experiments; y-axis is log scale). (B) After tumor cells were injected (12 days), mice were killed and bones were isolated. Histomorphometric analysis confirmed the increased tumor burden seen by imaging in the G-CSF–administered animals (P = .01). Representative histology depicted here; M indicates marrow; T, tumor. All error bars represent standard error of the mean. Asterisks indicate statistical significance.
G-CSF administration increases tumor burden in bone in vivo. A. Mice were administered 200 μg/kg G-CSF (n = 13) or vehicle (n = 12) daily for 8 days. On the fifth day of treatment, 104 B16-FL tumor cells were injected into the right tibia. Tumor burden was assessed by bioluminescence imaging at days 8, 10, and 12 after tumor cell injection. A representative image from day 12 is shown here. G-CSF–administered mice demonstrated an increased tumor burden compared with vehicle-administered animals (P < .006, G-CSF vs vehicle; pooled data from 2 independent experiments; y-axis is log scale). (B) After tumor cells were injected (12 days), mice were killed and bones were isolated. Histomorphometric analysis confirmed the increased tumor burden seen by imaging in the G-CSF–administered animals (P = .01). Representative histology depicted here; M indicates marrow; T, tumor. All error bars represent standard error of the mean. Asterisks indicate statistical significance.
Tumor burden in bone is not increased in OC-defective OPGTg mice after G-CSF administration
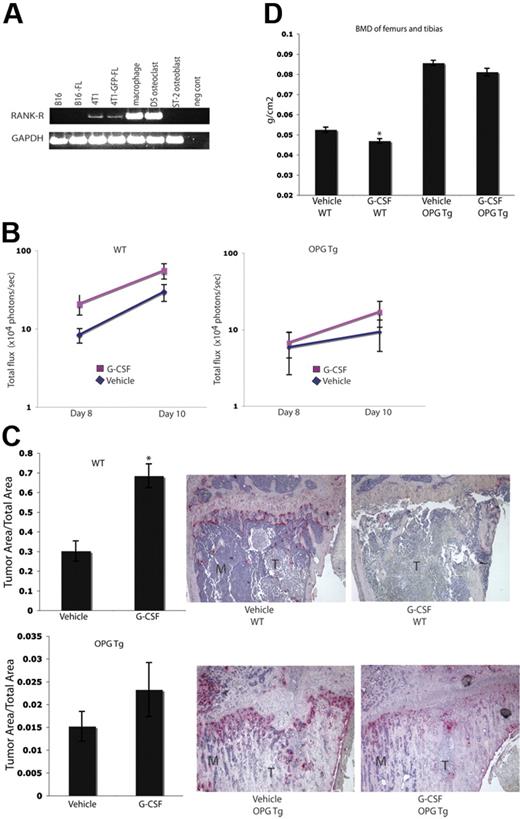
To evaluate whether or not the increased tumor burden seen in G-CSF–administered animals was a result of G-CSF enhancement of OC function, we repeated the experiments in Figure 3 in OC-defective OPGTg mice. OPG is a soluble decoy receptor that binds RANKL to function as a negative regulator of osteoclastogenesis. OPG is normally produced by OBs and B cells. In this murine model, OPG is constitutively expressed by hepatocytes under the control of the human APOE promoter. These mice lack mature functional OCs and therefore develop osteopetrosis.19 As such, we chose to use this OC-defective mouse model to determine if the effects of G-CSF on tumor growth were a result of increased OC activity. Because the B16 and B16-FL cells used in these experiments do not express Rank-r (Figure 4A), it is unlikely that the cell line is responsive to OPG-induced alterations in RANKL levels. OPGTg and C57BL/6.129 wild-type littermate mice were administered 200 μg/kg G-CSF or vehicle daily for 8 days. On the fifth day, B16-FL cells were injected into the right tibias of the mice. Drug administration continued for 3 more days. Tumor burden was assessed by in vivo bioluminescence imaging at days 8 and 10 following tumor cell injection. As expected, wild-type mice given G-CSF demonstrated an almost 2-fold increase in tumor burden as measured by luciferase production compared with vehicle-administered wild-type mice on days 8 and 10 (Figure 4B). OPGTg mice, on the other hand, demonstrated equivalent tumor luciferase levels regardless of treatment group (Figure 4B). While the difference in tumor burden in the wild-type mice did not reach statistical significance by bioluminescence imaging (P = .057), histomorphometric analysis of the bones of these mice confirmed that tumor burden in the G-CSF–administered wild-type animals was significantly increased compared with vehicle controls (Figure 4C). Once again, no difference in tumor burden was observed in OPGTg mice (Figure 4C). Furthermore, wild-type mice, but not OPGTg mice, given G-CSF demonstrated a statistically significant decrease in BMD as measured by DEXA (Figure 4D). Taken together, these data support the hypothesis that the increase in tumor burden in bone with G-CSF administration requires functional OCs.
Enhanced tumor growth in bone following G-CSF administration is not seen in OC-defective mice. (A) RT-PCR was performed on mRNA harvested from murine tumor cell lines. Parental 4T1 and 4T1-GFP-FL cells express Rank-r, while B16 and B16-FL cells do not. (B) OPGTg or wild-type mice were administered 200 μg/kg G-CSF or drug vehicle daily for 8 days. On the fifth day of treatment, 104 B16-FL tumor cells were injected into the right tibia. Tumor burden was assessed by bioluminescence imaging on days 8 and 10 after tumor cell injection. G-CSF–administered wild-type mice (n = 12) demonstrated an increased tumor burden compared with vehicle-administered animals (n = 17; P = .057), while OPGTg mice demonstrated equivalent tumor growth (n = 16 vehicle-administered OPGTg mice, n = 20 G-CSF–administered OPGTg mice; P = .64; results were pooled from 5 independent experiments; y-axis is log scale). (C) Histomorphometric analysis confirmed the increased tumor burden seen by imaging in the G-CSF–administered wild-type mice (P < .001 wild-type, P = 0.24 OPGTg). Representative histology depicted here. M indicates marrow; T, tumor. (D) DEXA was used to measure BMD on formalin-fixed bones. G-CSF–administered wild-type mice (n = 10) showed an 8% decrease in BMD compared with vehicle-administered controls (n = 13; P = .004), while G-CSF–administered OPGTg mice (n = 11) demonstrated equivalent BMD compared with vehicle-administered controls (n = 9; P = .06). All error bars represent standard error of the mean. Asterisks indicate statistical significance.
Enhanced tumor growth in bone following G-CSF administration is not seen in OC-defective mice. (A) RT-PCR was performed on mRNA harvested from murine tumor cell lines. Parental 4T1 and 4T1-GFP-FL cells express Rank-r, while B16 and B16-FL cells do not. (B) OPGTg or wild-type mice were administered 200 μg/kg G-CSF or drug vehicle daily for 8 days. On the fifth day of treatment, 104 B16-FL tumor cells were injected into the right tibia. Tumor burden was assessed by bioluminescence imaging on days 8 and 10 after tumor cell injection. G-CSF–administered wild-type mice (n = 12) demonstrated an increased tumor burden compared with vehicle-administered animals (n = 17; P = .057), while OPGTg mice demonstrated equivalent tumor growth (n = 16 vehicle-administered OPGTg mice, n = 20 G-CSF–administered OPGTg mice; P = .64; results were pooled from 5 independent experiments; y-axis is log scale). (C) Histomorphometric analysis confirmed the increased tumor burden seen by imaging in the G-CSF–administered wild-type mice (P < .001 wild-type, P = 0.24 OPGTg). Representative histology depicted here. M indicates marrow; T, tumor. (D) DEXA was used to measure BMD on formalin-fixed bones. G-CSF–administered wild-type mice (n = 10) showed an 8% decrease in BMD compared with vehicle-administered controls (n = 13; P = .004), while G-CSF–administered OPGTg mice (n = 11) demonstrated equivalent BMD compared with vehicle-administered controls (n = 9; P = .06). All error bars represent standard error of the mean. Asterisks indicate statistical significance.
Tumor burden in bone is increased after G-CSF administration and is abrogated by zoledronic acid in a second osteolytic tumor model
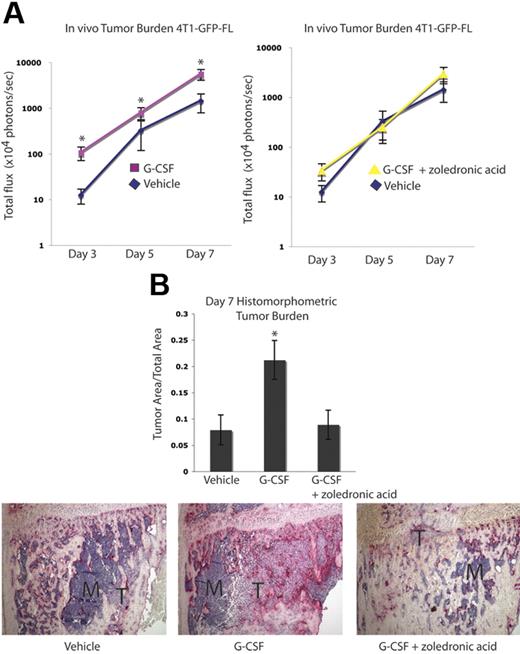
The effect of G-CSF on tumor burden was evaluated in a second osteolytic tumor model using the murine mammary carcinoma cell line 4T1-GFP-FL. BALB/c mice received 200 μg/kg G-CSF or vehicle daily for 8 days. On the fifth day, 4T1-GFP-FL murine breast cancer cells were injected into the right tibias of the mice, and drug administration continued for 3 more days. Compared with the B16-FL cells, increased luciferase expression by the 4T1-GFP-FL cells allowed for earlier in vivo tumor cell detection. As such, tumor burden was assessed by in vivo bioluminescence imaging at days 3, 5, and 7 following tumor cell injection. A greater than 2-fold increase in tumor burden was observed in mice given G-CSF compared with vehicle controls (Figure 5A). Furthermore, treatment of G-CSF–administered mice with the OC inhibitory bisphosphonate, zoledronic acid, demonstrated bioluminescence counts comparable with vehicle controls (Figure 5A). Histomorphometric analysis of day 7 bones confirmed the increased tumor burden observed with bioluminescence imaging (Figure 5B). In addition, a 2-fold enhancement in tumor burden was seen in G-CSF–administered animals in an intra-arterial tumor cell injection model using the same pretreatment scheme that was used in all previous experiments (Figure S2A). Furthermore, increased tumor burden was seen in G-CSF–administered animals in a posttreatment model whereby tumor cells were injected intra-arterially and mice were then randomized to receive G-CSF or vehicle for 8 days (Figure S2B). Taken together, these data demonstrate that in the absence of chemotherapy, administration of G-CSF can enhance skeletal tumor growth of a second osteolytic cancer cell line in a different mouse strain.
Tumor growth in bone is increased following G-CSF administration and is decreased by OC blockade in a second osteolytic model. (A) Mice were administered 200 μg/kg G-CSF (n = 18) or vehicle (n = 17) daily for 8 days or 200 μg/kg G-CSF daily for 8 days and 1 dose (0.75 μg) of zoledronic acid 1 day prior to tumor cell injection (n = 9). On the fifth day of G-CSF or vehicle administration, 104 4T1-GFP-FL tumor cells were injected into the right tibia. Tumor burden was assessed by bioluminescence imaging at days 3, 5, and 7 after tumor cell injection. G-CSF–administered mice demonstrated increased tumor burden compared with vehicle-administered mice, while G-CSF–administered mice given zoledronic acid showed equivalent tumor burden to vehicle mice (P < .001 G-CSF vs vehicle; P = .48 G-CSF plus zoledronic acid vs vehicle; pooled data from 3 independent experiments; y-axis is log scale). (B) After tumor cells were injected (7 days), mice were killed and bones were isolated. Histomorphometric analysis confirmed the increased tumor burden seen by imaging in the G-CSF–administered animals (P = .046). Representative histology depicted here; M indicates marrow; T, tumor. All error bars represent standard error of the mean. Asterisks denote statistical significance.
Tumor growth in bone is increased following G-CSF administration and is decreased by OC blockade in a second osteolytic model. (A) Mice were administered 200 μg/kg G-CSF (n = 18) or vehicle (n = 17) daily for 8 days or 200 μg/kg G-CSF daily for 8 days and 1 dose (0.75 μg) of zoledronic acid 1 day prior to tumor cell injection (n = 9). On the fifth day of G-CSF or vehicle administration, 104 4T1-GFP-FL tumor cells were injected into the right tibia. Tumor burden was assessed by bioluminescence imaging at days 3, 5, and 7 after tumor cell injection. G-CSF–administered mice demonstrated increased tumor burden compared with vehicle-administered mice, while G-CSF–administered mice given zoledronic acid showed equivalent tumor burden to vehicle mice (P < .001 G-CSF vs vehicle; P = .48 G-CSF plus zoledronic acid vs vehicle; pooled data from 3 independent experiments; y-axis is log scale). (B) After tumor cells were injected (7 days), mice were killed and bones were isolated. Histomorphometric analysis confirmed the increased tumor burden seen by imaging in the G-CSF–administered animals (P = .046). Representative histology depicted here; M indicates marrow; T, tumor. All error bars represent standard error of the mean. Asterisks denote statistical significance.
Tumor burden in subcutaneous tissues is not affected by G-CSF administration
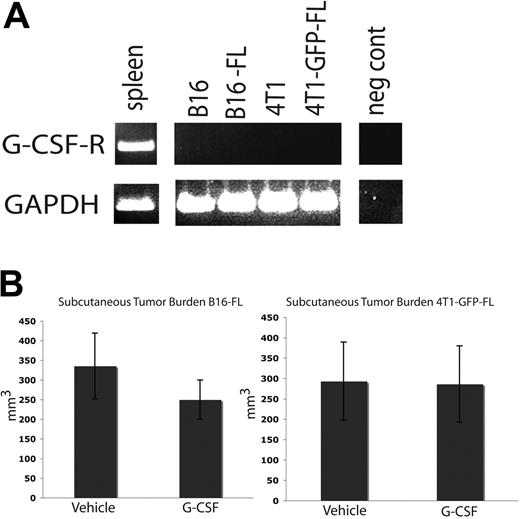
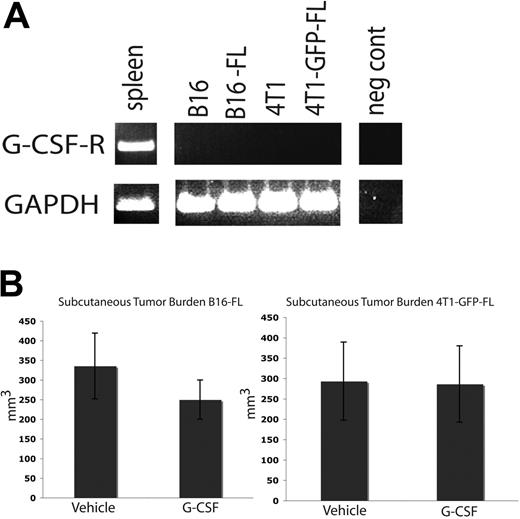
The tumor cell lines used in these studies do not express G-csf-r (Figure 6A). As such, G-CSF should not have a direct signaling effect on the tumor cells. We administered an 8-day course of G-CSF or vehicle to wild-type C57BL/6 and BALB/c mice as described above, and injected B16-FL cells or 4T1-GFP-FL murine breast cancer cells subcutaneously on the fifth day of drug administration. Subcutaneous tumors were measured 12 days after tumor cell injection. No difference was seen in subcutaneous tumor volume between mice given G-CSF or vehicle (Figure 6B). These data further suggest that G-CSF does not directly affect tumor growth.
G-CSF administration does not affect subcutaneous tumor growth. (A) RT-PCR was performed on mRNA harvested from murine tumor cell lines. None of the tumor cell lines express the G-CSF receptor. Spleen cDNA was used as a positive control. (B) Mice were administered 200 μg/kg G-CSF (n = 5 for each cell line) or drug vehicle (n = 5 for each cell line) daily for 8 days. On the fifth day of administration, 5 × 10⁵ B16-FL or 4T1-GFP-FL tumor cells were injected subcutaneously. No significant difference in tumor volume was observed between G-CSF– and vehicle-administered mice 12 days post tumor injection (P = .33, B16-FL; P = .96, 4T1-GFP-FL). All error bars represent standard error of the mean.
G-CSF administration does not affect subcutaneous tumor growth. (A) RT-PCR was performed on mRNA harvested from murine tumor cell lines. None of the tumor cell lines express the G-CSF receptor. Spleen cDNA was used as a positive control. (B) Mice were administered 200 μg/kg G-CSF (n = 5 for each cell line) or drug vehicle (n = 5 for each cell line) daily for 8 days. On the fifth day of administration, 5 × 10⁵ B16-FL or 4T1-GFP-FL tumor cells were injected subcutaneously. No significant difference in tumor volume was observed between G-CSF– and vehicle-administered mice 12 days post tumor injection (P = .33, B16-FL; P = .96, 4T1-GFP-FL). All error bars represent standard error of the mean.
Enhancement of tumor burden in bone occurs independently of neutrophil mobilization
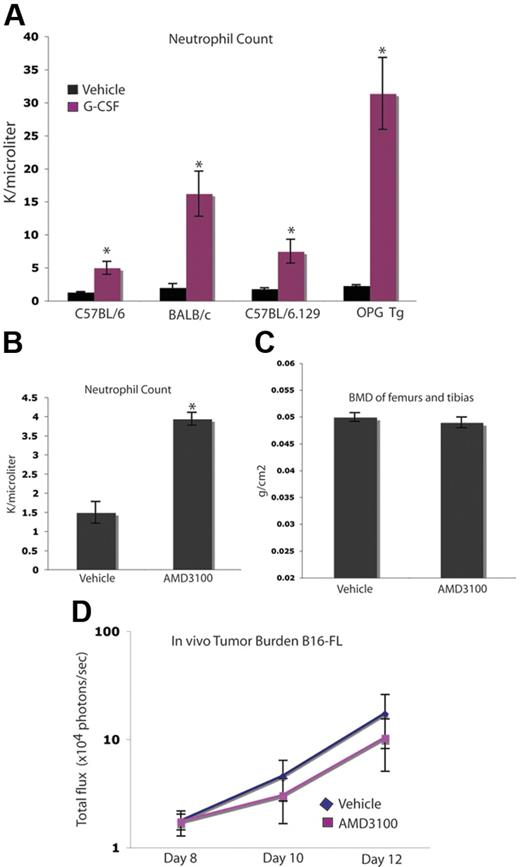
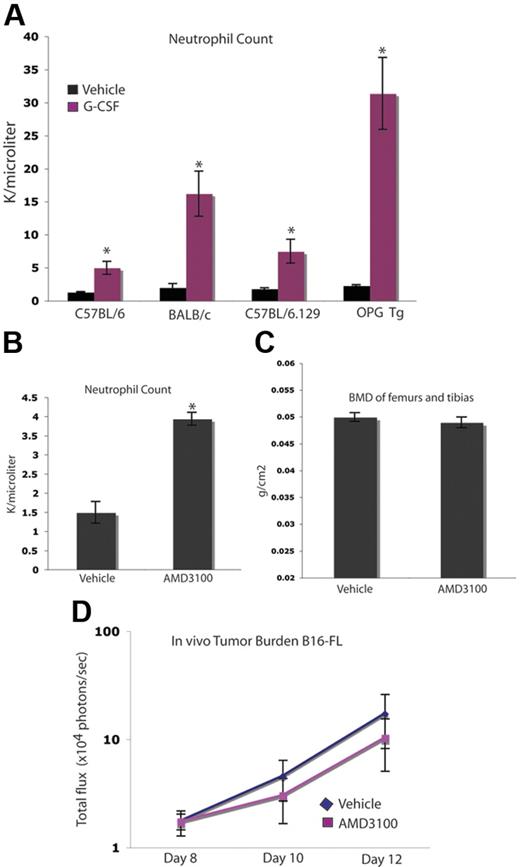
As expected, G-CSF administration stimulated the genesis of neutrophils and their mobilization into the peripheral blood in all mouse strains used in these studies, including the osteopetrotic OPGTg mice (Figure 7A). We wanted to determine whether or not neutrophil mobilization played a role in the observed G-CSF–mediated enhancement of tumor growth in bone. To do so, we used an alternate agent, AMD3100, a CXCR4 inhibitor that mobilizes neutrophils and hematopoietic progenitors. A short course of AMD3100 mobilized neutrophils, but did not alter BMD compared with vehicle-administered animals, suggesting that AMD3100 has little effect on bone resorption (Figure 7B-C). This dosing schedule allowed for 3 days of peak mobilization comparable with that seen in the G-CSF administration schedule, as AMD3100-administered animals develop neutrophilia after the first dose, while G-CSF administration requires approximately 5 days to reach peak mobilization. Therefore, mice given either of these agents were administered drug for 3 days following peak neutrophila. Administration of this short 3-day course of AMD3100 did not alter tumor growth in bone compared with vehicle (Figure 7D). Taken together, these data suggest that the effect of G-CSF on OCs and tumor growth occurs independently of neutrophil mobilization.
Increased tumor growth occurs independently of neutrophil mobilization. (A) C57BL/6, BALB/c, OPGTg, and OPGTg wild-type littermate mice (C57BL/6.129) were administered 200 μg/kg G-CSF (n = 3 each genotype) or vehicle (n = 3 each genotype) daily for 8 days. After treatment (24 hours), blood was collected and a CBC was performed to confirm G-CSF–induced mobilization of neutrophils. All genotypes mobilized neutrophils upon G-CSF administration compared with vehicle (P = .01, C57BL/6; P = .04, BALB/c; P = .02, C57BL/6.129; P = .006, OPGTg). (B) C57BL/6 mice were administered 5 mg/kg AMD3100 (n = 3) or vehicle (n = 3) for 3 days. After the final dose (3 hours), blood was collected and a CBC was performed to confirm AMD3100-induced neutrophil mobilization. AMD3100-administered mice mobilized neutrophils compared with vehicle (P < .005). (C) DEXA was used to measure BMD on formalin-fixed bones of C57BL/6 mice administered AMD3100 or drug vehicle. No difference in BMD was seen in bones from mice administered AMD3100 (n = 10) compared with vehicle-administered (n = 10) animals (P = .42). (D) C57BL/6 mice were administered 5 mg/kg AMD3100 or vehicle subcutaneously for 3 days. After the first dose (3 hours), 104 B16-FL tumor cells were injected into the right tibia. Tumor burden was assessed by bioluminescence imaging at days 8, 10, and 12 after tumor cell injection. No increase in tumor burden was seen in the AMD3100-administered (n = 4) mice compared with the vehicle-administered (n = 5) animals (P = .74). All error bars represent standard error of the mean. Asterisks denote statistical significance.
Increased tumor growth occurs independently of neutrophil mobilization. (A) C57BL/6, BALB/c, OPGTg, and OPGTg wild-type littermate mice (C57BL/6.129) were administered 200 μg/kg G-CSF (n = 3 each genotype) or vehicle (n = 3 each genotype) daily for 8 days. After treatment (24 hours), blood was collected and a CBC was performed to confirm G-CSF–induced mobilization of neutrophils. All genotypes mobilized neutrophils upon G-CSF administration compared with vehicle (P = .01, C57BL/6; P = .04, BALB/c; P = .02, C57BL/6.129; P = .006, OPGTg). (B) C57BL/6 mice were administered 5 mg/kg AMD3100 (n = 3) or vehicle (n = 3) for 3 days. After the final dose (3 hours), blood was collected and a CBC was performed to confirm AMD3100-induced neutrophil mobilization. AMD3100-administered mice mobilized neutrophils compared with vehicle (P < .005). (C) DEXA was used to measure BMD on formalin-fixed bones of C57BL/6 mice administered AMD3100 or drug vehicle. No difference in BMD was seen in bones from mice administered AMD3100 (n = 10) compared with vehicle-administered (n = 10) animals (P = .42). (D) C57BL/6 mice were administered 5 mg/kg AMD3100 or vehicle subcutaneously for 3 days. After the first dose (3 hours), 104 B16-FL tumor cells were injected into the right tibia. Tumor burden was assessed by bioluminescence imaging at days 8, 10, and 12 after tumor cell injection. No increase in tumor burden was seen in the AMD3100-administered (n = 4) mice compared with the vehicle-administered (n = 5) animals (P = .74). All error bars represent standard error of the mean. Asterisks denote statistical significance.
Discussion
We have found that G-CSF administration increased markers of bone resorption, increased osteoclastogenesis in vivo and in vitro, and promoted significant bone loss in vivo. The magnitude of bone loss observed was similar to that seen in mouse models of oophorectomy.24,37 This is a clinically significant point, as oophorectomy models mimic the bone loss seen in postmenopausal women due to a decline in estrogen.38
Further, in 2 independent murine osteolytic bone tumor models, G-CSF administration enhanced tumor growth in the bone marrow cavity. As expected, increased neutrophils were observed in the bone marrow of all G-CSF–adminstered animals (data not shown). Others have suggested that neutrophils can induce an angiogenic switch promoting tumorigenesis.39 However, G-CSF had little effect on tumor growth in bone in OC-defective mice despite the increased neutrophils seen in this setting, suggesting that at least part of the increased tumor growth seen in G-CSF–administered animals is through OC activation. Furthermore, mice treated with a shorter course of the clinical neutrophil-mobilizing agent AMD3100 (a CXCR4 inhibitor) did not demonstrate enhanced tumor growth in the bone. These results suggest that increased OC resorption enhances tumor growth in bone.
In the experiments described in this paper, G-CSF was not administered after chemotherapy as it is typically given in the clinical setting, and as such, G-CSF was used as a tool to pharmacologically increase OC activity prior to tumor inoculation into the bone marrow cavity. We cannot extrapolate these data to the clinical context because we administered G-CSF without chemotherapy. Clinically, G-CSF is routinely used in patients with cancer undergoing chemotherapy to reduce the risk of febrile neutropenia and related events, including sepsis mortality. Several other groups have suggested that G-CSF can induce bone turnover and inhibit bone formation.15-17 In light of the fact that OC activity is believed to enhance tumor cell growth within bone,1,5 we chose to investigate the role of G-CSF on bone turnover and tumor growth in 2 validated animal models of osteolytic tumors.
We have demonstrated in vivo that increased OC activity induced by G-CSF affects tumor growth within bone. Several groups have demonstrated that tumor-mediated increased osteoclastic resorption leads to release of stored growth factors such as TGFβ,40 and that tumor cells overexpressing the TGFβ receptor can respond to these growth factors, leading to more severe osteolytic lesions in the bone.3,4 In addition, it has been shown that therapies which disrupt OCs, such as bisphosphonate treatment, can lead to decreased tumor burden within the bone.41,42
OCs have been shown to directly promote tumor cell survival and growth through a mechanism requiring direct cell-cell contact.43 In our study, G-CSF administration did result in increased OC numbers, and we cannot rule out an effect on tumor growth in bone by direct OC–tumor cell contact. We demonstrated that macrophages and OCs express G-CSF-R, and stimulation with G-CSF increases osteoclastogenesis. Because G-CSF administration has also been associated with a decrease in OB number, it is possible that the balance within the bone marrow has been shifted, thereby altering the ratio of mature OBs to pre-OBs after G-CSF administration. As pre-OBs produce more RANKL than mature OBs,44 this shift in balance may offer another explanation for the enhanced osteoclastogenesis observed with G-CSF administration. Furthermore, preliminary studies in our lab have suggested that genetic disruption of Cxcr4 on macrophages and OCs actually leads to an increase in OC number and activity. As G-CSF has previously been shown to disrupt the SDF-1/CXCR4 chemokine axis,14 this offers another potential mechanism by which G-CSF enhances osteoclastogenesis.
Numerous randomized clinical trials using G-CSF to support chemotherapy have shown no adverse effects on survival or bone metastases. In fact, women undergoing dose-dense chemotherapy with G-CSF support demonstrate increased disease-free survival compared with standard chemotherapy dosing without G-CSF.45,46 We did not treat our mice with chemotherapeutic agents concurrently with G-CSF treatment. As such, we cannot be certain that the increased tumor burden resulting from G-CSF–induced OC activity would be seen in the presence of chemotherapy. It is theoretically possible that increased OC activation mediated by G-CSF could enhance the effectiveness of cytotoxic chemotherapy by increasing tumor cell proliferation/entry into the cell cycle in the bone marrow. Future studies will be aimed at determining whether or not chemotherapy can mitigate any of the increased tumor burden effects that we have observed in this animal model of osteolytic bone tumors.
Our data suggest that the possibility that the beneficial effects of chemotherapy and G-CSF on disease-free survival could be further improved with attention to prevention of therapy-induced bone resorption. Increasing awareness of the impact on osteoporosis and increased bone resorption from cancer treatment-induced bone loss, such as antihormone therapies for breast and prostate cancer, has resulted in clinical trials evaluating bone loss prevention and detection strategies.38,47,48 Our results suggest that enhancement of osteoclastogenesis from cancer therapies may not only lead to osteoporosis and increased fracture risk, but could enhance tumor growth in bone. These data underscore the importance of OC activity in promoting tumor growth in bone. Future studies should be aimed at evaluating bone loss and subsequent bone marrow metastases in patients with cancer who receive therapies that enhance bone resorption.
Authorship
Contribution: A.C.H. designed research, performed research, collected/analyzed data, and wrote the manuscript; O.U. performed research and generated B16-FL cells; E.A.M. performed research and contributed to writing of the manuscript; M.E. and J.L.P. performed research; D.P.W. provided analytical tools (in vivo imaging) and contributed to the writing of the manuscript; K.T. statistically analyzed bioluminescence data; A.A. performed research and contributed to writing of the manuscript; and K.W. designed research and contributed to the writing of the manuscript.
Conflict-of-interest statement: The authors declare no competing financial interests.
Correspondence: Katherine Weilbaecher, Washington University School of Medicine, 660 S. Euclid Ave, Box 8069, St Louis MO, 63110; e-mail: kweilbae@im.wustl.edu.
The online version of this manuscript contains a data supplement.
An Inside Bloodanalysis of this article appears at the front of this issue.
The publication costs of this article were defrayed in part by page charge payment. Therefore, and solely to indicate this fact, this article is hereby marked “advertisement” in accordance with 18 USC section 1734.
We thank Dr Daniel Link, Dr Steven Teitelbaum, Dr Paddy Ross, Dr F. Liu, Dr Glen Begley, Dr Paul Kostenuik, Kristin Bibee, and Valarie Salazar for helpful discussions, and Hongju Deng, Elyse Cohen, and Ivana Rosova for technical assistance. OPGTg mice were kindly provided by Dr Scott Simonet of Amgen. We also thank Trey Coleman and the Center for Nutrition Research Unit for assistance with DEXA scanning supported by grant no. DK56341.
This work was supported by National Institutes of Health/National Cancer Insitute grants R01 CA097250 (K.W. and C.E.), P50 CA94056 (J.L.P. and D.P.-W.), T32 HL007088 (A.C.H.), T32 CA09547 (O.U.), T32 GM7200 (E.A.M.), DK5634, and P30 CA091842.

