Abstract
We examined copy number changes in the genomes of B cells from 58 patients with chronic lymphocytic leukemia (CLL) by using representational oligonucleotide microarray analysis (ROMA), a form of comparative genomic hybridization (CGH), at a resolution exceeding previously published studies. We observed at least 1 genomic lesion in each CLL sample and considerable variation in the number of abnormalities from case to case. Virtually all abnormalities previously reported also were observed here, most of which were indeed highly recurrent. We observed the boundaries of known events with greater clarity and identified previously undescribed lesions, some of which were recurrent. We profiled the genomes of CLL cells separated by the surface marker CD38 and found evidence of distinct subclones of CLL within the same patient. We discuss the potential applications of high-resolution CGH analysis in a clinical setting.
Introduction
Chronic lymphocytic leukemia (CLL), the most common form of adult-onset leukemia in the Western world,1,2 is typically an indolent disease. Although CLL will not always progress to an advanced stage within the otherwise normal lifespan of the patient, CLL can evolve over time into a more dangerous and lethal disease. Patients who first present with CLL usually are not treated, because no statistically significant benefits from treatment in early stages of the disease have yet been demonstrated. Therefore, the ability to identify patients at greatest risk (ie, those harboring lesions associated with poor prognosis but who have not yet progressed) would offer an opportunity for selective and more effective therapy. Survival might be increased by treating patients with markers of advanced disease and sparing those without the toxic effects of therapy.
The heterogeneity of disease progression led to the Rai and Binet staging systems, which remain the standard for tracking the disease and evaluating conditions for treatment.3,4 However, neither method can project the course of the disease in those patients diagnosed at early stages. Currently, several molecular markers, such as the presence or absence of immunoglobulin variable region (IgVH) somatic mutations, and expression of CD38 and 70-kDa ζ-associated protein (ZAP-70), appear to have prognostic value,1,5-8 although each are limited in their ability to predict disease progression, patient survival, and resistance to therapy.
Improved prognosis might also be achievable by genome analysis. Cytogenetics,9-11 fluorescent in situ hybridization (FISH),12,13 and comparative genome hybridization (CGH)14 have revealed DNA segment gains (eg, partial or complete trisomy 12) and deletions (eg, 13q14.2, 11q22-q23, 17p13, and 6q21), which occur sporadically in CLL. Some of these loci correlate with prognostic outcomes but to varying degrees.10,12,15,16 The sparsity of evidence linking these loci with specific genes indicates our incomplete understanding of the disease and reflects the inadequacy of present tools for assessing chromosomal damage. We therefore conducted the present study with the aim of better describing the genomic abnormalities that occur in CLL and to enhance the understanding of the ongoing evolution of genetic lesions in patients with CLL.
We began our initial study of the genomic landscape with close to 60 samples of CLL. We compared the leukemic genome with the patient's normal DNA by using a high-resolution CGH technique called representational oligonucleotide microarray analysis (ROMA).17,18 We designed oligonucleotide hybridization microarrays of 85 000 and 390 000 probes. On average, the resolution of the 85K and 390K arrays is a probe every 35 kb and 9 kb, respectively. In principle, each probe is a detector capable of measuring the relative “gene copy number” in a leukemic genome; however, to infer true copy number changes with greater confidence, we used no fewer than 4 consecutive probes. The resolution of our study still exceeds previously published CGH studies on CLL. We also examined some CLL samples at a resolution of 2.1 million probes to understand how the landscape changes when we use an even-greater sensitivity and, in comparison with previous studies, we observed far more cases of CLL with lesions, and more lesions per case.
Resolution by ROMA is so high and the method is so sensitive that we can examine the clonal heterogeneity of CLL within the same patient from mixed subpopulations. The presence of greater than 30% of B cells with the CD38 cell-surface marker has been associated with poor outcome in patients with CLL.5 It is an open question whether this occurrence reflects genetic heterogeneity and possibly clonal evolution. To investigate this possibility, we analyzed CD38+ and CD38− fractions from individual patients and demonstrated that 3 of the 4 patients examined had undergone intraclonal diversification, leading to new subclones of appreciable size. Our studies indicate that complete analyses of genome stability and prognosis require high-resolution comparative genomic hybridization.
Methods
Patient samples
The Institutional Review Board of the North Shore–Long Island Jewish Health System approved these studies. After obtaining informed consent in accordance with the Declaration of Helsinki, 58 patients with CLL, diagnosed according to National Cancer Institute (NCI) Working Group criteria, were studied. Venous blood was taken and peripheral blood mononuclear cells (PBMCs) were separated by Ficoll-Hypaque density gradient centrifugation. Next, B cells were isolated by negative selection with the use of a B-cell isolation kit (Miltenyi Biotec, Auburn, CA), yielding fractions with more than 92% CD19+ cells.
CLL clones were analyzed for IgVH gene mutations and CD38 expression as described.5,19 CLL clones expressing IgVH genes differing by 2% or more from the most similar germline gene were defined as “mutated CLL” (M-CLL), and clones expressing IgVH genes with a less than 2% difference from germline gene as “unmutated CLL” (U-CLL). Clones containing 30% or greater CD38-expressing cells were considered CD38+ and those with less than 30% CD38−. In some instances, PBMCs from patients with CLL were labeled with mouse monoclonal IgG1 antihuman CD5 FITC, CD38 PE, and CD19 APC (BD Biosciences, Franklin Lakes, NJ) and a BD FACSAria was used to collect in parallel CD19+CD5+CD38+ and CD19+CD5+CD38− gated fractions. After sorting, cells were washed 3 times in phosphate-buffered saline (PBS), pelleted, and stored at −80°C until DNA extraction for ROMA was performed.
DNA extraction
Genomic DNA was extracted from purified B cells and PMN cells with the use of the Puregene genomic DNA purification kits (Gentra Systems; QIAGEN, Valencia, CA), according to the manufacturer's instructions. Genomic DNA was subsequently stored at −20°C until used.
ROMA
We examined all CLL genomes with ROMA, a form of CGH that uses genomic representations.18,20 Complexity-reducing representations of genomic DNA were hybridized to microarrays of 50-mer oligonucleotide probes designed from the sequence of the human genome.21 Samples were mainly hybridized on 2 platforms: 85K arrays based on BglII representations, and 390K arrays based on DpnII representations depleted of DpnII fragments containing AluI sites (“depleted” representations).18 Array probes were chosen to be complementary to the complexity-reduced representations. All arrays were manufactured by NimbleGen (NimbleGen, Madison, WI).
ROMA greatly increases signal-to-noise ratios in CGH and diminishes the amount of sample needed for analysis. All hybridizations were performed in color reversal to prevent color bias and ensure data quality.22,23 A few samples were hybridized without representation and without color reversal on NimbleGen's high-density, 2.1-million-probe prototype array (HD2).
The preparation of genomic representations, labelings, and hybridizations were performed as described previously.18,20,24 In brief, complexity-reduced representations, consisting of small fragments (200-1200 bp for the 85K and 150-400 bp for 390K) were amplified by adaptor-mediated polymerase chain reaction (PCR) of genomic DNA. DNA samples (2 μg) were labeled either with Cy5-dCTP or Cy3-dCTP with the use of the Amersham-Pharmacia MegaPrime labeling kit (Amersham Biosciences, Piscataway, NJ) and competitively hybridized to each other on the same slide. Each sample genome was analyzed in duplicate, where the Cy5 and Cy3 dyes were swapped with the control (ie, “color reversal”). Hybridizations consisted of 35 μL hybridization solution (37% formamide, 4× saline sodium citrate [SSC], 0.1% sodium dodecyl sulfate [SDS], and labeled DNA). Samples were denatured in an MJ Research Tetrad (Bio-Rad, Hercules, CA) at 95°C for 5 minutes, and then preannealed at 37°C for no more than 30 minutes. The solution was then applied to the microarray and hybridized under a coverslip in an oven at 42°C for 14 to 16 hours. Thereafter, slides were washed 1 minute in 0.2% SDS/0.2× SSC, 30 seconds in 0.2× SSC, and 30 seconds in 0.05× SSC. Slides were dried by centrifugation and scanned immediately. We used an Axon GenePix 4000B scanner (MDS Analytical Technologies, Toronto, ON) with a pixel size of 5 μm.
A limited number of samples was hybridized to a prototype HD2 array. In brief, 1μg of both CLL cells and corresponding control PMN DNAs were mixed with either 5′ Cy5- or 5′Cy3-labeled random nanomers (TriLink, San Diego, CA) to a final concentration of 9 pg/μL, in 100 μL of the 9-mer buffer (50 mmol/L Tris, 5 mmol/L MgCl2, 1.75 μL/mL β-mercaptoethanol). Samples were denatured for 10 minutes at 100°C, followed by the addition of 20 μL labeling buffer (10 mmol/L Tris, 1 mmol/L ethylene diamine tetraacetic acid [EDTA], 200 μmol/L dNTPs, 100 units of Klenow). The samples were incubated at 37°C for 3 hours and then isopropanol-precipitated. Then, 30 μg of each Cy5- and Cy3-labeled DNAs were competitively hybridized at 42°C for 3 days in a NimbleGen 12-bay hybridization system (NimbleGen). The slides were washed and scanned as above.
Informatics
Microarrays were scanned and gridded with GenePix Pro 4.0 software (MDS Analytical Technologies, Toronto, ON) and data were imported into S-Plus 2000 analysis software (Insightful, Seattle, WA). The data were normalized with a Lowess curve-fitting algorithm, followed by a local normalization previously described in Hicks et al.20 After placement in genome order, the mean of log ratios was computed for color reversal experiments for each sample. Microarray data have been deposited in the Gene Expression Omnibus database under accession number GSE12794 (http://www.ncbi.nlm.nih.gov/geo/query/acc.cgi?acc=GSE12794).
Segmentation was performed on the aforementioned data. Segments are defined as nonoverlapping, genomic regions where copy number has changed. Our segmentation method is based on the minimization of the square-sum of differences between log-ratios and means (squared deviation) over segments larger than 4 probes in size. Initially, the segmenter searches for breakpoints that might be boundaries of segments. The first known breakpoint on a given chromosome is its first probe. For a given breakpoint, a 100-probe window to its right is selected. The sum of squared deviations of the flanking probes is calculated for each probe within this window. A probe whose squared deviation value produces a local minimum with respect to its neighbors and is below a threshold of 95% of the square deviation within a window is accepted as a new, known breakpoint. Whenever a probe is found below the threshold in the newly defined region, the segmenter recursively breaks said region into 2 pieces until it cannot find any further breakpoints therein. If no breakpoints are found, the 100-probe window is shifted by half its size, and this procedure continues until a chromosome end is reached.
Initial segments are constructed by the use of found breakpoints. Each segment and its neighbors are validated for significance by the Kolmogorov-Smirnov (K-S) algorithm. If the P value of compared segments is less than 10−5, then the said segment is accepted as real. If not, the segments are merged. The segmenter also reports statistics such as mean, standard deviation, and median for each segment. We viewed graphs of all ratio data and the algorithmically derived segmentation patterns for each sample (eg, Figures 1,Figure 2,Figure 3–4) to assure data quality.
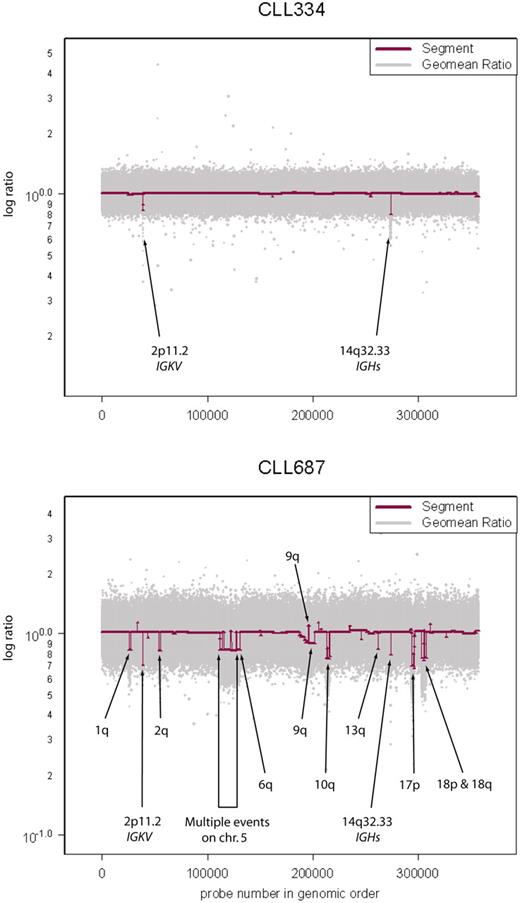
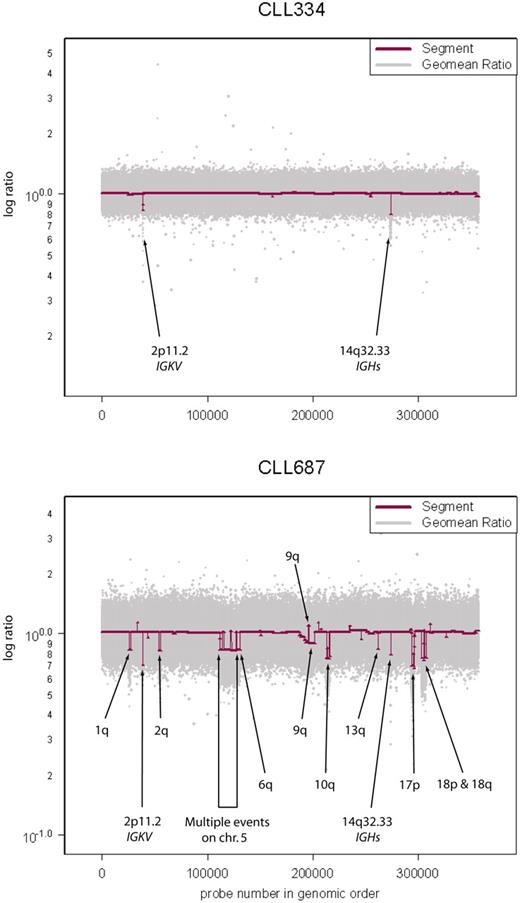
Variation in genome stability of CLL. Sample CLL334 has a stable genome with immunoglobulin recombinations at 2p11.2 and 14q32.33 as the only “lesions.” Raw geometric mean data (Geomean Ratio) are shown in light gray and segmenter output (Segment) in maroon. Sample CLL687 has a very unstable genome exhibiting multiple lesions in addition to the immunoglobulin recombinations described in sample CLL334.
Variation in genome stability of CLL. Sample CLL334 has a stable genome with immunoglobulin recombinations at 2p11.2 and 14q32.33 as the only “lesions.” Raw geometric mean data (Geomean Ratio) are shown in light gray and segmenter output (Segment) in maroon. Sample CLL687 has a very unstable genome exhibiting multiple lesions in addition to the immunoglobulin recombinations described in sample CLL334.
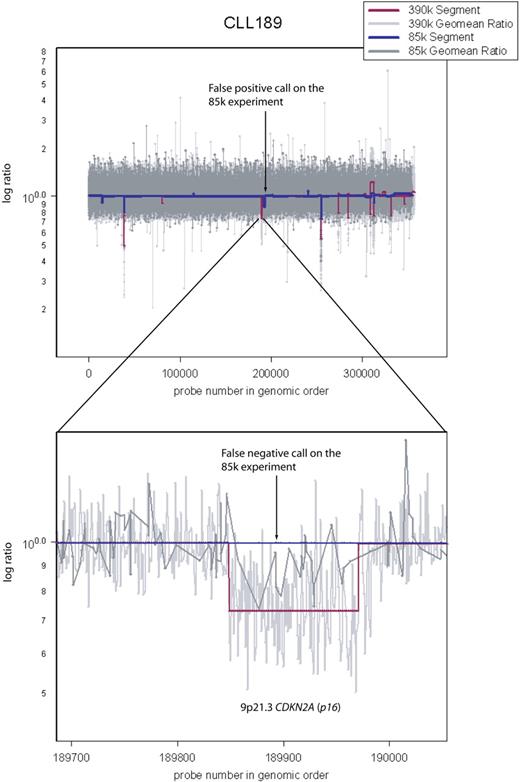
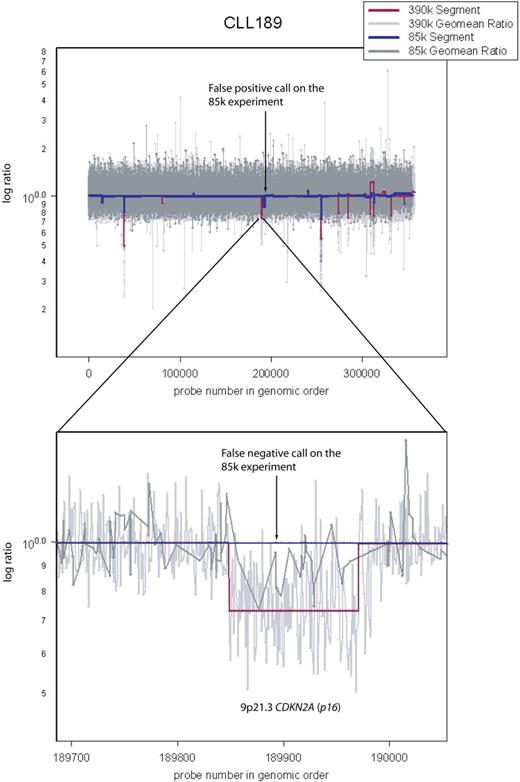
Comparison between the 85K array and the 390K array. Sample CLL189 was hybridized both on 85K and 390K arrays. Arrow points to a false-positive call on the 85K array data by the segmenter. Also shown is a false-negative call by the segmenter on the 85K data (dark blue). It spans CDKN2A (p16−INK4). Because the 85K array did not have sufficient coverage in this region, the segmenter could not make a reliable lesion call, even though it appears obvious upon inspection of the 85K raw data (dark gray).
Comparison between the 85K array and the 390K array. Sample CLL189 was hybridized both on 85K and 390K arrays. Arrow points to a false-positive call on the 85K array data by the segmenter. Also shown is a false-negative call by the segmenter on the 85K data (dark blue). It spans CDKN2A (p16−INK4). Because the 85K array did not have sufficient coverage in this region, the segmenter could not make a reliable lesion call, even though it appears obvious upon inspection of the 85K raw data (dark gray).
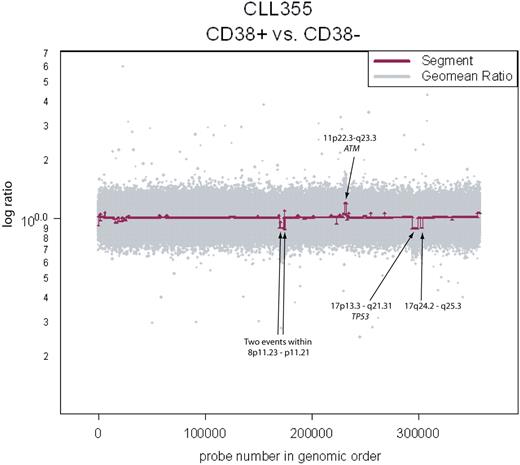
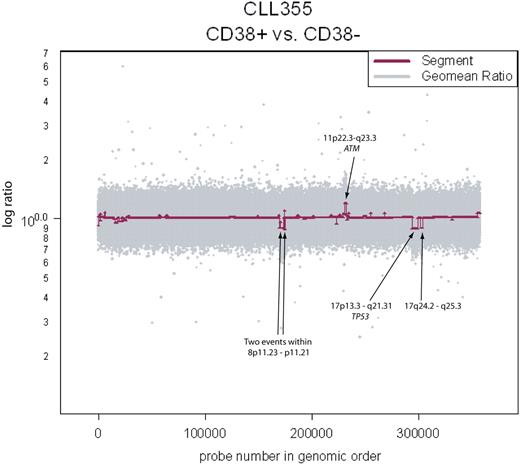
Clonality between the CD38+ and CD38− fractions in CLL355. Copy number aberrations are clearly visible and span known loci of clinical significance.
Clonality between the CD38+ and CD38− fractions in CLL355. Copy number aberrations are clearly visible and span known loci of clinical significance.
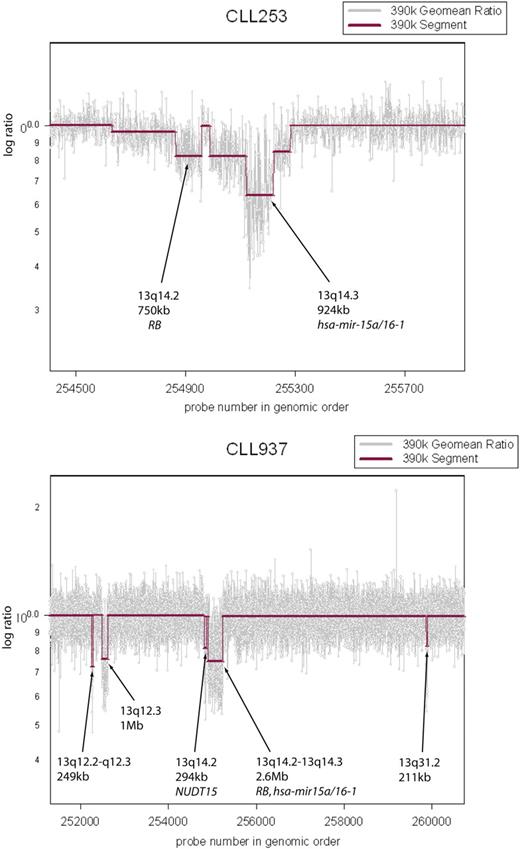
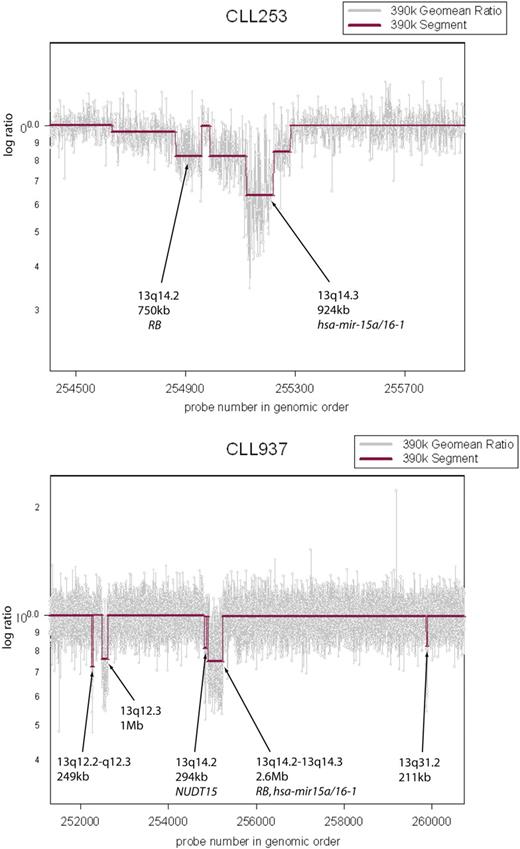
Multiple lesions observed in the 13q region. CLL cells from patient CLL253 exhibit 2 distinct lesions on 13q. RB is hemizygously deleted and the hsa-mir-15a/16-1 cluster is homozygously lost. Sample CLL937 exhibits multiple, distinct lesions on 13q.
Multiple lesions observed in the 13q region. CLL cells from patient CLL253 exhibit 2 distinct lesions on 13q. RB is hemizygously deleted and the hsa-mir-15a/16-1 cluster is homozygously lost. Sample CLL937 exhibits multiple, distinct lesions on 13q.
Segmented data were further annotated with a script we developed to query a local UCSC hg18 database mirror to annotate segments for genome objects (ie, genes, RNA genes, pathway information, gene ontology [GO] terms) within, as well as spanning breakpoints (not shown) to facilitate further data analysis.
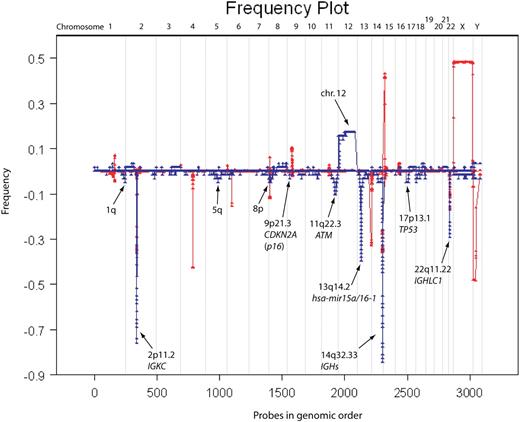
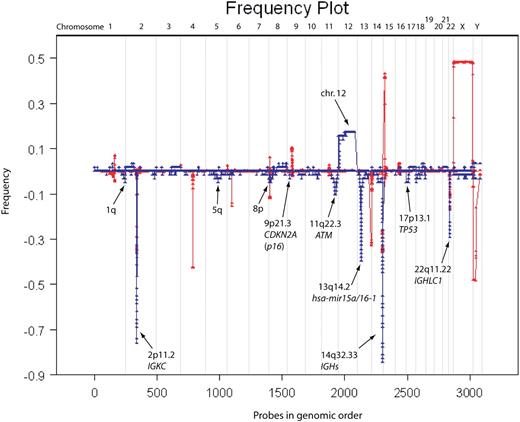
Frequency plots were computed on the segmented data from 58 CLL samples hybridized to 390K arrays with 1.1 and 0.9 (1/1.1) as upper and lower cutoff values (Figure 5). A copy number variant (CNV) database based on our ROMA platforms was used to ensure the lesions observed in our dataset are not in fact CNVs. CNV frequencies were determined from a set of 500 profiles of cancer-free genomes, hybridized on the NimbleGen 85K array platform.
Frequency plot of all CLL samples versus normal CNV database. The frequency plot for 58 CLL samples is shown in blue and that of 500 “normal” (ie, disease-free) individuals is shown in red. The red frequency plot shows CNVs in the human genome and was used to eliminate any CNVs in our data exposed through copy-neutral LOH (ie, regions in which CNVs overlap with lesions observed in CLL). Most lesions observed in CLL are deletions and trisomy 12. Regions of interest are marked with arrows.
Frequency plot of all CLL samples versus normal CNV database. The frequency plot for 58 CLL samples is shown in blue and that of 500 “normal” (ie, disease-free) individuals is shown in red. The red frequency plot shows CNVs in the human genome and was used to eliminate any CNVs in our data exposed through copy-neutral LOH (ie, regions in which CNVs overlap with lesions observed in CLL). Most lesions observed in CLL are deletions and trisomy 12. Regions of interest are marked with arrows.
Results
Strategic approach
CLL cells and neutrophils (PMNs) were prepared from peripheral blood samples as described in “DNA extraction.” We compared the respective DNAs by using patient PMNs as the normal genome. By comparing the CLL genome to the normal genome from the same patient, as opposed to an unrelated normal, we intrinsically avoid detecting copy number mutations that are frequent occurrences in the human gene pool and that might otherwise be mistaken for recurrent genomic lesions in CLL.
Although we compare CLL to normal cells from the same person, it is still possible to confuse a copy number variation with a leukemic lesion because loss of heterozygosity (LOH) in the leukemia, such as arising by gene conversion, could unmask a heterozygous copy number variant present in the patient's germline. To guard against this, we also compared the PMN genome to an unrelated normal, by which method we can detect most germline copy number variants that could be unmasked by LOH. Comparing PMN DNA to an unrelated normal also rules out a genomic abnormality arising in the PMN lineage (eg, Figure S1, available on the Blood website; see the Supplemental Materials link at the top of the online article). Even this expedient, meant to avoid confusing copy number variation and leukemic lesions, fails when both patient, normal DNA, and the DNA from an unrelated, normal control share the same copy number polymorphism. To further safeguard against this last source of error in interpretation, we also compared our results to a database of copy number variants derived from 500 healthy humans (see, eg, Table S1 and Figure 5).
Most of our samples were analyzed on 2 platforms, 85K and 390K ROMA arrays. This strategy has given us independent validation of variation seen at the 85K resolution (addressing false positives) and enabled us to assess reliably the value of increased resolution (addressing false negatives). For example, Figure 2 illustrates a deletion at CDKN2A (p16−INK4) in CLL 189 that is detected as a segment in the 390K data but missed as a segment in the 85K data, although it is plainly present by visual inspection. Our estimate of the false-positive rate for the 85K array data is 3% (1/34) based on a discrepancy between events detected with the 85K array and not detected with the 390K array on identical samples. We do not have an independent estimate of the false-positive rate for the 390K array data, but we have no reason to believe it is greater than that of the 85K array.
Detailed summary of ROMA data
The number of lesions detected in samples is highly variable (eg, Figure 1). The leukemia sample CLL 334 of Figure 1 did not display any lesions at 390K (except of course for rearrangements at loci encoding immunoglobulins). However, even that sample displayed genomic lesions when analyzed on the 2.1-million–probe high-resolution array (Figure S2, HD2).
Tables S1 (frequency plot summary) and S2 (segmented data summary) contain our summary of findings from hybridizations performed on 390K microarrays (58 CLL samples), including the boundaries of all leukemic events. We defined the minimal regions of overlap for all the recurrent lesions, determined their frequency and the number of genes therein, and compared them to the frequencies of known CNVs. We excluded from Table S1 rearrangements at the immunoglobulin loci but not for α (13q14.2) and β (7q34) T-cell receptor (TCR) loci. TCR is known to recombine in malignant B cells, although the mechanism permitting this is yet unknown.25,26 Figure 5 is a graphical representation of all the segmented data from the 58 profiles, including the immunoglobulin loci. Thus, the height at each locus reflects the number of times an event had been observed there. This figure also contains frequency plots of CNVs derived from a study of 500 normal humans. There was no significant overlap between the set of known CNVs and the genomic changes we observe in CLL.
With the exception of the deletion at 6q21, we observed all the previously reported major cytogenetic imbalances and in many cases to a greater resolution than found in the literature. The majority of lesions (315/419) are deletions and not amplifications (Figure 5), which is typical of CLL.
The common lesions include 11q, 13q, and 17p deletions as well as trisomy 12. Previously published reports observed the deletion at 6q21 in approximately 1.5% to 8% of samples.12,27-31 Because we have sufficient probe coverage (roughly 1000 probes in the 9.1-Mb region of 6q21), if this abnormality were present in our sample dataset, we would have observed it. The lack of observance of this lesion is possibly due to sampling error.
There are 18 distinct regions in which we have observed recurrent copy number mutations (duplications or deletions), 2 of which were novel. Table 1(an abridged version of Table S1) depicts our new information at recurrent loci. It includes the 2 newly identified regions, as well as recurrent regions, which are narrower as the result of our higher resolution.32-36 Novel regions, highlighted in yellow, are a 3.6-Mb deletion at 8p21.2-p12 and a 587-kb deletion at 2q37.1, including genes TRIM35 and SP100/110/140, respectively. Of the refined regions, a 249-kb region at 9p21.3 spanning the CDKN2A (p16−INK4) and a 156-kb region at 18q23 containing NFATC1 are particularly interesting. In the case of NFATC1, the minimal region of overlap spans that single gene.
Because breakpoints of both deletions and amplifications can disrupt the structure of a gene, we have analyzed all genes that span the breakpoints of deletions as well as amplifications. Genes were ranked according to how frequently breakpoints occur within them in all 58 samples (data not shown). Although no breakpoints were found within genes of known clinical significance such as ATM, TP53, and miR-15a/16-1, they were found to occur within genes flanking them. Furthermore, breakpoints were also frequently found in or near areas of segmental duplications.
Comparing ROMA to classical cytogenetics
The power of ROMA is further illustrated by its overall ability to detect lesions. Only one sample in our sample set (1.7%) did not have observable lesions when we analyzed it with the 85K and the 390K arrays compared with approximately 20% using FISH, 17% using chromosomal G-banding, and 15% using other CGH platforms.7,10-12,33-35 The increased resolution of ROMA allows the observation of lesions too fine to be identified with cytogenetics/FISH technologies or lower resolution CGH technologies. Although the median size of lesions we observe is 933 kb, the minimal lesion size observed is just 20 kb (Table S2, row 17). Previous claims of smallest observed lesions when the authors used CGH on CLL were 18 kb on a 644 probe BAC/PAC array and 70 kb on a 44K oligonucleotide array.33,37 These groups however, resorted to 2 probe confidence intervals to make these claims, whereas we use 4, giving us much greater confidence in our calls.
As might be expected, the use of a still greater resolution platform could reveal additional lesions too fine to be observed with current technologies. To explore this, we hybridized our most stable CLL genome (see Figure 1, CLL334) to a high-density, 2.1- million probe, prototype array (HD2). CLL334 exhibited no discernible lesions on either the 85K or the 390K array, apart from IGKC and IGH rearrangements, at 2p11.2 and 14q32.33, respectively. Hybridizing this sample to the HD2 array reveals multiple lesions, some of which occur within larger regions in our dataset. One example is an 8.3-kb event at 2q37.2 spanning 8 probes, which was too fine to be observed even by the 390K array on CLL334 (Figure S2).
Clonal cell population analysis (CD38)
Elevated numbers of CD38+ cells within a CLL patient's B-cell population have been associated with poor prognosis.5 It is as yet unclear whether the CD38+ cells arise from genetically distinct subpopulations of the CLL clone. To test this, we analyzed separated CD38+ and CD38− fractions of 4 CLL samples. Copy number differences were detected in 3 of 4 samples (Figure 3 and Table 2) at various loci throughout the genome, some of which are of clinical relevance (ie, ATM and TP53). Since we assayed CD38+/− fractions in a only small number of samples, conclusions cannot yet be drawn on the role of certain loci in generating this diversity. However, we have clearly provided evidence of continuing genetic evolution in the CLL clones of some patients, and such continuing evolution may be related to disease outcome.
Discussion
In recent years, CGH has emerged as a powerful tool for detecting chromosomal duplications and deletions at a greater resolution than cytogenetics. The use of classical cytogenetics has identified gross regions of genomic instability in CLL, for example, the common lesions, del 13q14.3, trisomy 12, del 11q22.3-23.2, and del 17p13.1. Enhanced cytogenetic techniques, such as refined G-banding, led to the narrowing of these lesions.11,14 CGH can detect novel lesions, ascertain the frequencies of gains and losses with greater accuracy, and pinpoint candidate genes associated with the disease within known regions of recurrent abnormality.33-35,37-39 Therefore, on the basis of previous experiences,14,40,41 it was reasonable to expect that increased resolution would yield more accurate delineation of previously described lesions as well as identification of new ones.
We used a high-resolution CGH to study CLL to consolidate existing knowledge of its genetics and to offer new insights into the nature of the disease. However, there is a danger to the application of high-resolution CGH techniques. Previous comparative studies, performed at lower resolution, have ignored the issue of normal variation in the human genome. This is dangerous because at the scale we used to scan CLL, the human genome is teeming with copy number variations.24,42 We took several precautions to guard against this. First and foremost, we compared the CLL genome to the normal genome from the same patient. Additional steps to guard against mistaking a genome copy number change in CLL with a copy number polymorphism are described in “Strategic approach” and the discussion of Figure 5 in “Results.”
Our results with high-resolution arrays validated all but one of the previous set of known CLL genomic lesions. We confirmed that even at high resolution, deletions are more abundant than amplifications. Previous studies report lesions in approximately 80% of cases,33-35,39 but we observed genomic lesions in all CLL samples. We saw lesions at most known loci at greater resolution than before, further delineating the complex epicenter of the highly recurrent deletion on 13q and shortening the list of candidate genes at other loci (see Table 1). Although the smallest lesion we observed at the 13q region was 60 kb in size, the minimal region of overlap from the frequency plot was just 26 kb in size and spans miR-15a/16-1 (Table S1, row 278). In addition, we observed multiple, discrete, genomic alterations in the 13q region, including miR-15a/16-1, Rb and others (Figure 4). This observation suggests even greater complexity of lesions in the 13q region.
In addition, we saw 2 recurrent lesions at new loci 2q37.1 and 8p21.2-p12 and many more genomic lesions at loci that were not recurrent. Our results suggest that the diversity of genomic aberrations in CLL is much greater than previously appreciated.
We used both a 390K array and an 85K array on most of our samples. By and large, the datasets agreed, but the 390K data showed somewhat more events (Figure 2). Still greater levels of resolution are now possible, so we hybridized a limited number of patient samples5 using our HD2 prototype array with 2.1 million probes, seeking to ascertain whether additional lesions could be observed. One of the patients studied, CLL334, exhibited no discernible lesions by either 85K or 390K analyses, other than rearrangements at IGKC and IGH (Figure 1). However, using the HD2 array, vastly more detail was observed, even at previously reported loci; see Figure S2 for one such example. We envision future studies that use HD2 will aid in narrowing down lesion breakpoints as well as uncovering many novel lesions that we did not observe with the 85K or 390K CGH platforms.
The amplitude of copy number changes (as observed in our figures) in CLL is often small, suggesting intraclonal heterogeneity. We estimate from doping experiments that we can observe lesions present in a minimum 30% of the total cell population. To find clearer evidence of intraclonal heterogeneity within patients, we searched for genomic differences between CD38+ and CD38− populations in the same patient. We chose the CD38 activation marker because CLL can differ in the proportion of cells expressing CD38, and patients with 30% or greater CD38+ cells have an unfavorable prognosis.5,7
If subclones within a patient harbor different genetic lesions and they have different proportions of cells expressing the CD38 marker at any given point in time, then we expect to observe these genomic differences by comparing CD38+ and CD38− fractions. Indeed, we observed copy number differences between CD38+ and CD38− fractions in 3 of 4 cases (Figure 3). Because the CD38 marker may be transiently expressed,43,44 our observation suggests that subclones of CLL spend differing amounts of time in the activated CD38+ state, compared with other clonal members that may be CD38+ or CD38−.
This type of analysis enabled us to time the occurrence of events, as events not shared between 2 populations must occur subsequently to their divergence. In one case, this involved a loss of the p53 locus in the CD38+ fraction, a marker that was not observed in the parallel CD38− fraction (Table 2). More generally, our observations point to the possibility of monitoring an aspect of the evolution of the disease that might have profound clinical significance. Within an overall apparently constant leukemic burden, the outgrowth of a subclone with additional genomic lesions might signal the start of a new phase of the disease. Additional studies, combining data on fractionated subpopulations with clinical outcomes, are needed to test this hypothesis.
In summary, we have demonstrated that ROMA is a highly sensitive CGH method to examine genomic changes in CLL. We have detected novel lesions, ascertained the frequencies of gains and losses with greater accuracy, and pinpointed candidate genes. The apparent continuing evolution of clones of CLL within a patient may lead to improved understanding of the disease and the ability to identify patients at risk. Overall, the capabilities we have demonstrated here offer opportunities for selective patient treatment and the identification of new therapeutic targets.
An Inside Blood analysis of this article appears at the front of this issue.
The online version of this article contains a data supplement.
The publication costs of this article were defrayed in part by page charge payment. Therefore, and solely to indicate this fact, this article is hereby marked “advertisement” in accordance with 18 USC section 1734.
Acknowledgments
We thank Linda Rodgers, Patty Bird, Michael Riggs, Christopher Algieri, and Anthony Leotta (Cold Spring Harbor Laboratory) and Herb Borerro and Stella Stefanova (Feinstein Institute for Medical Research) for their technical support.
This work was supported by grants to M.W. from the Karches Family Foundation (Locust Valley, NY) and the Simons Foundation (New York, NY). M.W. is an American Cancer Society Research Professor. N.C. and K.R.R. received support from the Karches Family Foundation, the Prince Foundation (Purchase, NY), and the Marks Foundation (Kings Point, NY).
Authorship
Contribution: V.G. designed and performed research, analyzed data, contributed data analysis tools, and wrote the paper; A.K. contributed data analysis tools and analyzed data; J.M. prepared the patient samples and performed research; B.L., J.K., B.Y., and Y.L. contributed data analysis tools; J.T., G.A., D.P., N.N., L.H., K.C., R.N.D., and C.C. performed research; S.A. and K.R. collected patient samples; N.C. designed research, prepared patient samples, and wrote the paper; M.W. designed research, wrote the paper; and D.E. designed and performed research, analyzed data, and wrote the paper.
Conflict-of-interest disclosure: The authors declare no competing financial interests.
Correspondence: Diane Esposito or Vladimir Grubor, Cold Spring Harbor Laboratory, 1 Bungtown Road, Cold Spring Harbor, NY 11724; e-mail: esposito@cshl.edu or grubor@cshl.edu.

