Abstract
Mantle cell lymphoma (MCL) is one of the most aggressive B-cell lymphomas. Although several protein-coding genes are altered, expression signature and importance of microRNA (miRNA) have not been well documented in this malignancy. Here, we performed miRNA expression profile in 30 patients with MCL using a platform containing 515 human miRNAs. Eighteen miRNAs were down-regulated and 21 were up-regulated in MCL compared with normal B lymphocytes. The most frequently altered miRNAs are decrease of miR-29a/b/c, miR-142-3p/5p, and miR-150 and increase of miR-124a and miR-155. Notably, expression levels of miR-29 family are associated with prognosis. The patients with significant down-regulated miR-29 had short survival compared with those who express relatively high levels of miR-29. The prognostic value of miR-29 is comparable with the Mantle Cell Lymphoma International Prognostic Index. Furthermore, we demonstrate miR-29 inhibition of CDK6 protein and mRNA levels by direct binding to 3′-untranslated region. Inverse correlation between miR-29 and CDK6 was observed in MCL. Because cyclin D1 overexpression is a primary event and exerts its function through activation of CDK4/CDK6, our results in primary MCL cells indicate that down-regulation of miR-29 could cooperate with cyclin D1 in MCL pathogenesis. Thus, our findings provide not only miRNA expression signature but also a novel prognostic marker and pathogenetic factor for this malignancy.
Introduction
Mantle cell lymphoma (MCL) constitutes approximately 5% to 10% of all non-Hodgkin lymphomas.1 Patients with MCL usually present with advanced disease. Chemotherapy in combination with monoclonal antibodies results in a short remission. Thus, MCL has the worst prognosis among non-Hodgkin lymphoma subtypes, with a median survival of approximately 3 years.2,3 However, a subset of patients exhibit a more chronic course and may not require treatment for prolonged periods of time, suggesting that the biologic mechanisms of this lymphoma could be more heterogeneous than initially thought.4 Given the poor clinical outcome and heterogeneity, many attempts have been made to identify genetic changes as prognostic markers and therapeutic targets for MCL. It has been shown that a blastic variant of MCL is associated with short survival.3 High tumor cell proliferation resulting from INK4a and p53 alterations is also linked to shorter survival.5-7
The genetic hallmark of MCL is the t(11;14)(q13;q32) translocation that displaces the cyclin D1 gene on chromosome 11 downstream to the enhancer region of the IgH gene on chromosome 14 and causes its overexpression. Although an elevated level of cyclin D1 is found in virtually all cases, experimental evidence suggests that this event alone is insufficient to result in lymphoma, and secondary genomic alterations are required. Indeed, genetic studies in MCL revealed that gains of chromosome 3q and losses of 8p, 9p, 9q, 13q, and 17p identify patients with a more aggressive clinical evolution.8 Several candidate genes within these regions have been suggested to play a role in MCL pathogenesis.
miRNA is a class of 22-nucleotide noncoding RNA, which is evolutionarily conserved. Although they do not encode proteins, miRNAs are transcribed by RNA polymerase II as independent units in the nucleus. The primary transcript is processed by the nuclear RNaseIII Drosha and its cofactor DGCR8/Pasha to generate precursor miRNA. The precursor miRNA is rapidly exported to the cytoplasm by exportin-5 in a ras-related nuclear protein (Ran)–GTP–dependent manner, where it is further processed by a second RNaseIII, Dicer, which cuts off the terminal loop and generates a mature approximately 22-nucleotide miRNA. The mature miRNA binds to the target mRNA 3′-untranslated region (UTR) and triggers either mRNA degradation or inhibition of translation, depending on degree of complementary between miRNA and its target.9,10 Accumulated studies have shown frequent deregulation of miRNAs in various human malignancies, including various types of leukemia,11-13 breast carcinoma,14,15 primary glioblastoma,16,17 lung cancer,18 papillary thyroid carcinoma,19 colon carcinoma,20 pancreatic tumors,21,22 and ovarian cancer.23 Deregulated miRNAs function as either oncogenes or tumor suppressors, and some of them have been implicated in chemoresistance23 and prognosis and tumor progression,24 whereas others can be used as diagnostic markers.25
In this report, we performed an miRNA expression profile in malignant B cells isolated from patients with MCL. Of 515 miRNAs analyzed, 18 were down-regulated and 15 were up-regulated. Notably, decreased expression levels of the miR-29 family (miR-29a, miR-29b, and miR-29c) are associated with short overall survival of patients with MCL. Further, we demonstrated that miR-29 directly regulates CDK6. Inverse correlation between miR-29 and CDK6 was observed in MCL cell lines and primary tumor specimens. These findings indicate that deregulation of miRNA is a common event in MCL and that miR-29 could be a valuable prognostic marker and pathogenetic factor in MCL.
Methods
Patients, tissue collection, and cell preparation
A total of 30 patients with MCL treated at H. Lee Moffitt Cancer Center were included in this study, which was approved by the Institutional Review Board. MCL diagnosis was made based on morphologic features, immunophenotype, cytogenetic and fluorescence in situ hybridization findings, and the presence of elevated cyclin D1. The following information was collected: age, sex, performance status, stages, number of extranodal sites involved, serum lactate dehydrogenase level, the presence or absence of B symptoms, and International Prognostic Index (IPI) and Mantle Cell Lymphoma International Prognostic Index (MIPI) scores (Table 1). Follow-up information was obtained from patients' medical records, including response to initial chemotherapy and overall survival (OS). Survival analysis was applied only to the patients who have 36-month follow-up.
All MCL specimens were from lymph nodes, except one from spleen. The characterization and purification of MCL samples were performed as described previously.26 Briefly, the tissues were sliced into small pieces, gently dispersed, and suspended into RPMI 1640 with 10% fetal bovine serum. For preparation of viable, sterile, single-cell suspensions, cells, obtained after low-speed centrifugation, are resuspended in media composed of 90% fetal bovine serum and 10% dimethyl sulfoxide either were frozen slowly or were first purified using a CD19 magnetic bead (Miltenyi Biotec). All frozen MCL cells had more than 85% purity and were stored in liquid nitrogen for later analysis. Peripheral blood mononuclear cells were obtained by Ficoll gradient centrifugation (ICN Biomedicals) from 5 healthy donors, and B lymphocytes were purified using a CD19 magnetic bead system (> 90% purity) as normal control. B-cell purity of more than 90% homogeneity was confirmed by 3-color flow cytometry using markers CD19/CD3 and CD45.
MicroRNA microarray analysis
Total RNA was isolated using Trizol reagent (Invitrogen). miRNA profiling was performed as previously described.23 Briefly, miRNA array containing 515 human miRNAs was hybridized with [γ-32P]adenosine triphosphate–labeled small RNA probes. To ensure the accuracy of the hybridizations, each labeled RNA sample was hybridized with 3 separate arrays and quantified. In addition, 8 oligonucleotides with nonmatching any known miRNA were used as hybridization controls. Hybridization signals for each spot of the array and background values at 15 empty spots were measured. The signals that fail to exceed the average background value by more than 3 SDs will be excluded. The data were normalized, and unsupervised hierarchical clustering analysis with average linkage algorithms was performed with GeneCluster. The results were visualized with TreeView. Differentially expressed miRNAs were identified using the t test procedure within significance analysis of microarrays, a method developed at Stanford University Laboratories.27
Plasmids
Expression plasmids of hsa-miR-29a, hsa-miR-29b, and hsa-miR-29c were created by annealing self-complimentary oligonucleotides encompassing the sequence of mature miRNAs and cloned to the pcDNA 6.2-GW/EmGFP-miR vector (Block-IT; Invitrogen). pmiR-Report-CDK6-1 and pmiR-Report-CDK6-2 were created by cloning CDK6 3′-UTR 9129 to 9135 bp and 9880 to 9886 bp, which match seed sequence of miR-29, into downstream luciferase gene, respectively. Their mutants (eg, pmiR-Report-CDK6-1m and pmiR-Report-CDK6-2m) were obtained by mutation of the sequence matching seed sequence to indicated nucleotides (Figure 4A). The sequences used to create these plasmids were shown in supplemental Table 1 (available on the Blood website; see the Supplemental Materials link at the top of the online article).
Quantitative RT-PCR
miRNA quantitative reverse-transcribed polymerase chain reaction (RT-PCR) was performed according to the manufacturer's instructions (Applied Biosystem). PCR products also were analyzed by electrophoresis on a 12.5% polyacrylamide gel in 0.5× Tris–borate ethylenediaminetetraacetic acid and visualized by ethidium bromide staining. U6 was used as an internal control. Quantitative RT-PCR was performed for evaluation of CDK6 mRNA levels as previously described28 and glyceraldehyde-3-phosphate dehydrogenase severed as a loading control. The primers are shown in supplemental Table 2.
Knockdown of miR-29 family, Western blot, miRNA LNA in situ hybridization, immunohistochemistry, and luciferase report assay
The knockdown of miR-29 family members in MCL cells was achieved by transfection with antisense 2′-O-methyl oligoribonucleotides against miR-29a/b/c using Lipofectamine 2000. Transfection complexes were prepared according to the instructions of the reagent manufacturer and added directly to the cells at a final oligonucleotide concentration of 10nmol/L. After 48 hours of incubation, cells were assayed for CDK6 expression and cell survival.29 Western blot, miRNA locked nucleic acid (LNA) in situ hybridization, immunohistochemistry, and luciferase report were carried out as previously described.29
Statistical analysis
The relationship between the alterations of specific miRNA with patient survival was evaluated by Kaplan-Meier Survival Curve Analysis with the log-rank statistic; all the analyses were completed by the software SPSS 11.0, and a P value less than .05 was considered statistically significant. Comparison of prognostic value between miR-29c status and MIPI was done with Sigmaplot software (Version 7.101; Systat Software Inc).
Results
miRNA expression profile in MCL
The characteristics of the MCL patients enrolled in this study are shown in Table 1. The median follow-up time was 34.96 months. The average age of enrolled patients was 65 years, and most of these patients were male (95%). Eighty-five percent of tumors were advanced stage at the time of diagnosis. All of the patients have received chemotherapy. These features are consistent with previous studies.2,3
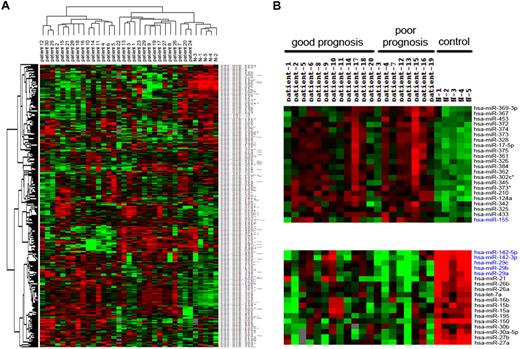
To identify miRNA expression signature in MCL, we performed miRNA microarray analysis in 30 patients with MCL and 5 normal healthy donors (eg, CD19+ lymphocytes as controls). RNAs isolated from MCL cells and normal lymphocytes were hybridized to a customized miRNA microarray platform, which contains 515 human miRNAs. The unsupervised hierarchical clustering revealed clearly distinctive expression patterns between MCL and normal lymphocytes (Figure 1A). Overall, expression of 39 miRNAs was changed at least 1.5-fold in MCLs (Table 2), 18 of which were down-regulated and the others were up-regulated. Most commonly changed miRNAs include decrease of miR-142-3p/5p, miR-29a/b/c, miR-150, and miR-15a/b as well as increase of miR-124a, miR-155, miR-328, miR-326, miR-302c, miR-345, miR-373*, and miR-210. The miRNAs that are dysregulated in more than 50% of MCLs include miR-150, miR-142-3p/5p, miR-29a/b/c, miR-124a, and miR-155.
Cluster analysis of MCLs and normal lymphocytes. (A) Tree was generated by the hierarchical cluster analysis showing the separation of normal lymphocytes from MCLs on the basis of all human miRNAs spotted on the chip. (B) A subset of miRNAs, labeled in blue, express differently between poor and good prognostic subgroups.
Cluster analysis of MCLs and normal lymphocytes. (A) Tree was generated by the hierarchical cluster analysis showing the separation of normal lymphocytes from MCLs on the basis of all human miRNAs spotted on the chip. (B) A subset of miRNAs, labeled in blue, express differently between poor and good prognostic subgroups.
We next asked whether the miRNA expression is associated with MCL prognosis. Of 30 MCL patients profiled, 24 had at least 36 months of follow-up, including the patients who died during this time period, 12 of whom survived more than 3 years (good prognosis), and the others with OS of 3 years or less (referred as poor prognosis; Figure 1B). By comparing the miRNA expression profiles, we found distinct expression of several miRNAs between these 2 subgroups, which include up-regulation of miR-155 and down-regulation of miR-142-3p/5p and miR-29 family in poor-prognosis patients (Figure 1B).
miRNA-29a/b/c expression levels are inversely associated with prognosis of MCL
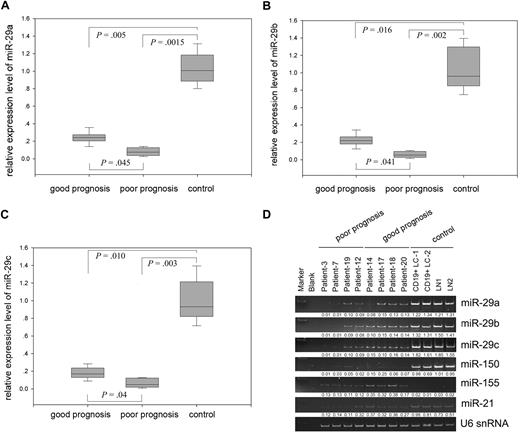
To verify the miRNA microarray data and determine the prognostic value of these miRNAs, we performed quantitative RT-PCR, using normal CD19+ peripheral blood lymphocytes and lymph nodes as controls, and found that expression of miR-29 family members but not other miRNAs is closely associated with MCL prognosis (Figure 2 and data not shown). Although miR-29a/b/c were down-regulated in both good- and poor-prognosis groups compared with normal lymphocytes, they were more significantly reduced in the patients with poor prognosis; for example, miR-29a/b/c levels are 2.0-fold less than those in the good-prognosis group. However, combining 3 members of miR-29 did not increase statistical significance between poor and good prognostic groups (Figure 2A-C; supplemental Figure 1).
Differential expression of miR-29 family between normal lymphocytes and good and poor prognostic MCLs. Quantitative RT-PCR analysis of miR-29a (A), miR-29b (B), and miR-29c (C) in MCLs and normal lymphocytes. Error bars represent SD. (D) Expression of miR-29 family members miR-150 and miR-155 in representative samples. CD19+ peripheral blood lymphocyte (CD19+ LC) and normal lymph node (LN) were used as controls.
Differential expression of miR-29 family between normal lymphocytes and good and poor prognostic MCLs. Quantitative RT-PCR analysis of miR-29a (A), miR-29b (B), and miR-29c (C) in MCLs and normal lymphocytes. Error bars represent SD. (D) Expression of miR-29 family members miR-150 and miR-155 in representative samples. CD19+ peripheral blood lymphocyte (CD19+ LC) and normal lymph node (LN) were used as controls.
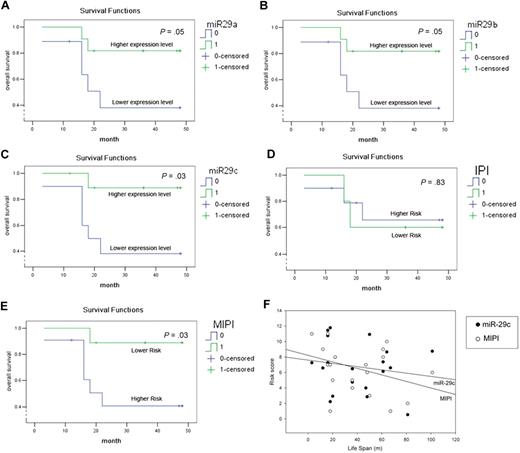
Using the mean relative expression level as a cutting value, we further analyzed the association between OS of MCL patients and miR-29 expression. A univariate Cox regression along with Kaplan-Meier estimate and log-rank tests revealed that MCL patients with relative higher levels of miR-29a, miR-29b, or miR-29c have much better OS than those whose tumors express lower levels of miR-29 (Figure 3A-C). Because miR-29a, miR-29b, and miR-29c are exclusively coderegulated in the MCL specimens examined, the combination of 3 members did not improve their prognostic value (supplemental Figure 1). Because IPI and MIPI have been used as predictors of MCL prognosis,30 we further analyzed their prognostic value in the MCL patients examined in this study and compared with that of miR-29. Consistent with a previous study, MIPI is a better predictor than IPI (Figure 3D-E).30 Notably, the prognostic value of miR-29a/b/c is better than IPI and equivalent to MIPI (Figure 3), suggesting that miR-29 could be a valuable prognostic marker in MCL.
miR-29 family can predict OS and is comparable with MIPI. The OS curves for miR-29a/b/c (A-C), IPI (D), and MIPI (E) were determined by Kaplan-Meier. Statistical differences between the curves were calculated using the log-rank test. (F) Prognostic value of miR-29c and MIPI is similarly determined by Sigmaplot.
miR-29 family can predict OS and is comparable with MIPI. The OS curves for miR-29a/b/c (A-C), IPI (D), and MIPI (E) were determined by Kaplan-Meier. Statistical differences between the curves were calculated using the log-rank test. (F) Prognostic value of miR-29c and MIPI is similarly determined by Sigmaplot.
CDK6 is a direct target of miR-29
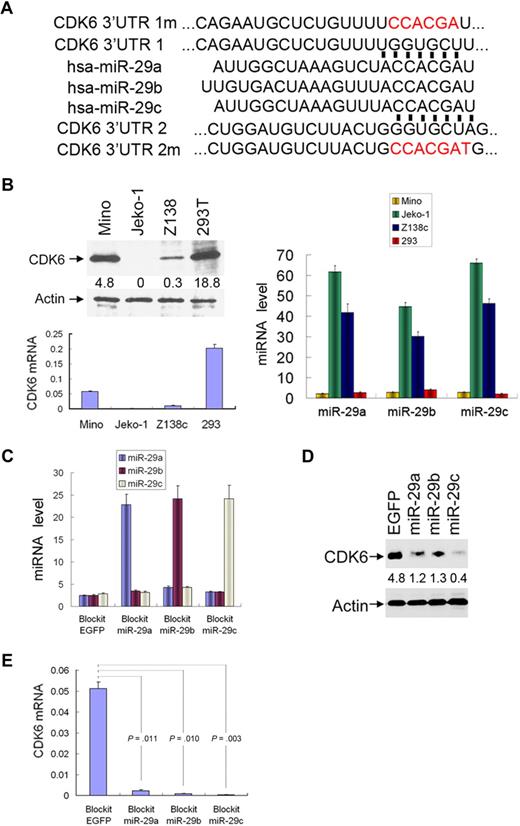
Because miR-29a/b/c are down-regulated in the majority of MCLs and the magnitude of their down-regulation is associated with OS, we thought that miR-29 could play an important role in the pathogenesis of MCL. By searching databases RNA22,31 DIANA,32 picTAR,33 and Targetscan,34 we found that 3′-UTR CDK6 contains 2 sequence motifs (9129-9135 bp and 9880-9886 bp) that perfectly match with the “seed” sequence of miR-29 (Figure 4A). Both motifs are well conserved among human, mouse, and rat (data not shown), suggesting a potential regulation of CDK6 by miR-29. To this end, we transfected Block-iT-miR-29a/b/c individually to Mino and HEK293T cells, which express low levels of miR-29 and high levels of CDK6 (Figure 4B). Cells transfected with Block-iT vector alone were used as control. After selection with blasticidin, expression of transfected miR-29a/b/c was verified by quantitative RT-PCR (Figure 4C). CDK6 protein and mRNA levels were assessed with immunoblotting and quantitative PCR. Ectopic expression of miR-29a, miR-29b, or miR-29c significantly reduced CDK6 expression in Mino (Figure 4D; supplemental Figure 2) and HEK293T (supplemental Figure 3) cells.
miR-29 family members target to CDK6. (A) Sequence alignment of the miR-29a/b/c seed sequences with 2 regions of the CDK6 3′-UTR. Mutants of pmiR-CDK6 3′-UTR 1m/2m are labeled in red. (B) Inverse correlation between expression of CDK6 (left panel) and miR-29a/b/c (right panel) in indicated cell lines. Ectopic expression of miR-29 (C) in Mino cells reduces CDK6 protein (D) and mRNA (E) levels. Each experiment was repeated 3 times. Error bars represent SD.
miR-29 family members target to CDK6. (A) Sequence alignment of the miR-29a/b/c seed sequences with 2 regions of the CDK6 3′-UTR. Mutants of pmiR-CDK6 3′-UTR 1m/2m are labeled in red. (B) Inverse correlation between expression of CDK6 (left panel) and miR-29a/b/c (right panel) in indicated cell lines. Ectopic expression of miR-29 (C) in Mino cells reduces CDK6 protein (D) and mRNA (E) levels. Each experiment was repeated 3 times. Error bars represent SD.
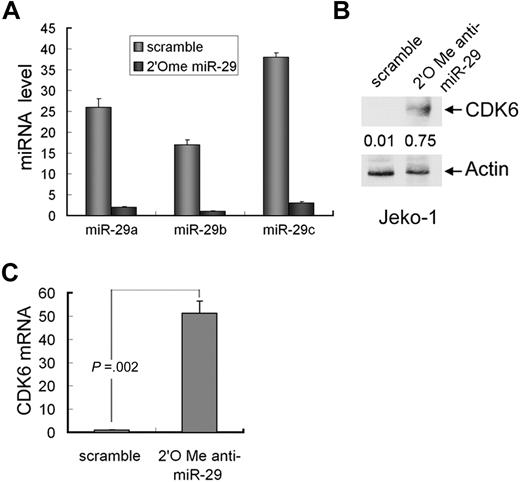
Because Jeko-1 cells express high levels of miR-29 and low levels of CDK6 (Figure 4B), we next tested whether knockdown of miR-29 will induce CDK6 expression in this cell line. The cells were transfected with pool 2′O-me anti-miR-29a/b/c and scramble oligonucleotides. Quantitative RT-PCR analysis revealed significant reduction of 3 members of miR-29 in the cells treated with anti-miR-29 (Figure 5A). Further, both mRNA and protein levels of CDK6 were increased in 2′O-me anti-miR-29–treated Jeko-1 cells compared with the cells transfected with scramble nucleotides (Figure 5B; supplemental Figure 4).
Knockdown of miR-29 induces CDK6 expression. (A) Quantitative RT-PCR analysis of expression of miR-29a/b/c in Jeko-1 cells that were treated with 2′O-me anti-pan-miR-29 or scramble oligonucleotides. CDK6 protein (B) and mRNA (C) levels were elevated in miR-29-knockdown cells. Error bars represent SD.
Knockdown of miR-29 induces CDK6 expression. (A) Quantitative RT-PCR analysis of expression of miR-29a/b/c in Jeko-1 cells that were treated with 2′O-me anti-pan-miR-29 or scramble oligonucleotides. CDK6 protein (B) and mRNA (C) levels were elevated in miR-29-knockdown cells. Error bars represent SD.
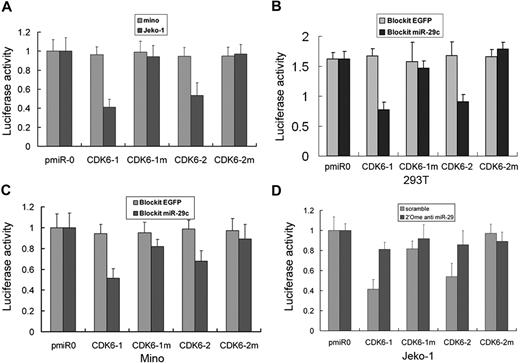
To further demonstrate miR-29 direct regulation of CDK6, we constructed luciferase reporters with 2 targeting sequences of wild-type (pmiR-CDK6-1-3′-UTR and pmiR-CDK6-2-3′-UTR) and mutated CDK6-3′-UTRs (Figure 4A). Both the wild-type and mutant reporters were introduced into Mino (miR-29-low) and Jeko-1 (miR-29-high) cells. The luciferase activities of pmiR-CDK6-1-3′-UTR and pmiR-CDK6-2-3′-UTR were significantly suppressed in miR-29-high Jeko-1 but not in miR-29-low Mino cells. However, pmiR-CDK6-3′-UTR mutant, for example, pmiR-CDK6-1m and pmiR-CDK6-2m, reporter activity had no difference between these 2 cell lines (Figure 6A). Further, wild-type but mutated pmiR-CDK6-1-3′-UTR and pmiR-CDK6-2-3′-UTR were inhibited by expression of miR-29a, miR-29b, or miR-29c in HEK293T (Figure 6B) and Mino (Figure 6C) cells. In addition, treatment of Jeko-1 cell with poo1 2′O-me anti-miR-29a/b/c oligonucleotides increased reporter activity of pmiR-CDK6-1-3′-UTR and pmiR-CDK6-2-3′-UTR (Figure 6D). Taken collectively, these data indicate that CDK6 is a direct target of miR-29 family.
miR-29 interacts with the CDK6 3′-UTR. (A) Luciferase activity of pmiR-CDK6-1-3′-UTR and pmiR-CDK6-2-3′-UTR, but not their mutants, is low in miR-29-high Jeko-1 and high in miR-29-low Mino cells. Ectopic expression of miR-29c in both HEK293T (B) and Mino (C) cells inhibits luciferase activity of pmiR-CDK6-1-3′-UTR and pmiR-CDK6-2-3′-UTR but not their mutants. Knockdown of miR-29 increases the luciferase activity in Jeko-1 cells (D). Each experiment was repeated 3 times. Error bars represent SD.
miR-29 interacts with the CDK6 3′-UTR. (A) Luciferase activity of pmiR-CDK6-1-3′-UTR and pmiR-CDK6-2-3′-UTR, but not their mutants, is low in miR-29-high Jeko-1 and high in miR-29-low Mino cells. Ectopic expression of miR-29c in both HEK293T (B) and Mino (C) cells inhibits luciferase activity of pmiR-CDK6-1-3′-UTR and pmiR-CDK6-2-3′-UTR but not their mutants. Knockdown of miR-29 increases the luciferase activity in Jeko-1 cells (D). Each experiment was repeated 3 times. Error bars represent SD.
Down-regulation of miR-29 results in frequent overexpression of CDK6 in MCL
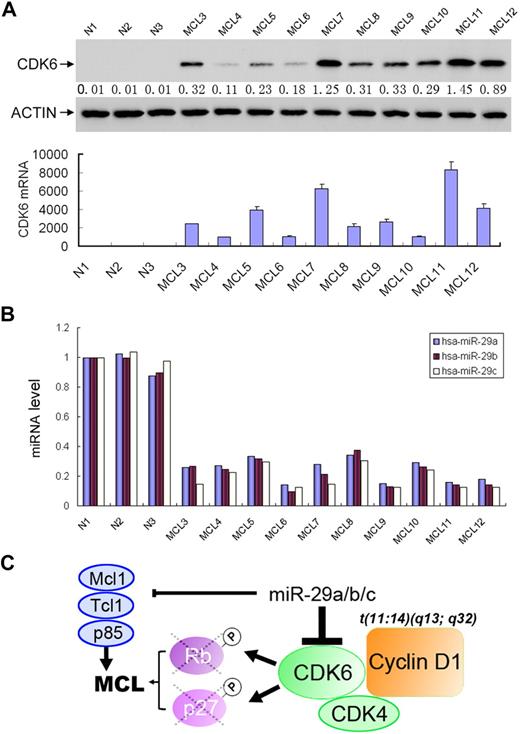
Having observed that miR-29a/b/c are frequently down-regulated in MCL and negatively regulate CDK6, we asked whether CDK6 is overexpressed in MCL and, if it is, whether CDK6 expression inversely correlates with miR-29 levels in this malignancy. A total of 30 MCL specimens and 3 normal lymphocyte samples were examined for the expression of CDK6. Western blot and miRNA semiquantitative PCR analyses revealed high levels of CDK6 in 27 of 30 MCL examined (Figure 7A and data not shown). Normal lymphocytes express undetectable levels of CDK6. Expression levels of CDK6 largely correlate with down-regulation of miR-29 (Figure 7B). In addition, miRNA LNA in situ hybridization and immunohistochemical staining showed inverse expression of miR-29 and CDK6 (supplemental Figure 5). These findings demonstrate miR-29 regulation of CDK6 in vivo and frequent overexpression of CDK6 in MCL.
CDK6 is frequently elevated in MCLs, which is inversely correlated with miR-29 expression. Representative MCL specimens express higher levels of CDK6 (A) but lower levels of miR-29 (B) than normal lymphocytes. (C) Schematic illustration of the miR-29 in pathogenesis of MCL.
CDK6 is frequently elevated in MCLs, which is inversely correlated with miR-29 expression. Representative MCL specimens express higher levels of CDK6 (A) but lower levels of miR-29 (B) than normal lymphocytes. (C) Schematic illustration of the miR-29 in pathogenesis of MCL.
Discussion
Although deregulation of individual miRNA has been reported in MCL,35-37 an miRNA expression profile has not been documented in this malignancy. In this study, we have identified miRNA expression signature by hybridizing miRNA array with RNAs from 30 patients with MCL. A total of 39 miRNAs were deregulated in at least 50% of the MCL specimens examined, which include down-regulation of 18 miRNAs and up-regulation of 21 miRNAs in MCL. Five miRNAs (eg, miR-150, miR-142-3p/5p, miR-29a/b/c, miR-124a, and miR-155) were altered in more than 50% of MCLs examined. Further, down-regulation of the miR-29 family is closely associated with poor OS and CDK6 overexpression. These findings are important for several reasons. First, they provide a comprehensive expression signature of miRNA in MCL. Second, miR-29 could serve as a predictor of MCL outcome. Finally, down-regulation of miR-29 leads to frequent overexpression of CDK6, which cooperates with cyclin D1 in the development of MCL.
The role of miRNA in MCL was first revealed by identification of miR-16-1 regulation of cyclin D1. Through searching postulated miRNAs that can bind to cyclin D1 mRNA using bioinformatics databases, Chen et al found that miR-16-1 targets a region of 3′-UTR cyclin D1, where it is truncated in a subset of MCLs resulting in overexpression of cyclin D1 via escaping regulation by miR-16-1.36 Further, high-resolution single nucleotide polymorphism genomic array demonstrated frequent loss of miR-16-1/miR-15a and gain of miR-17-92 in MCL.38 Consistent with these findings, our miRNA microarray analysis shows that miR-15a/-16-1 is frequently down-regulated whereas miR-17-92 (ie, miR-17-5p) is up-regulated in MCLs (Table 2). However, among the 5 most commonly altered miRNAs (miR-150, miR-142-3p/5p, miR-29a/b/c, miR-124a, and miR-155), only miR-124a locus was found to be amplified in the genomic array analysis, suggesting that deregulation of other miRNAs could occur at transcriptional or/and posttranscriptional levels.
The clinical course of MCL is highly variable. Some patients survive less than 6 months, whereas others live more than 10 years. Thus, it is important to develop molecular tests for newly diagnosed patients with MCL that reliably predict their clinical course. IPI and the Follicular Lymphoma International Prognostic Index, which are developed for diffuse large cell and follicular lymphoma patients, have previously been used for MCL prognosis. Recently, Hoster et al reported the MIPI score as a better prognostic indicator of MCL, particularly for patients with advanced-stage disease.30 In addition, the relationship between MCL prognosis and the gene-expression profiles has been explored using genome-scale expression profiles assessed by cDNA microarrays39 and quantitative RT-PCR analysis of the expression of 39 genes with potential prognostic and pathogenetic impact in MCL.39 In this study, we have shown that, although miR-29 is down-regulated in nearly all MCLs, expression levels of miR-29 are inversely correlated with OS of MCLs. Its prognostic value is comparable with MIPI. In accordance with our findings, miR-29 family has recently been shown as a prognostic marker in B-cell chronic lymphocytic leukemia (CLL).40
Overexpression of cyclin D1 is present in nearly all cases of MCL, which is thought to be a primary event by facilitating G1-S cell-cycle progression. This action requires cyclin D1 binding to CDK4 and CDK6, which phosphorylate and inactivate RB1, leading to the release of E2F transcription factors and the subsequent progression of the cell into S phase. Although miR-29 did not regulate cyclin D1 and CDK4 (data not shown), we demonstrated that CDK6 is a direct target of miR29 and that down-regulation of miR-29a/b/c results in up-regulation of CDK6 in MCL. The elevated CDK6 cooperates with cyclin D1 to further promote cell- cycle progression. In addition, miR-29 has been shown to negatively regulate several other important genes, including oncogenes Tcl-141 and Mcl-1,42 and cell growth and survival genes, YY1,43 p85α, CDC42,44 and DNMT3,45 as well as natural killer and T-cell inhibitor B7-H3.46 We have also shown that ectopic expression of miR-29c significantly reduces Mino cell growth, whereas knockdown of miR-29 family enhances Jeko-1 cell proliferation (supplemental Figure 6). miR-29 was also frequently down-regulated in CLL40 as well as in other solid tumors.43,45 Expression of miR-29 represses the tumor cell growth.43,45 Therefore, we concluded that miR-29 family is a tumor suppressor miRNA and that down-regulation of miR-29 could play a pivotal role in pathogenesis of MCL (Figure 7C), CLL, and other malignancies by negative regulation of its targets, including CDK6. The biologic effects of miR-29 on different organs could be further addressed by the creation of knockout mice.
In conclusion, we have identified miRNA expression signature and frequent deregulation of a set of miRNAs (eg, miR-150, miR-142-3p/5p, miR-29a/b/c, miR-124a, and miR-155) in MCL. Particularly, down-regulation of miR-29 could be a potential molecular marker to discriminate MCLs into good and poor prognostic subgroups. Further, miR-29− regulation of CDK6 leads to frequent up-regulation of CDK6 in MCL. Thus, miR-29 is also a critical therapeutic target for MCL intervention. Future investigation is required for establishing miR-29 as a clinical prognostic marker by evaluation of a large series of MCL patients. In addition, the role of miR-29 in MCL cell survival, growth, and chemoresistance as well as lymphomagenesis needs to be further evaluated both in cell culture and animal models.
The online version of this article contains a data supplement.
The publication costs of this article were defrayed in part by page charge payment. Therefore, and solely to indicate this fact, this article is hereby marked “advertisement” in accordance with 18 USC section 1734.
Acknowledgments
The authors thank the Tissue Procurement, DNA Sequence and flow cytometry Core Facilities at H. Lee Moffitt Cancer Center for providing cancer specimens, sequencing, and cell-cycle analysis.
This work was supported by the National Institutes of Health (CA137041 and CA107078), the Department of Defense (W81XWH-08-1-0444, W81XWH-08-2-0101, and W81XWH-08-1-0116), Bankhead-Coley (grant 09BB-05) (J.Q.C.), Leukemia Research Foundation (J.T.), and Lymphoma Research Foundation (S.D.).
National Institutes of Health
Authorship
Contribution: J.-J.Z., J.L., T.L., H.Y., W.K., and J.G. performed experiments; S.D., L.C.M., D.R., W.S.D., E.S., and J.T. provided clinical samples and information; J.T. and J.Q.C. initiated the study; and J.-J.Z. and J.Q.C. designed experiments, interpreted data, and wrote the manuscript.
Conflict-of-interest disclosure: The authors declare no competing financial interests.
Correspondence: Jianguo Tao or Jin Q. Cheng, H. Lee Moffitt Cancer Center and Research Institute, 12902 Magnolia Dr, Tampa, FL 33612; e-mail: jianguo.tao@moffitt.org or jin.cheng@moffitt.org.
References
Author notes
J.-J.Z. and J.L. contributed equally to this study.

