Abstract
Type I mucopolysaccharidosis (MPS I) is a lysosomal storage disorder caused by the deficiency of α-L-iduronidase, which results in glycosaminoglycan accumulation in tissues. Clinical manifestations include skeletal dysplasia, joint stiffness, visual and auditory defects, cardiac insufficiency, hepatosplenomegaly, and mental retardation (the last being present exclusively in the severe Hurler variant). The available treatments, enzyme-replacement therapy and hematopoietic stem cell (HSC) transplantation, can ameliorate most disease manifestations, but their outcome on skeletal and brain disease could be further improved. We demonstrate here that HSC gene therapy, based on lentiviral vectors, completely corrects disease manifestations in the mouse model. Of note, the therapeutic benefit provided by gene therapy on critical MPS I manifestations, such as neurologic and skeletal disease, greatly exceeds that exerted by HSC transplantation, the standard of care treatment for Hurler patients. Interestingly, therapeutic efficacy of HSC gene therapy is strictly dependent on the achievement of supranormal enzyme activity in the hematopoietic system of transplanted mice, which allows enzyme delivery to the brain and skeleton for disease correction. Overall, our data provide evidence of an efficacious treatment for MPS I Hurler patients, warranting future development toward clinical testing.
Introduction
Type I mucopolysaccharidosis (MPS I) is one of the most frequent lysosomal storage disorders (LSDs) and is due to the inherited deficiency of α-L-iduronidase (IDUA) activity, which results in the accumulation of its unprocessed substrates (glycosaminoglycans; GAGs) in many organs.1 The disorder is systemic and clinically heterogeneous. Clinical manifestations include skeletal dysplasia, joint stiffness, visual and auditory defects, cardiac insufficiency, hepatosplenomegaly, and mental retardation. The clinical spectrum ranges from the severe Hurler syndrome (MPS I-H) to the attenuated Scheie syndrome. Mental retardation is distinctive only of MPS I-H, which is fatal in childhood if untreated, thus representing the variant with the most urgent need for new therapies. Enzyme replacement therapy (ie, parenteral administration of exogenous enzyme that can be internalized by tissue cells via the mannosium-6-phosphate receptor) is recommended only for MPS I patients without primary neurologic disease, due to the inability of the enzyme to efficiently cross the blood-brain barrier; moreover, neutralizing antibodies can attenuate its efficacy.2 When performed at early ages, hematopoietic stem cell (HSC) transplantation (HCT) from healthy donors alleviates most disease manifestations in MPS I-H patients, likely by migration of the transplant-derived leukocytes into organs, where they can clear the storage and secrete the functional enzyme for correction of the metabolic defect in resident cells.3 However, despite recent improvements in the outcome of HCT, the morbidity and mortality associated with the procedure are still not negligible, mostly due to rejection and graft-versus-host disease. Moreover, the amount of enzyme that transplantation can provide to the organism can be limiting, especially since donors are often heterozygous siblings. Indeed, a relationship between circulating enzyme levels after transplant and urinary GAGs has been shown4 : the low enzyme levels achieved with heterozygote donor transplant lead to less adequate reduction in GAG levels. Likely due to partial metabolic correction at disease sites, the impact of HCT on central nervous system (CNS) and skeletal disease, despite being substantial in ameliorating patients' phenotype, could still benefit from further improvement.5
The benefits of different gene therapy approaches were established in MPS I animal models. Intravenous delivery of viral vectors, which can establish a tissue source for systemic enzyme distribution, was effective in controlling disease manifestations in MPS I animal models upon neonatal treatment.6-9 However, residual disease still affected the nervous and skeletal tissues and the aorta of mice treated with this approach in adulthood.10,11 This limited efficacy could be due to insufficient enzyme delivery via the bloodstream to tissues, such as the brain, protected by physiologic barriers or poorly vascularized, such as the skeleton, and/or to immune-mediated clearance of the liver-secreted enzyme.
HSC gene therapy has also been developed. When oncoretroviral vectors were used for gene transfer, HSC gene therapy proved to be effective in restoring enzyme activity and providing therapeutic effects on visceral organs of MPS I mice. However, the CNS disease was not adequately corrected.12 Others and we have demonstrated that lentiviral vectors (LVs) constitute a valuable alternative to oncoretroviral vectors, enabling more efficient marking of murine and human hematopoietic stem and progenitor cells (HSPCs) and robust, long-term transgene expression in their progeny.13-19 LVs were used to transduce HSPCs and direct IDUA expression in an erythroid-specific manner by the use of a lineage-specific promoter in the MPS I mouse model.20 This approach generated an intravascular enzyme source, namely, gene-modified erythrocytes, which could efficiently release the enzyme in the plasma for distribution to the affected tissues. Interestingly, the treatment reproduced the efficacy of in vivo gene therapy approaches and of HCT, but did not provide an increased benefit in correcting neurologic disease manifestations. Conversely, we previously showed that transplantation of HSPC transduced with ubiquitously expressing LVs prevents and corrects neurologic disease manifestations in mice affected by another LSD (metachromatic leukodystrophy),18,21 for which HSC gene therapy has now entered clinical testing. The efficacy of the approach was shown to be dependent on the CNS infiltration of myeloid cells producing supranormal enzyme quantities and conveying the protein through the blood-brain barrier.18 According to these results, we hypothesized that LV-driven, supranormal IDUA reconstitution above wild-type (WT) levels in HSPCs and their differentiated progeny could improve the outcome of the previously tested approaches in correcting the neurologic (and skeletal) disease in MPS I. We thus addressed in this study this hypothesis and challenged MPS I disease in mice with the transplantation of WT and LV-transduced Idua−/− HSPCs, in which enzymatic activity was restored to supranormal levels.
Methods
Mouse studies
Idua−/− mice (C57BL/6 background)22 were imported in our animal facility as a kind gift of Prof J. M. Heard and intercrossed to obtain an inbred strain. Rag2−/− γ-chain−/− mice23 were obtained from the Central Institute for Experimental Animals. All procedures were approved by the Animal Care and Use Committee of the Fondazione San Raffaele del Monte Tabor (Institutional Animal Care and Use Committee 325) and communicated to the Ministry of Health and local authorities according to Italian law.
Transduction and transplantation of hematopoietic progenitors
Eight-week-old WT or MPS I mice were killed with CO2, and the bone marrow (BM) was harvested by flushing femurs and tibiae. HSPCs were purified for lineage− selection using the Enrichment of Murine Hematopoietic Progenitors kit (StemCell Technologies) and transduced at multiplicity of infection 100 with IDUA- or green fluorescent protein (GFP)–encoding LV (IDUA-LV, GFP-LV).21 Transduced cells (106 cells/mouse) were injected in the tail vein of 8-week-old WT or MPS I mice after lethal irradiation (12 Gy). Transduced cells were also cultured for 14 days for IDUA activity measurement (liquid culture21 ) and for polymerase chain reaction quantitative analysis for the LV sequences (clonogenic assays).18
Behavioral studies
Spontaneous locomotor activity was recorded in 41 × 41 × 33 (height) cm Perspex activity cages (Ugo Basile), equipped with infrared light photocell beams. The lower arrays of aligned infrared emitters and detectors measured the number of transitions (horizontal activity), while vertical arrays measured rearing. Mice were placed individually in the activity cages, and their activity was recorded in a low luminosity environment in a daily session of 10 minutes for 3 consecutive days. The percentage change between the first and third trial was used as an outcome measure.
ABR
Needle scalp electrodes were used to record sound-evoked bioelectrical potentials for evaluation of the central and peripheral auditory function and to identify hearing deficits related to the auditory pathway from the cochlea to the auditory midbrain.24 Five positive peaks in the auditory brainstem response (ABR) waves were expected. In the mouse, peak I refers to cochlear processing, peak II to processing in the cochlear nucleus complex, peak III in the complex of the superior olive, peak IV in the lateral lemniscus, and peak V in the colliculus inferior.
ABR to pure tones were recorded in anesthetized animals. We recorded the latency of peaks I, III, IV, and V and the latency between peaks I-III, III-V, and I-V. We calculated the average and standard deviation (SD) of the latency of each peak in WT mice. In each mouse and for each peak, a score based on the difference between the latency recorded and the respective average in WT animals ± SD was then calculated. Abnormalities in the latencies were graded in a 3-degree ordinal scale (0 = normal finding, ie, individual peak latency not exceeding control mean peak latency ± 1 SD; 1 = slight increase, with latency ranging between 1 and 2 SDs; 2 = increase, with latency between 2 and 3 SDs; 3 = great increase with latency greater than 3 SDs, or ABR absence). This allowed us not to drop out mice without ABR responses and to properly evaluate ABR absence as the highest degree of functional impairment due to pathology.
CT
Computerized tomography (CT) scans were performed on a human-grade 64-channel multislice apparatus (Light Speed VCT; GE Healthcare). The imaging protocol included a biplanar scout and a helical volumetric CT acquisition with coverage of the whole body, with a tube speed rotation of 0.5 seconds (s), 0.625-mm slice thickness and 0.3-mm/s table motion, 120 kV, 680 mA, reconstruction field of view of 17 cm, and matrix of 512 × 512. CT images were filtered with both the standard parenchyma and high-resolution bone algorithms.
Skull width was measured on axial reformatted images, considering the largest diameter, femur length was determined by measuring its long axis in between the 2 epiphysis, and humerus width was measured in the middle of the diaphysis. The analysis was performed using OsiriX Version 3.5.1 software.
On a dedicated workstation (Advantage 4.4; GE Healthcare), both the zygomatic regions were manually isolated, an automatic segmentation with bone threshold > 160 UH was applied to the regions of interest, and corresponding volumes were measured through a manufacturer's software.
Animal sacrifice modalities
At sacrifice, mice were transcardially perfused with saline for 15 minutes upon administration of 0.02 mL/g body weight tribromoethanole (Avertine; Sigma-Aldrich). Thereafter, organs were collected as described in supplemental Methods (available on the Blood Web site; see the Supplemental Materials link at the top of the online article).
IDUA activity assay
Enzyme activity was measured fluorometrically as previously described.12 See supplemental Methods for details.
Analysis of glycosaminoglycans in tissues and urine
GAGs were quantified as described.25-27 See supplemental Methods for details.
Histopathology
Semithin sections were conducted as previously described.18 Sections (0.5-1 μm thick) were stained with toluidine blue and examined by light microscopy. For quantification of vacuoles aggregates, digitalized images of sections from all tissues, at the same level, were obtained with a digital camera (Leica DFC300F) at ×100 magnification. At least 3 images from 4 different animals per group were acquired with QWin software (Leica Microsystems). An arbitrary score (from 0 to 4) was given by the investigators (2 blinded and experienced pathologists: A.Q. and F.C.) on the basis of the percentage of vacuoles observed in each ×100 field.
Quantitative PCR analysis
Peripheral quantitative CT
Peripheral quantitative CT (pQCT) measurements were performed ex vivo on fixed tibiae and femurs. The strength strain index (SSI) was calculated by the manufacturer's software as follows: SSI = Σi = 1,n r2 · aCD/ND · rmax, where r is the distance of a voxel from the center of gravity, rmax is the maximum distance of a voxel from center of gravity, a is the area of a voxel, CD is the cortical density, and ND is the density of normal cortical bone tissue equal to 1200 mg/cm3, as measured by pQCT when no spaces were included. To account for changes in the mineralization of bone and therefore for changes in material properties, the section modulus was normalized for this value in the pQCT software (XCT 550, Version 6.00B). See supplemental Methods for details.
Statistical analysis
Statistical analyses were made by either Student t test or 1-way analysis of variance (ANOVA) for repeated measurements using the Bonferroni test for post hoc analysis after significant main effect of the treatment (confidence interval, 95%).
Results
Gene therapy, and not HCT, allows efficient delivery of the functional enzyme to all MPS I–affected tissues
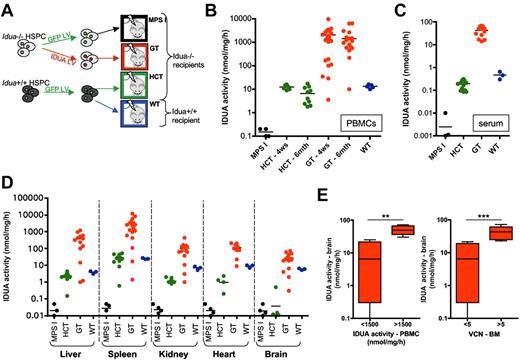
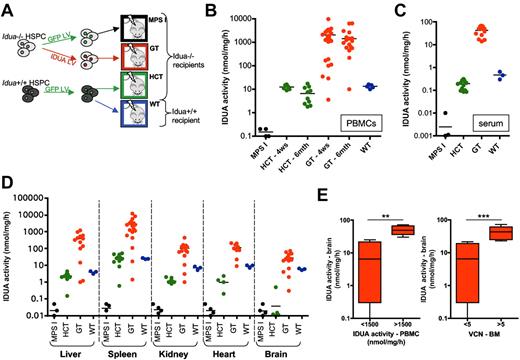
We transduced lineage− HSPC isolated from the BM of Idua−/− and Idua+/+ mice with IDUA-LV or GFP-LV as previously described.18 Idua−/− IDUA-LV–transduced cells showed an average vector copy number per genome (VCN) of 11 ± 3 (tested on clonogenic progenitors) and overexpressed the enzyme (whose expression was driven by the human phosphoglycerate kinase promoter) at up to 200-fold the levels detected in mock-transduced Idua+/+ HSPCs after 14 days of in vitro liquid culture (data not shown). The transduced cells were transplanted into 2-month-old lethally irradiated MPS I and WT littermates according to the procedure shown in Figure 1A. Interestingly, while transplantation of WT GFP-LV–transduced cells reconstituted a normal IDUA activity in the peripheral blood mononuclear cells (PBMCs), supranormal enzyme expression (up to 150-fold the low WT levels) was measured in the PBMCs of gene therapy–treated (GT) mice short- and long-term after the transplant (Figure 1B). Supranormal enzymatic activity was also measured 6 months after the transplant in the serum (Figure 1C) and in all the tested tissues of GT mice, including the brain, where activity levels up to 4.5-fold the WT were detected (Figure 1D). Of note, transplantation of GFP-transduced WT HSPCs (HCT), despite being capable of reconstituting a normal enzymatic activity in the spleen of the MPS I mice, reconstituted only below-normal enzyme activity in the liver, kidney, and heart, and failed to deliver detectable amounts of the functional enzyme to the brain (Figure 1D).
Reconstitution of IDUA activity in MPS I mice upon transplantation of wild-type or gene-corrected HSPCs. (A) Experimental scheme. Idua−/− and Idua+/+ cells were transduced with IDUA-LV or GFP-encoding LV (in which transgene expression was driven by the human phosphoglycerate kinase promoter) and then transplanted (1 × 10⁶ cells/mouse) into lethally irradiated mice, as indicated. GT, gene therapy–treated Idua−/− mice; HCT, Idua−/− mice transplanted with WT HSPC transduced with GFP-LV; MPS I, Idua−/− mice transplanted with GFP-LV–transduced Idua−/− HSPCs (mock-transplanted affected controls); WT, Idua+/+ mice transplanted with GFP-LV–transduced Idua+/+ HSPCs (mock-transplanted WT controls). (B-D) IDUA activity was measured in the PBMCs (B), in the serum (C), and in the tissues indicated below the x-axis (D) of mice transplanted with either mock-transduced or gene-corrected HSPCs at 4 weeks (B) or 6 months after transplant at sacrifice (B-D). Each dot represents one mouse, and average values are shown (black line). (E) Gene therapy–treated mice were divided into 2 groups according to the IDUA activity measured in total PBMCs (at 6 months from transplantation; left chart) and to the vector copy number per genome (VCN) measured on total BM cells (right chart). IDUA activity measured in the brain is shown for animals having IDUA activity in PBMCs below (<) or above (>) 1500 nmol/mg/h and carrying less (<) or more (>) than 5 LV copies per genome in the BM (1500 nmol/mg/h and 5 LV copies/genome are the average values measured in the entire pool of gene therapy–treated mice). Mean ± min/max are shown. **P < .01; ***P < .001 with Student t test.
Reconstitution of IDUA activity in MPS I mice upon transplantation of wild-type or gene-corrected HSPCs. (A) Experimental scheme. Idua−/− and Idua+/+ cells were transduced with IDUA-LV or GFP-encoding LV (in which transgene expression was driven by the human phosphoglycerate kinase promoter) and then transplanted (1 × 10⁶ cells/mouse) into lethally irradiated mice, as indicated. GT, gene therapy–treated Idua−/− mice; HCT, Idua−/− mice transplanted with WT HSPC transduced with GFP-LV; MPS I, Idua−/− mice transplanted with GFP-LV–transduced Idua−/− HSPCs (mock-transplanted affected controls); WT, Idua+/+ mice transplanted with GFP-LV–transduced Idua+/+ HSPCs (mock-transplanted WT controls). (B-D) IDUA activity was measured in the PBMCs (B), in the serum (C), and in the tissues indicated below the x-axis (D) of mice transplanted with either mock-transduced or gene-corrected HSPCs at 4 weeks (B) or 6 months after transplant at sacrifice (B-D). Each dot represents one mouse, and average values are shown (black line). (E) Gene therapy–treated mice were divided into 2 groups according to the IDUA activity measured in total PBMCs (at 6 months from transplantation; left chart) and to the vector copy number per genome (VCN) measured on total BM cells (right chart). IDUA activity measured in the brain is shown for animals having IDUA activity in PBMCs below (<) or above (>) 1500 nmol/mg/h and carrying less (<) or more (>) than 5 LV copies per genome in the BM (1500 nmol/mg/h and 5 LV copies/genome are the average values measured in the entire pool of gene therapy–treated mice). Mean ± min/max are shown. **P < .01; ***P < .001 with Student t test.
The efficiency of enzyme delivery to the brain of GT mice significantly correlated with the level of enzymatic activity in PBMCs and with the VCN measured in the BM (supplemental Figure 1A-C). In particular, IDUA activity values in PBMCs above 1500 nmol/mg/h (average value of GT mice) and VCN higher than 5 in the BM (average VCN measured on the BM of the GT mice cohort) consistently allowed an efficient delivery of IDUA to the brain (up to ≥ 2-fold the levels of WT controls; Figure 1D-E).
Supranormal enzymatic activity allows metabolic correction in the affected tissues
To evaluate the extent of metabolic correction at diseased sites upon transplantation of either gene corrected or WT HSPC, we performed a semiquantitative assessment of the storage on tissue sections from treated and control animals. Cytoplasmic vacuoles, that represent distended lysosomes from which GAGs were leached by fixation, were scored. Storage was abundant in the kidney, liver (within hepatocytes and Kupffer cells), spleen (predominant in the red pulp), heart (abundant in the endothelium and myocytes), and brain (where storage occurs within endothelial cells and neurons) of MPS I mock-transplanted animals (Figure 2A-B). Variable reduction of storage was observed in HCT mice, with reduction being more evident in hematopoietic lineage cells, rather than in resident nonhematopoietic cell populations (see storage in hepatocytes in Figure 2A). Almost complete clearance of the storage was observed only in the spleen, where the highest enzyme activity was measured and where the hematopoietic lineage was the most affected (Figures 1D and 2B). Conversely, a significantly greater benefit was observed in GT mice, in which the storage material was almost undetectable in all examined tissues (Figure 2A-B). Storage was cleared from both hematopoietic and nonhematopoietic lineage cells, suggesting the occurrence of cross-correction of the resident populations.
Supranormal enzymatic activity allows storage removal in the MPS I–affected tissues. (A) Morphologic analysis of 1-μm sections, toluidine blue stained, from different organs of treated and control animals, as indicated. Representative images show the lysosomal distention in the indicated tissues in MPS I mice (no distention is present in WT animals). Kidney: arrows and arrowheads identify lysosomal storage, which is evident in the tubules (arrows), in the glomeruli (arrowheads; * marks the glomeruli), and in interstitial fibroblasts; liver: arrows highlight storage within hepatocytes, and storage is also present within Kupffer cells; spleen: pathologic storages (arrows) are predominant in the red pulp; heart: pathologic storage is abundant in the endothelium and in myocytes (arrows); frontal cortex: pathologic storage is present within neurons (arrows) and in endothelial cells (v = vessels); subjective score in MPS I: 3-4 in the different examined tissues. Magnification ×100 and ×200. Residual storage is present in all tissues of mice treated with HCTs. Two representative animals (HCT [a] and HCT [b], both having donor-cell engraftment > 70%, as assessed by quantification of donor GFP+ cells in peripheral blood by cytofluorimetric analysis) are shown, demonstrating a different grade of storage (subjective score HCT [a]: 1-2 and HCT [b]: 2-3 in the different examined tissues). Magnification ×100 and ×200. A strong reduction of storage is evident in all the examined tissues from a representative GT mouse having a VCN of 5 in the BM (subjective score: 0-1 in the different examined tissues). Magnification ×100. (B) Lysosomal distention/cell engulfment was scored (see “Methods” for details) in the liver, spleen, heart, kidney, and cortex of treated and control mice. Mean ± SEM are shown; n = 4 representative mice analyzed per group (≥ 3 representative images per mouse). *P < .05; **P < .01; ***P < .001 with 1-way ANOVA. (C-D) GAGs were quantified in the urine (C) and in the tissues (D, as indicated below x-axis; the liver, spleen, and kidney were chosen as representative tissues) of treated and control mice. Mean ± SEM are shown; n ≥ 4 representative mice analyzed per group. *P < .05; **P < .01; ***P < .001 with 1-way ANOVA. (E) Western blot for heparin cofactor II–thrombin (HCII-T) complex was performed on the serum of MPS I, GT, and WT mice. Glyceraldehyde 3-phosphate dehydrogenase (GAPDH; bottom image) was used as an internal control.
Supranormal enzymatic activity allows storage removal in the MPS I–affected tissues. (A) Morphologic analysis of 1-μm sections, toluidine blue stained, from different organs of treated and control animals, as indicated. Representative images show the lysosomal distention in the indicated tissues in MPS I mice (no distention is present in WT animals). Kidney: arrows and arrowheads identify lysosomal storage, which is evident in the tubules (arrows), in the glomeruli (arrowheads; * marks the glomeruli), and in interstitial fibroblasts; liver: arrows highlight storage within hepatocytes, and storage is also present within Kupffer cells; spleen: pathologic storages (arrows) are predominant in the red pulp; heart: pathologic storage is abundant in the endothelium and in myocytes (arrows); frontal cortex: pathologic storage is present within neurons (arrows) and in endothelial cells (v = vessels); subjective score in MPS I: 3-4 in the different examined tissues. Magnification ×100 and ×200. Residual storage is present in all tissues of mice treated with HCTs. Two representative animals (HCT [a] and HCT [b], both having donor-cell engraftment > 70%, as assessed by quantification of donor GFP+ cells in peripheral blood by cytofluorimetric analysis) are shown, demonstrating a different grade of storage (subjective score HCT [a]: 1-2 and HCT [b]: 2-3 in the different examined tissues). Magnification ×100 and ×200. A strong reduction of storage is evident in all the examined tissues from a representative GT mouse having a VCN of 5 in the BM (subjective score: 0-1 in the different examined tissues). Magnification ×100. (B) Lysosomal distention/cell engulfment was scored (see “Methods” for details) in the liver, spleen, heart, kidney, and cortex of treated and control mice. Mean ± SEM are shown; n = 4 representative mice analyzed per group (≥ 3 representative images per mouse). *P < .05; **P < .01; ***P < .001 with 1-way ANOVA. (C-D) GAGs were quantified in the urine (C) and in the tissues (D, as indicated below x-axis; the liver, spleen, and kidney were chosen as representative tissues) of treated and control mice. Mean ± SEM are shown; n ≥ 4 representative mice analyzed per group. *P < .05; **P < .01; ***P < .001 with 1-way ANOVA. (E) Western blot for heparin cofactor II–thrombin (HCII-T) complex was performed on the serum of MPS I, GT, and WT mice. Glyceraldehyde 3-phosphate dehydrogenase (GAPDH; bottom image) was used as an internal control.
GAGs were also quantified in the urine and in the diseased tissues of mock-transplanted and treated mice (Figure 2C-D). Normalization of urinary (Figure 2C) and tissue GAGs (Figure 2D) was observed in GT mice, demonstrating a complete correction of the metabolic defect, both systemically and at relevant diseased sites; transplantation of WT HSPCs resulted in complete storage removal from the spleen, but only in partial clearance of GAGs from the other tissues (liver and kidney are shown as representative; Figure 2D).
The elevation of heparin cofactor II–thrombin (HCII-T) complex is a biomarker for MPS I that appears to correlate with disease severity and is responsive to treatment.28,29 HCII-T presence was tested on the serum of treated and control animals by Western blot analysis. Reduction of HCII-T complex down to WT levels was observed in the serum of GT mice (Figure 2E), further confirming that metabolic correction was attained.
Differential neurologic outcome of gene therapy and HCT
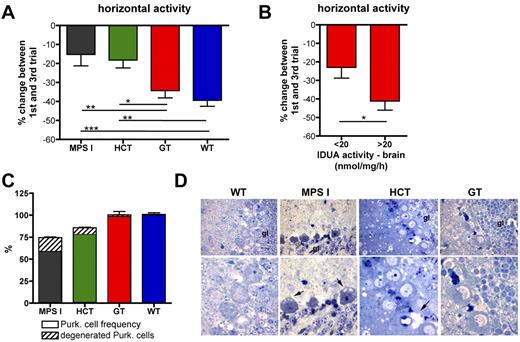
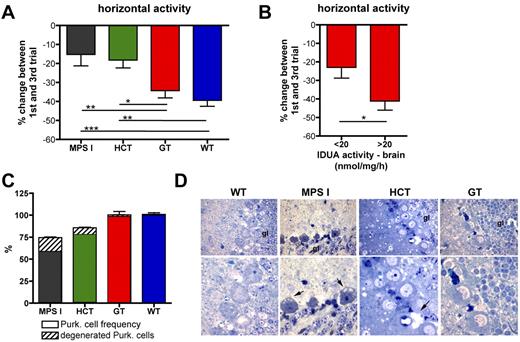
Six months after the treatment, treated and control mice underwent behavioral studies. To study adaptive behavior and identify memory deficits, a repeated open-field test was performed, exposing the mice to the same open field for 3 repeated trials conducted in 3 sequential days. Horizontal and rearing activities were scored, and the percentage of change between performance at first and at third trials was used as an outcome measure. Although the defective adaptive behavior of MPS I mice at horizontal activity testing was not ameliorated in HCT mice, which had barely detectable IDUA activity in the brain, it was normalized in GT mice, which showed up to 4.5-fold the WT enzyme activity in the CNS (Figures 1D and 3A). Interestingly, the extent of correction of the behavioral phenotype well correlated with the VCN measured in the BM and with the IDUA activity measured in the brain of the treated mice (supplemental Figure 1D-E). A threshold value for IDUA activity in the brain, allowing for efficacious correction of the neurologic phenotype in GT mice, could be established at 20 nmol/mg/h, which corresponds to the mean brain activity value of the entire cohort (Figure 3B). Similar results were observed when measuring rearing activity (data not shown).
Differential neurologic outcome of gene therapy and HCT. (A) Repeated open-field test was performed on treated and control mice 6 months after the transplantation. Horizontal activity of MPS I (n = 20), HCT (n = 18), GT (n = 17), and WT (n = 14) mice is reported as a percentage (%) of change between the 1st and the 3rd days. (B) GT mice were divided into 2 groups according to the IDUA activity measured on their brain. The percentage change in horizontal activity between the first and third trials is shown for animals having brain IDUA activity lower (<, n = 8) or higher (>, n = 9) than 20 nmol/mg/h (20 nmol/mg/h is the average activity value measured on the brain of the entire population of GT mice). Mean ± SD are shown; *P < .05; **P < .01; ***P < .001 with 1-way ANOVA in panel A and Student t test in panel B. (C) Purkinje cell frequency (expressed as percentage of the cells counted in WT mice; dense area) and percentage of degenerated Purkinje cells among the total cells (scattered area) in cerebellum slices from affected, WT-, HCT-, and GT-treated mice are shown (see “Methods” for details). Mean ± SD values are shown; n ≥ 4 representative mice analyzed per group (≥ 3 representative sections per mouse). (D) Representative semithin section images from the Purkinje cell layer of treated and control mice, as indicated. The pictures show degenerating Purkinje cells, which, besides accumulating GAGs, display shrunken cell bodies and darkly stained nuclei (arrows, “gl” marks granular layer), in mock-transplanted MPS I mice; in HCT mice, residual storage and Purkinje cell degeneration were seen, whereas in the GT-treated mice we observed a complete rescue of the pathologic phenotype. Magnification ×100 in the images from the top row, ×200 in the bottom row.
Differential neurologic outcome of gene therapy and HCT. (A) Repeated open-field test was performed on treated and control mice 6 months after the transplantation. Horizontal activity of MPS I (n = 20), HCT (n = 18), GT (n = 17), and WT (n = 14) mice is reported as a percentage (%) of change between the 1st and the 3rd days. (B) GT mice were divided into 2 groups according to the IDUA activity measured on their brain. The percentage change in horizontal activity between the first and third trials is shown for animals having brain IDUA activity lower (<, n = 8) or higher (>, n = 9) than 20 nmol/mg/h (20 nmol/mg/h is the average activity value measured on the brain of the entire population of GT mice). Mean ± SD are shown; *P < .05; **P < .01; ***P < .001 with 1-way ANOVA in panel A and Student t test in panel B. (C) Purkinje cell frequency (expressed as percentage of the cells counted in WT mice; dense area) and percentage of degenerated Purkinje cells among the total cells (scattered area) in cerebellum slices from affected, WT-, HCT-, and GT-treated mice are shown (see “Methods” for details). Mean ± SD values are shown; n ≥ 4 representative mice analyzed per group (≥ 3 representative sections per mouse). (D) Representative semithin section images from the Purkinje cell layer of treated and control mice, as indicated. The pictures show degenerating Purkinje cells, which, besides accumulating GAGs, display shrunken cell bodies and darkly stained nuclei (arrows, “gl” marks granular layer), in mock-transplanted MPS I mice; in HCT mice, residual storage and Purkinje cell degeneration were seen, whereas in the GT-treated mice we observed a complete rescue of the pathologic phenotype. Magnification ×100 in the images from the top row, ×200 in the bottom row.
To further assess the efficacy of gene therapy in correcting MPS I–associated damage in the nervous system, we examined the Purkinje cell layer of the cerebellum of treated and control animals: we quantified the integrity of the layer (ie, number of Purkinje cells within all the circumvolutions of each section) and evaluated the degeneration of the cells present in the layer (Figure 3C-D). Interestingly, the reduced density of Purkinje cells observed in mock-transplanted MPS I mice was normalized to WT density by gene therapy (Figure 3C). Moreover, the degeneration of the Purkinje cells was greatly reduced in GT animals, compared with mock-transplanted affected controls (Figure 3C-D). HCT exerted only a partial benefit on the Purkinje cells (Figure 3C-D).
Differential skeletal outcome of gene therapy and HCT
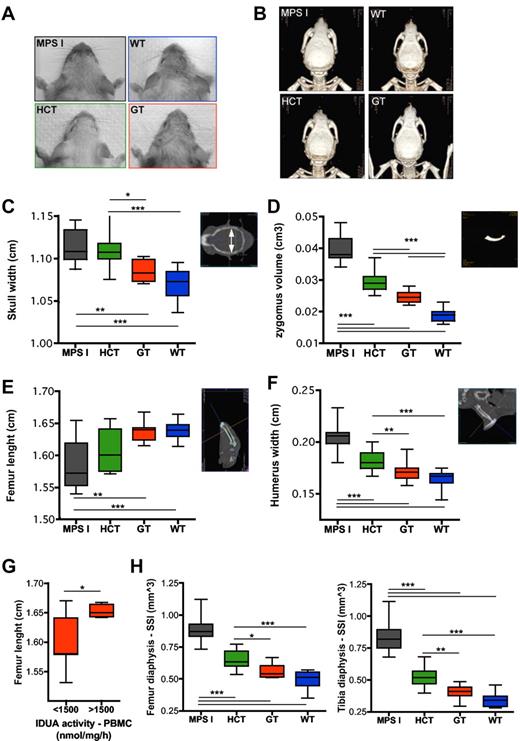
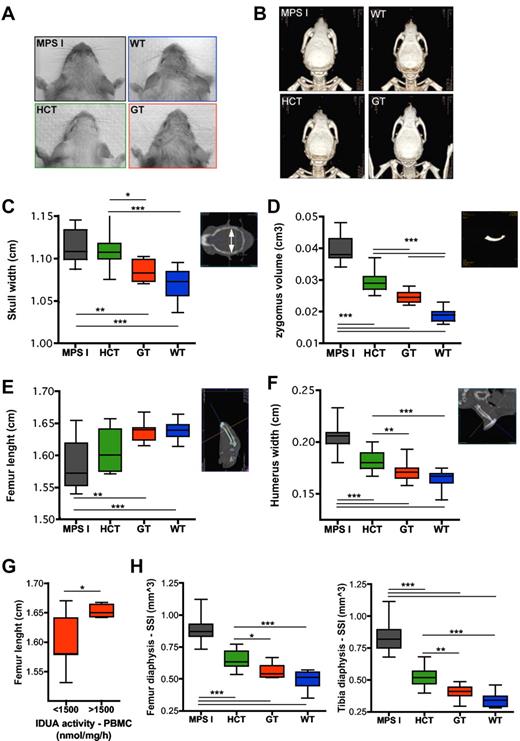
Treated and control mice underwent total body CT scans to characterize their skeleton. The width of the skull and of the humerus and femur, as well as the length of the femur, were measured on CT scans. Moreover, the volume of the zygomatic bones was measured on 3-dimensional reconstructions. Interestingly, direct inspection (Figure 4A), CT imaging (Figure 4B), and bone measurements on CT scans (Figure 4C-F) demonstrated an almost complete normalization of all analyzed parameters in GT mice, compared with mock-transplanted affected siblings, whereas HCT provided a partial benefit on skeletal abnormalities. The extent of correction of the skeletal phenotype was greater in the presence of higher IDUA expression in PBMCs of GT mice, as shown for the femur length, which is representative of the other tested parameters (Figure 4G). Similar results were obtained by the assessment of the densitometric and geometrical parameters of the appendicular long bones (ie, femur and tibia) at pQCT. The bone phenotype of the affected mice was characterized by increased size and density at comparison with WT animals (data not shown). The polar SSI of the femur and tibia was analyzed as a representative parameter accounting for the resistance of the long bones toward torsion (obtained from pQCT cross-sectional scanning), based on bone density and size. The SSI of GT mice was significantly lower than that of mock-transplanted affected littermates and not distinguishable from the SSI of WT animals (Figure 4H). Moreover, the SSI of GT mice was also significantly lower than that of HCT mice, confirming the poor efficacy of the latter procedure in correcting MPS I–associated skeletal disease (Figure 4H).
Differential skeletal outcome of gene therapy and HCT. (A-B) Pictures (A) and 3-dimensional reconstructions of CT scans (B) from MPS I, WT, HCT, and GT mice 6 months after treatment, showing the different gross appearance of the treated and control mice (the GT mouse shown in panels A and B had a VCN of 5.4 on bone marrow; the HCT mouse had a donor-cell engraftment of 74% on PBMCs). (C-F) Measurements of skull width (C), zygomus volume (D), femur length (E), and humerus width (F) were performed on CT scan images, as shown on the right side of each chart (see “CT” for details) from MPS I (n = 19), HCT (n = 14), GT (n = 15), and WT (n = 14). For avoiding sex biases, the femur length of only the male mice was reported (MPS I n = 10, HCT n = 10, GT n = 8, and WT n = 8); similar results were obtained in females. (G) Gene therapy–treated mice were divided into 2 groups according to the IDUA activity measured on their PBMCs. The femur length is shown for animals (males and females) having PBMC IDUA activity lower (<) or higher (>) than 1500 nmol/mg/h (1500 nmol/mg/h is the average activity value measured in the entire population of gene therapy–treated mice). (H) SSI (calculated as described in the “Peripheral quantitative CT”) was evaluated by pQCT on the diaphysis of the femur (left chart) and tibia (right chart) from MPS I (n = 19), HCT (n = 14), GT (n = 15), and WT (n = 14). Mean and min/max values are shown: *P < .05; **P < .01; ***P < .001 with 1-way ANOVA (C-F,H); *P < .05 with Student t test (G).
Differential skeletal outcome of gene therapy and HCT. (A-B) Pictures (A) and 3-dimensional reconstructions of CT scans (B) from MPS I, WT, HCT, and GT mice 6 months after treatment, showing the different gross appearance of the treated and control mice (the GT mouse shown in panels A and B had a VCN of 5.4 on bone marrow; the HCT mouse had a donor-cell engraftment of 74% on PBMCs). (C-F) Measurements of skull width (C), zygomus volume (D), femur length (E), and humerus width (F) were performed on CT scan images, as shown on the right side of each chart (see “CT” for details) from MPS I (n = 19), HCT (n = 14), GT (n = 15), and WT (n = 14). For avoiding sex biases, the femur length of only the male mice was reported (MPS I n = 10, HCT n = 10, GT n = 8, and WT n = 8); similar results were obtained in females. (G) Gene therapy–treated mice were divided into 2 groups according to the IDUA activity measured on their PBMCs. The femur length is shown for animals (males and females) having PBMC IDUA activity lower (<) or higher (>) than 1500 nmol/mg/h (1500 nmol/mg/h is the average activity value measured in the entire population of gene therapy–treated mice). (H) SSI (calculated as described in the “Peripheral quantitative CT”) was evaluated by pQCT on the diaphysis of the femur (left chart) and tibia (right chart) from MPS I (n = 19), HCT (n = 14), GT (n = 15), and WT (n = 14). Mean and min/max values are shown: *P < .05; **P < .01; ***P < .001 with 1-way ANOVA (C-F,H); *P < .05 with Student t test (G).
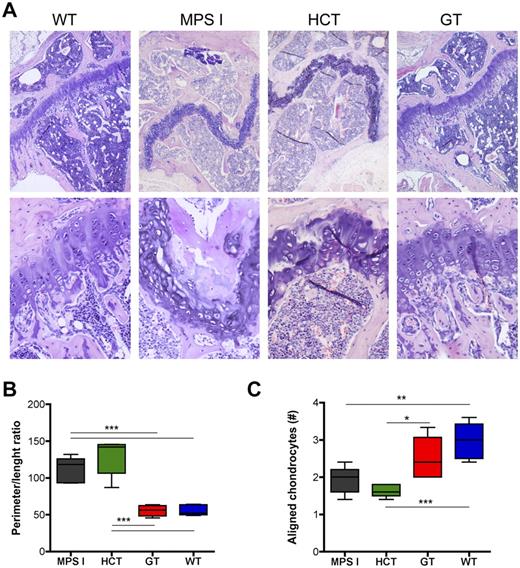
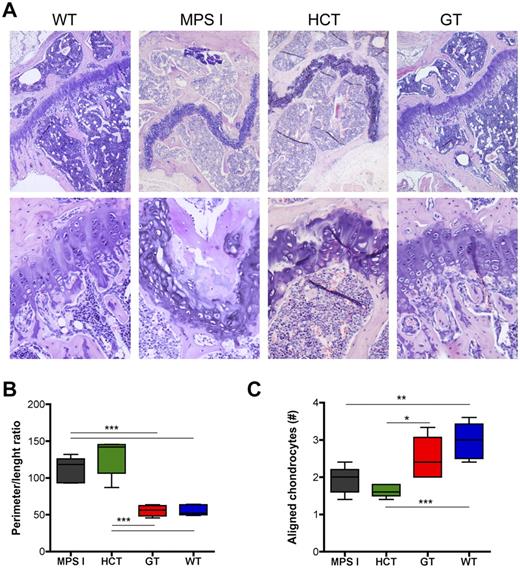
Histopathologic evaluation of the epiphysis of the long bones from control and treated animals confirmed the CT and pQCT findings. Disorganization of the growth plate, with irregular morphology and cell distribution, was demonstrated in both mock-transplanted MPS I mice and animals treated by HCT; on the contrary, the growth plate of GT animals appeared undistinguishable from that of WT mice for morphology and cellular organization (Figure 5A). To quantitatively describe the morphology of the growth plate in the different groups of animals, we performed a morphometric analysis (as detailed in supplemental Figure 2). Briefly, we measured (1) the ratio between the perimeter and the length of the growth plate as a quantitative measure of its altered morphology (the higher the ratio, the more irregular and undulate the growth plate) and (2) the number of chondrocytes aligned in columns perpendicular to the major axis of the growth plate (chondrocytes aligned in perpendicular columns are instrumental for correct bone growth in length and thus are prerequisites for a normal function of the growth plate). These measurements confirmed that the growth plate in mock-treated MPS I mice has a highly irregular morphology and is disorganized, having a very high perimeter:length ratio and a very low number of aligned chondrocytes, compared with WT mice (Figure 5B-C). Interestingly, gene therapy was associated to a normalization of the morphology of the growth plate, with normalized perimeter:length ratio and increased number of aligned chondrocytes; a minor correction of both parameters was observed upon transplantation of WT HSPC (Figure 5B-C).
Differential effect on the growth plate of gene therapy and HCT. (A) Representative pictures of the proximal epiphysis of the tibiae from mock-transplanted and treated mice (hematoxylin and eosin staining), as indicated. The growth plate is disorganized and has an irregular morphology in both mock-transplanted MPS I and HCT mice (the GT mouse shown in panels A-B had a VCN of 6 on bone marrow; the HCT mouse had a donor-cell engraftment of 80% on PBMCs). Magnifications, ×5 and ×20. (B-C) The ratio between the perimeter and the length of the growth plate (B) was calculated, and the number of chondrocytes aligned in columns perpendicular to the major axis of the growth plate (C) was counted (see supplemental Figure 2 for detailed explanation) for 5 representative MPS I, HCT, GT, and WT mice (≥ 3 representative sections per mouse). Mean and min/max values are shown: *P < .05; **P < .01; ***P < .001 with 1-way ANOVA.
Differential effect on the growth plate of gene therapy and HCT. (A) Representative pictures of the proximal epiphysis of the tibiae from mock-transplanted and treated mice (hematoxylin and eosin staining), as indicated. The growth plate is disorganized and has an irregular morphology in both mock-transplanted MPS I and HCT mice (the GT mouse shown in panels A-B had a VCN of 6 on bone marrow; the HCT mouse had a donor-cell engraftment of 80% on PBMCs). Magnifications, ×5 and ×20. (B-C) The ratio between the perimeter and the length of the growth plate (B) was calculated, and the number of chondrocytes aligned in columns perpendicular to the major axis of the growth plate (C) was counted (see supplemental Figure 2 for detailed explanation) for 5 representative MPS I, HCT, GT, and WT mice (≥ 3 representative sections per mouse). Mean and min/max values are shown: *P < .05; **P < .01; ***P < .001 with 1-way ANOVA.
Restoration of auditory function and retinal thickness in GT mice
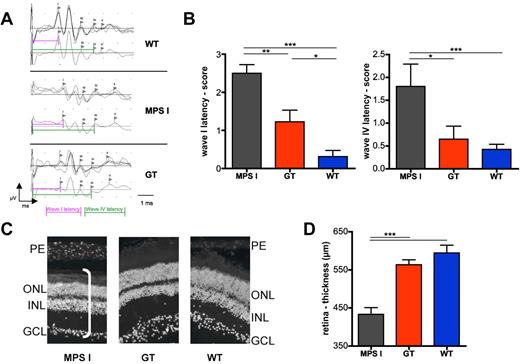
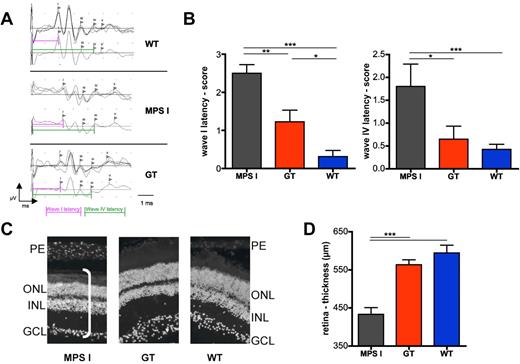
GT and control animals underwent neurophysiologic studies for measurement of their ABRs (Figure 6A-B). Interestingly, whereas up to 60% of mock-transplanted MPS I mice were deaf at ABR testing, only 20% of the GT animals showed a substantial hearing impairment. Moreover, scoring of latencies of peaks I, III, IV, and V demonstrated a significantly reduced latency of all tested waves in GT, compared with mock-transplanted MPS I mice (the latency of peaks I, referring to cochlear processing, and IV, referring to processing in the lateral lemniscus, are shown as representative; Figure 6B), confirming amelioration of the auditory function in affected mice upon treatment.
Effect of gene therapy on auditory brainstem responses and retina integrity. (A-B) ABRs were measured on gene therapy–treated (n = 9) and control mice (n = 9 for WT and 5 for MPS I) 6 months after treatment. (A) Representative response after auditory stimulation in WT, MPS I, and GT mice was measured as the following: for each mouse, 3 series of waves (obtained by an average of 500 electrical signals each) were recorded (shown in the top panel). In the bottom panel, the resultant wave obtained by the average of the 3 traces is shown. The latency of waves I and IV was measured as shown by the pink and green lines, respectively. (B) ABR scores of wave I (left chart) and wave IV (right chart) latencies are shown. (C-D) Retinal thickness (D) of MPS1, GT, and WT mice (n = 3) measured on ×20 magnification pictures upon DAPI (4,6 diamidino-2-phenylindole) staining, as shown in the representative images in (C). n = 3 mice analyzed per group (≥ 6 representative images per mouse). PE indicates photoreceptor layer; ONL, outer nuclear layer; INL, inner nuclear layer; and GCL, ganglion cell layer. The white bar in the picture on the left shows the measured thickness. Mean and SD are shown (*P < .05; **P < .01; ***P < .001 with 1-way ANOVA).
Effect of gene therapy on auditory brainstem responses and retina integrity. (A-B) ABRs were measured on gene therapy–treated (n = 9) and control mice (n = 9 for WT and 5 for MPS I) 6 months after treatment. (A) Representative response after auditory stimulation in WT, MPS I, and GT mice was measured as the following: for each mouse, 3 series of waves (obtained by an average of 500 electrical signals each) were recorded (shown in the top panel). In the bottom panel, the resultant wave obtained by the average of the 3 traces is shown. The latency of waves I and IV was measured as shown by the pink and green lines, respectively. (B) ABR scores of wave I (left chart) and wave IV (right chart) latencies are shown. (C-D) Retinal thickness (D) of MPS1, GT, and WT mice (n = 3) measured on ×20 magnification pictures upon DAPI (4,6 diamidino-2-phenylindole) staining, as shown in the representative images in (C). n = 3 mice analyzed per group (≥ 6 representative images per mouse). PE indicates photoreceptor layer; ONL, outer nuclear layer; INL, inner nuclear layer; and GCL, ganglion cell layer. The white bar in the picture on the left shows the measured thickness. Mean and SD are shown (*P < .05; **P < .01; ***P < .001 with 1-way ANOVA).
Measuring the thickness of the retina of treated and control mice allowed us to assess the impact of gene therapy on the visual system. In particular, the reduction of retinal thickness observed in mock-treated MPS I mice was corrected to values in the range of WT controls by gene therapy (Figure 6C-D).
Other phenotype outcome measures
Treated and control mice underwent echocardiographic evaluation to study disease-associated cardiac abnormalities. However, the study failed to provide relevant information, likely due to a confounding influence of lethal irradiation. Indeed, echocardiography revealed valve disease (ie, thickening of mitral and aortic valves, as well as isolated or combined mitral and aortic regurgitation) in 60% and 70% of the mock-transplanted WT and MPS I animals, respectively. Furthermore, mock-transplanted MPS I mice did not present a significant left ventricular dilatation or increased wall thickness, but rather showed a thickened pericardium (see also supplemental Figure 3). Splenomegaly was not observed in treated and mock-transplanted animals, compared with untreated MPS I controls due to the irradiation procedure (supplemental Figure 3).
Tolerability of gene transfer and enzyme supranormal expression in murine and human HSPCs
To evaluate the tolerability of the treatment, mice underwent bleeding for hemocytometric evaluation and cytofluorimetry (peripheral blood immunophenotype for T and B lymphocytes and myeloid cells) before sacrifice. Moreover, gross necroscopy was performed on each animal, and the liver, spleen, and thymus, plus any suspect lesion, were processed for pathology. No hematologic abnormalities or altered proportion of blood lineages were detected in the peripheral blood of tested animals after recovery from transplant (supplemental Figure 4). Southern-blot analysis, detecting the LV sequence (by a PRE-specific probe21 ) on the spleen DNA from a small subset of treated and control mice, demonstrated a smear suggestive of the absence of predominant clones (data not shown). Pathology identified 2 liver- and spleen-infiltrating B-cell lymphomas, 1 in a mock-transplanted MPS I mouse and 1 in the gene therapy cohort; the lesions were vector negative (data not shown). These findings are consistent with the reported high incidence of B-cell lymphomas in the C57Bl6 strain.30,31 The repopulation and differentiation ability of the transduced cells in the lethally irradiated recipients (supplemental Figure 4) indicates that IDUA supranormal expression does not affect the function of murine HSPCs (engraftment failure frequency < 10%).
In the perspective of a future clinical translation of this approach, we assessed the feasibility and tolerability of IDUA supranormal expression at the levels shown to be therapeutic in mice on human CD34+ HSPCs isolated from normal cord blood. Transduction performed according to established protocols17 allowed us to obtain enzyme supranormal expression up to 150-fold above untransduced controls (measured after 14 days of in vitro liquid culture; supplemental Figure 5A) in the presence of several LV integrations (1.05 ± 0.35, measured after 14 days of in vitro semisolid culture of progenitors—colonies from colony-forming cell assay) lower than that required to obtain similar expression levels in murine HSPCs. Importantly, when transplanted into sublethally irradiated Rag2−/−γ-chain−/− mice,23 IDUA overexpressing cells in the long-term repopulated the hematopoietic organs of chimeric mice with an efficiency comparable with untransduced cells (supplemental Figure 5B) and underwent multilineage differentiation (supplemental Figure 5C-E). Importantly, the cells retained IDUA supranormal expression over the long-term in vivo (supplemental Figure 5F). Of note, IDUA activity measured in the murine tissues was proportional to the human cell engraftment in each organ (supplemental Figure 5G).
Discussion
The data here described, which resulted from a comparison of the transplantation of engineered versus WT HSPCs, indicate that gene therapy represents an effective, applicable therapeutic opportunity for MPS I patients warranting future development toward clinical testing. Indeed, we here demonstrate that gene-corrected cells are capable of robust, effective delivery of the functional IDUA enzyme to diseased tissues, including the CNS, where supranormal enzymatic activity was measured. This finding is particularly relevant in light of the inability of WT HSPC transplantation as well as of other tested gene therapy approaches to deliver comparable amounts of enzyme to the brain. The efficient delivery of IDUA to diseased sites was associated with metabolic correction of the affected tissues, as shown by the clearance of accumulated GAGs within hematopoietic and nonhematopoietic cells. This finding suggests the occurrence of active secretion of the functional enzyme by the gene corrected progeny of the transplanted cells and its reuptake by the resident populations. Importantly, the efficient clearance of the storage material achieved by gene therapy allowed us to obtain a complete correction of the MPS I–associated phenotype. To our knowledge, we here provide first evidence of a correction to normal of the MPS I neurologic and skeletal defects. In particular, behavioral defects as well as neurodegeneration in the CNS were corrected, with dependence from enzymatic activity levels. Similarly, IDUA overexpression in the hematopoietic system allowed for correcting the disease-associated morphologic, morphometric, and densitometric abnormalities of the skeleton, and a dose-effect relationship was shown. Despite functional data on the correction of the heart disease could not be obtained due to limitations of the procedure, the differential clearance of the storage in the heart confirmed the higher proficiency of gene therapy, compared with HCT, also at this disease site. Further studies using either sublethal irradiation or pharmacologic myeloablation will better investigate this finding. Furthermore, when other outcome measures were considered, GT mice showed a significantly improved phenotype up to almost complete normalization of each of the tested parameters. Overall, these results indicate that LV-mediated gene therapy has a superior proficiency with respect to both HCT and other previously tested HSC gene therapy approaches, which were shown to reduce the manifestations of MPS I in mice in a similar way to HCT in humans.12,20 Notably, disease correction was obtained upon treatment of adult animals. Furthermore, these data demonstrate that LV-mediated gene transfer into HSPCs and their progeny is critical for attaining IDUA supranormal delivery to those tissues requiring high enzyme levels for metabolic and functional correction.
Increasing evidences of partial amelioration of histopathologic abnormalities related to lysosomal storage after systemic vector or enzyme administration in LSD animal models treated in adulthood are accumulating.32-36 These results, which, in some cases, are not associated to an overt benefit in terms of neurologic symptom alleviation, are far from being understood. Anyhow, the efficacy of HSC gene therapy could also be related to some IDUA protein being secreted by the transduced hematopoietic cells into the bloodstream. From the circulation, the enzyme could have crossed the blood-brain-barrier and reached the brain independently from the infiltration of gene-corrected myeloid cells. However, the results recently obtained by Wang and colleagues using an erythroid specific expression cassette in the context of an HSPC transplant protocol, demonstrate that enzyme delivery to the brain by serum enzyme crossing the blood-brain barrier can provide only partial benefit to the MPS I neurologic disease.20 We can thus hypothesize that the amount of enzyme delivered to the CNS by this approach is lower than what we obtained, indicating that myeloid cells overexpressing the enzyme could significantly increase IDUA delivery to the CNS (and possibly to the skeleton). Of note, these results were obtained in the context of a procedure well known to induce tolerance to the foreign protein without the need for long-term immunosuppression of the host.10
Therapeutic efficacy shown by gene therapy was here strictly dependent from supranormal levels of IDUA activity within the hematopoietic system of treated mice: high levels of enzyme are, indeed, required to correct the metabolic and functional defect in the MPS I brain and skeleton. Such a requirement for lysosomal enzyme robust delivery to disease sites could be met only upon the efficient transduction of HPSCs by advance generation LVs. An experimental threshold of 1500 nmol/mg/h measured on circulating hematopoietic cells (∼100-fold the activity detected in the PBMCs of WT animals) could be identified as critical for achieving the largest benefit in treated mice. Importantly, in terms of potential for clinical translation, we demonstrated that similar expression levels could be obtained in human HSPCs with a limited amount of LV integrations (1 LV copy per cell, on average) due to the higher proficiency of the human phosphoglycerate kinase promoter in human cells. Moreover, we tested the tolerability of LV-mediated IDUA expression at these supranormal values in both murine and human HSPCs. The unaffected long-term repopulation and differentiation potential of the transduced IDUA overexpressing HSPCs demonstrated that supranormal IDUA activity does not detectably affect HSPC functional properties, as tested in vivo. Further follow-up studies will allow for demonstrating the long-term safety of this approach. However, the safety and overall therapeutic potential of HSC gene therapy are already supported by a large amount of preclinical studies37,38 and, most importantly, by the recently reported promising follow-up of adrenoleukodystrophy patients treated by LV-based HSC gene therapy.19
In conclusion, we here demonstrate that LV-mediated HSC gene therapy allows efficacious enzyme delivery to all MPS I affected tissues, resulting in a complete correction of disease manifestations, including neurologic and skeletal abnormalities, that are refractory to correction by other therapeutic approaches. Therefore, LV-based HSC gene therapy represents an efficacious strategy for the treatment of storage diseases with systemic and CNS involvement and, upon further development, might become an attractive option for MPS I-H patients, potentially capable of addressing the disease manifestations refractory to correction by ERT and HCT.
The online version of this article contains a data supplement.
The publication costs of this article were defrayed in part by page charge payment. Therefore, and solely to indicate this fact, this article is hereby marked “advertisement” in accordance with 18 USC section 1734.
Acknowledgments
We are indebted to J. M. Heard for providing MPS I mice, R. Latini for echocardiography studies, M. Ponzoni for pathology, and A. Rovelli, S. Cenci, and G. Wagemaker for critical discussion of the data.
This research was supported by grants from the National MPS Society (to A.B.) and the Italian Telethon (to A.B. and L.N.).
Authorship
Contribution: I.V., S.D., and L.S.P. performed research and analyzed the data; C.D.D., F. Cerri, E. Mrak, R.D., D.U., M.S., F.S., E. Mariani, C.G., I.R., and F. Cecere performed research; L.S., U.d.C., A.R., R.B., A.Q., and P.D.N. analyzed the data; L.N. and K.P. interpreted the data and edited the manuscript; and A.B. designed experiments, interpreted the data, and wrote the manuscript.
Conflict-of-interest disclosure: The authors declare no competing financial interests.
Correspondence: Alessandra Biffi, HSR-TIGET, San Raffaele Scientific Institute, Via Olgettina 58, 20132 Milan, Italy; e-mail: biffi.alessandra@hsr.it.
References
Author notes
I.V. and S.D. contributed equally to this work.

![Figure 2. Supranormal enzymatic activity allows storage removal in the MPS I–affected tissues. (A) Morphologic analysis of 1-μm sections, toluidine blue stained, from different organs of treated and control animals, as indicated. Representative images show the lysosomal distention in the indicated tissues in MPS I mice (no distention is present in WT animals). Kidney: arrows and arrowheads identify lysosomal storage, which is evident in the tubules (arrows), in the glomeruli (arrowheads; * marks the glomeruli), and in interstitial fibroblasts; liver: arrows highlight storage within hepatocytes, and storage is also present within Kupffer cells; spleen: pathologic storages (arrows) are predominant in the red pulp; heart: pathologic storage is abundant in the endothelium and in myocytes (arrows); frontal cortex: pathologic storage is present within neurons (arrows) and in endothelial cells (v = vessels); subjective score in MPS I: 3-4 in the different examined tissues. Magnification ×100 and ×200. Residual storage is present in all tissues of mice treated with HCTs. Two representative animals (HCT [a] and HCT [b], both having donor-cell engraftment > 70%, as assessed by quantification of donor GFP+ cells in peripheral blood by cytofluorimetric analysis) are shown, demonstrating a different grade of storage (subjective score HCT [a]: 1-2 and HCT [b]: 2-3 in the different examined tissues). Magnification ×100 and ×200. A strong reduction of storage is evident in all the examined tissues from a representative GT mouse having a VCN of 5 in the BM (subjective score: 0-1 in the different examined tissues). Magnification ×100. (B) Lysosomal distention/cell engulfment was scored (see “Methods” for details) in the liver, spleen, heart, kidney, and cortex of treated and control mice. Mean ± SEM are shown; n = 4 representative mice analyzed per group (≥ 3 representative images per mouse). *P < .05; **P < .01; ***P < .001 with 1-way ANOVA. (C-D) GAGs were quantified in the urine (C) and in the tissues (D, as indicated below x-axis; the liver, spleen, and kidney were chosen as representative tissues) of treated and control mice. Mean ± SEM are shown; n ≥ 4 representative mice analyzed per group. *P < .05; **P < .01; ***P < .001 with 1-way ANOVA. (E) Western blot for heparin cofactor II–thrombin (HCII-T) complex was performed on the serum of MPS I, GT, and WT mice. Glyceraldehyde 3-phosphate dehydrogenase (GAPDH; bottom image) was used as an internal control.](https://ash.silverchair-cdn.com/ash/content_public/journal/blood/116/24/10.1182_blood-2010-04-278234/4/m_zh89991062400002.jpeg?Expires=1770721001&Signature=BH2J4h-R-Bjy94UCZv3qTGxx-oX1F0TXf2kX4FJ439ui16AAQ6agXbzDcqPK1QnPtBsHf0LP7OtnQ4Ba9IoqEYLskJJ2RW~0ySzGfH6O5lKC7rRaWsKIMQ3P4~-se2bWP0jg8KoA7754~QuaSr09ejb-vZ-X5uNeHOmCtZuHOBtzDzXLT4q6i3UuWJBYMgbwUTjyIQya~QEoTUFo2f02rFaCAKfYKfwx4YoYqwVFVAHHFwPtfmh6Jf4zy3L2CyJjfT72MCF0FwFwPpGQJkIKK12vfpjIlRd8v2W9q9F7FSMvK8olphzqRCeIWOcIsXMgX2YqKzWWhtlyVUJ-vmuO9g__&Key-Pair-Id=APKAIE5G5CRDK6RD3PGA)

![Figure 2. Supranormal enzymatic activity allows storage removal in the MPS I–affected tissues. (A) Morphologic analysis of 1-μm sections, toluidine blue stained, from different organs of treated and control animals, as indicated. Representative images show the lysosomal distention in the indicated tissues in MPS I mice (no distention is present in WT animals). Kidney: arrows and arrowheads identify lysosomal storage, which is evident in the tubules (arrows), in the glomeruli (arrowheads; * marks the glomeruli), and in interstitial fibroblasts; liver: arrows highlight storage within hepatocytes, and storage is also present within Kupffer cells; spleen: pathologic storages (arrows) are predominant in the red pulp; heart: pathologic storage is abundant in the endothelium and in myocytes (arrows); frontal cortex: pathologic storage is present within neurons (arrows) and in endothelial cells (v = vessels); subjective score in MPS I: 3-4 in the different examined tissues. Magnification ×100 and ×200. Residual storage is present in all tissues of mice treated with HCTs. Two representative animals (HCT [a] and HCT [b], both having donor-cell engraftment > 70%, as assessed by quantification of donor GFP+ cells in peripheral blood by cytofluorimetric analysis) are shown, demonstrating a different grade of storage (subjective score HCT [a]: 1-2 and HCT [b]: 2-3 in the different examined tissues). Magnification ×100 and ×200. A strong reduction of storage is evident in all the examined tissues from a representative GT mouse having a VCN of 5 in the BM (subjective score: 0-1 in the different examined tissues). Magnification ×100. (B) Lysosomal distention/cell engulfment was scored (see “Methods” for details) in the liver, spleen, heart, kidney, and cortex of treated and control mice. Mean ± SEM are shown; n = 4 representative mice analyzed per group (≥ 3 representative images per mouse). *P < .05; **P < .01; ***P < .001 with 1-way ANOVA. (C-D) GAGs were quantified in the urine (C) and in the tissues (D, as indicated below x-axis; the liver, spleen, and kidney were chosen as representative tissues) of treated and control mice. Mean ± SEM are shown; n ≥ 4 representative mice analyzed per group. *P < .05; **P < .01; ***P < .001 with 1-way ANOVA. (E) Western blot for heparin cofactor II–thrombin (HCII-T) complex was performed on the serum of MPS I, GT, and WT mice. Glyceraldehyde 3-phosphate dehydrogenase (GAPDH; bottom image) was used as an internal control.](https://ash.silverchair-cdn.com/ash/content_public/journal/blood/116/24/10.1182_blood-2010-04-278234/4/m_zh89991062400002.jpeg?Expires=1770786678&Signature=ZIzyvDT-zWGz1091MgFao99LQ8uhQzGmwkHs5QL~Kh26~S5xJPbouNbGTUBsDcqIlpuycY1fdh9P7CVh-Q61kjxc6iR5bxoGwoWj50UEenNbRV0d9y6QaAU-b5LNiyHmLclhsWAm6KVY4yIpSgH5Kyf6X~fiZ6T2r9b-aaBWrJiYEykKMOhqH3ljTdavdJAMEchAm1378uuLhbSLZSjBoyvus5NoiumCJ9ugQaPZanNdfAjgwRIq1d64821tyKcjY0a3l6aPwqy6kiSL8FmWXBwy-vvTViag6ir2ZJKa9eu961jiN2-VQTOY0ZhkAfQKvJHuh4oR6S4cRXDRAC-zOg__&Key-Pair-Id=APKAIE5G5CRDK6RD3PGA)
