Abstract
Oncogenic NRAS mutations are frequently identified in myeloid diseases involving monocyte lineage. However, its role in the genesis of these diseases remains elusive. We report a mouse bone marrow transplantation model harboring an oncogenic G12D mutation in the Nras locus. Approximately 95% of recipient mice develop a myeloproliferative disease resembling the myeloproliferative variant of chronic myelomonocytic leukemia (CMML), with a prolonged latency and acquisition of multiple genetic alterations, including uniparental disomy of oncogenic Nras allele. Based on single-cell profiling of phospho-proteins, a novel population of CMML cells is identified to display aberrant granulocyte-macrophage colony stimulating factor (GM-CSF) signaling in both the extracellular signal-regulated kinase (ERK) 1/2 and signal transducer and activator of transcription 5 (Stat5) pathways. This abnormal signaling is acquired during CMML development. Further study suggests that aberrant Ras/ERK signaling leads to expansion of granulocytic/monocytic precursors, which are highly responsive to GM-CSF. Hyperactivation of Stat5 in CMML cells is mainly through expansion of these precursors rather than up-regulation of surface expression of GM-CSF receptors. Our results provide insights into the aberrant cytokine signaling in oncogenic NRAS-associated myeloid diseases.
Introduction
Ras proteins belong to the super family of small guanosine-5′-triphosphate (GTP)ases. They cycle between the active GTP-bound form and the inactive guanosine-diphosphate–bound form. Oncogenic mutations in the 3 RAS genes (H-, N-, and K-RAS) have been identified in virtually all human cancer types, with characteristic incidences and RAS gene associations.1 In particular, mutations in the KRAS and NRAS genes but rarely in the HRAS gene are frequently identified in myeloid disorders, including acute myeloid leukemia (AML),2,3 atypical chronic myeloid leukemia,4 juvenile myelomonocytic leukemia (JMML),5-7 and chronic myelomonocytic leukemia (CMML).7-9
Both CMML and JMML belong to the group of “mixed myelodysplastic/myeloproliferative diseases” (MPDs) as classified by the World Health Organization.7,8 CMML primarily occurs in the elderly with median ages at presentation ranging from 65-75 years, whereas JMML exclusively affects children, typically under the age of 4 years. Despite the demographic difference, CMML and JMML share similar clinical and laboratory features, including leukocytosis, monocytosis, hepatosplenomegaly, and the absence of the BCR-ABL fusion gene.
Compared with JMML, in which deregulation of Ras signaling is a central theme,5-7,10 the molecular pathogenesis of CMML is more diverse and less well understood. Oncogenic mutations in the NRAS gene are frequently identified in CMML patients (17%-60%), and acquired uniparental disomy (UPD) of oncogenic NRAS allele is observed in these patients.11 In contrast, mutations in other genes regulating cell proliferation are observed with much lower frequencies. For example, acquired UPD at the CBL locus occurs in approximately 10% of CMML patients,11 and mutations in the KRAS, PTPN11, JAK2, and FLT3 genes have been only identified in approximately 1%-3% of CMML patients.7-9 In addition, mutations in RUNX1, a master transcriptional regulator of cell differentiation, are also frequent in a group of Asian CMML patients (35%).12 Given the association with a diverse set of molecular abnormalities, it is perhaps not surprising that tumors classified as CMML exhibit a substantial clinical phenotypic diversity, ranging from predominantly “myeloproliferative” (MP-CMML) to predominantly “myelodysplastic” CMML.13 Interestingly, oncogenic RAS mutations are particularly enriched in MP-CMML, which is phenotypically more like JMML than myelodysplastic CMML.14
A cellular characteristic of both JMML and CMML is the formation of abnormal numbers of colony forming unit-granulocyte macrophage colonies in semisolid cultures in the absence and presence of subsaturating concentrations of granulocyte-macrophage colony stimulating factor (GM-CSF).13,15,16 These results lead to a hypothesis that aberrant GM-CSF signaling drives inappropriate cell growth and survival during disease initiation, progression, and malignant transformation. GM-CSF binds to its receptor to promote cell survival, proliferation, and differentiation.17 The GM-CSF receptor (GM-CSFR) includes α and β subunits. Upon ligand binding, they form an active dodecamer or higher-order signaling complex and activate the receptor-associated Janus kinase 2.18 Activated Janus kinase 2 subsequently phosphorylates the receptor and activates signal transducer and activator of transcription 5 (Stat5).19 Phosphorylated GM-CSFR provides docking sites for adaptors and signaling relay molecules, resulting in activation of Ras and its downstream extracellular signal-regulated kinase (ERK) pathway.20
In a recent report studying GM-CSF signaling in JMML and CMML patient samples, aberrant Stat5 signaling signature was identified in a subpopulation of monocytic cells defined as CD33+ CD14+ CD34− CD38lo cells.21 This subset of cells can be used to monitor disease status at diagnosis, remission, relapse, and malignant transformation to an acute phase. However, several challenging questions remain.22 For example, why is hyperactivation of the Ras/ERK pathway heterogeneous in these patients although they all carry defined mutations in the Ras pathway? How does oncogenic Ras signaling lead to consistent hyperactivation of the Stat5 pathway in the absence of any known direct crosstalk?
Several mouse models of CMML have been previously reported, including the knockout of the pro-apoptotic gene Bid,23 the docking protein 1 and docking protein 2 (negative regulators of Ras signaling) double-knockout,24 and endogenous expression of Flt3-internal tandem duplication mutations.25 Unfortunately, GM-CSF signaling was not investigated in any of these models.
To address these questions, we studied GM-CSF signaling in a murine model of CMML. We report here that transplantion of bone marrow cells expressing oncogenic Nras from the endogenous locus leads to an MPD in recipient mice with a prolonged latency and high penetrance that closely resembles the human MP-CMML. Similar to the human disorder, these CMML cells show abnormal growth patterns in in vitro cultures due to aberrant GM-CSF signaling. This abnormal GM-CSF signaling is acquired during CMML development and associated with UPD of oncogenic NRAS allele in 40% of CMML mice. Furthermore, we identify a novel population of CMML cells defined as c-Kit− [Lin Sca-1 IL7Rα]−/low cells that display aberrant GM-CSF signaling in both the ERK1/2 and Stat5 pathways. The aberrant Stat5 signaling in our CMML-like mice is not caused by up-regulation of surface expression of GM-CSFR. Rather, it is mainly achieved through the expansion of granulocytic/monocytic precursor cells, which are highly responsive to GM-CSF stimulation and strongly regulated by oncogenic Nras signaling. Our mouse model will serve as a powerful system to identify and validate cooperating mutations of oncogenic Nras in myeloid leukemias and assess the therapeutic efficacy of molecular agents against these mutations.
Methods
Mice
All mouse lines were maintained on a pure C57BL/6 genetic background (N > 10). Mice bearing the conditional oncogenic Nras (Lox-stop-Lox [LSL] Nras) mutation were crossed to Mx1-Cre mice to generate mice carrying both alleles (LSL Nras/+; Mx1-Cre). Genotyping of the adult mice was performed as described previously.26 CD45.1-positive congenic C57BL/6 recipient mice were purchased from National Cancer Institute.
Cre expression was induced through intraperitoneal injection of polyinosinic-polycytidylic acid (pI-pC; Sigma-Aldrich) as previously described.27 The injected mice were monitored daily for evidence of disease. All animals were killed 1 week after the last injection for experiments described in this manuscript. All experiments were conducted with the ethical approval of the International Association for Assessment and Accreditation of Laboratory Animal Care at the University of Wisconsin-Madison.
Sequence analysis of Nras G12 codon
Total RNAs were extracted from 5 × 10⁶ bone marrow cells of Nras G12D and control mice using the RNeasy Mini Kit (QIAGEN). First strand cDNAs were synthesized using Super-Script First Strand Synthesis System (Invitrogen). Genomic DNA was extracted from bone marrow cells of control, Nras G12D, and CMML mice using the Puregene Tissue Core Kit (QIAGEN). Both reverse-transcription polymerase chain reaction (RT-PCR) and genomic PCR were carried out using primer pairs (5′-GTGAAATGACTGAGTACAAA-3′ and 5′-TATGGTGGGATCATATTC-3′) according to the following conditions: 94°C 2 minutes, 30 circles for 94°C 30 seconds, 55°C 30 seconds, 72°C 30 seconds. BigDye direct sequencing of the amplified products using the reverse primer was carried out at the Biotech Center DNA Sequencing Facility, University of Wisconsin-Madison.
For Pyrosequencing analysis of Nras G12 codon, RT-PCR was carried out using primer pairs (5′-GGGGTCTGCGGAGTTTGA-3′and biotin labeled 5′-TGGATTAGCTGGATCGTCAAGG-5′) according to the following conditions: 92°C 2 minutes, 35 cycles at 92°C for 30 seconds, 53°C for 30 seconds, 72°C for 20 seconds, and a final extension at 72°C for 7 minutes. Pyrosequencing was done on a PyroMarkQ96 ID (QIAGEN) using a primer 5′-GTGGTGGTTGGAGCA-3′ following the manufacturer's instructions. The nucleotide dispensation order was GACTCGTG to analyze the second nucleotide of G12 codon.
Murine bone marrow transplantation
Adult C57BL/6 recipient mice (CD45.1+, 6-8 weeks old) were irradiated with 2 doses of 500 rads from a Cesium source, delivered 3 hours apart. Bone marrow cells were harvested from the femurs and tibias of pI-pC treated mice (CD45.2+) and mice that provided competitor/helper cells (CD45.1+). Live nucleated donor cells (CD45.2+) and competitor cells were counted in 3% acetic acid with methylene blue (StemCell Technologies). The cells were washed and resuspended in phosphate-buffered saline/5% mouse serum and injected into the retro-orbital venous sinus of irradiated CD45.1+ recipients. The transplanted mice were maintained on trimethoprim-sulfamethoxazole-treated water for 2 weeks. Blood was obtained from the retro-orbital venous sinus regularly from 4 weeks after transplantation for flow cytometric analysis and complete blood count. Complete blood count analyses were performed at the Marshfield Labs.
Flow cytometric analysis of phospho-proteins
Phosphorylated signaling proteins were analyzed essentially as previously described28 with the following modifications. Briefly, cells were deprived of serum and cytokines for 1 hour, stimulated with various concentrations of murine (m)GM-CSF for 10 minutes at 37°C, and immediately fixed with paraformaldehyde at a final concentration of 2% (Electron Microscopy Sciences) for 10 minutes at 37°C. Samples were analyzed on a FACSCalibur (BD Biosciences). The data were analyzed using FlowJo v9.0.2 software (TreeStar).
Surface proteins were detected with fluorescein isothiocyanate–conjugated antibodies to B220 (6B2), CD19 (1D3), Gr-1 (RB6-8C5), CD4 (RM4-5), CD8 (53-6.7), CD3 (145-2C11), immunoglobulin M (II/41), IL7Rα (B12-1), Sca-1 (E13-161.7), and TER119 (BD Biosciences), and phycoerythrin-conjugated anti-CD117/c-Kit (eBiosciences). Phospho (p)–ERK1/2 was detected by a primary antibody against p-ERK (Thr202/Tyr204; Cell Signaling Technology) followed by allophycocyanin (APC)–conjugated donkey anti–rabbit F(ab′)2 fragment (Jackson ImmunoResearch). p-Stat5 was detected by Alexa 647 conjugated primary antibody against phospho Stat5 (Tyr 694; BD Biosciences).
Results
Somatic activation of oncogenic Nras at its endogenous locus does not lead to an acute MPD
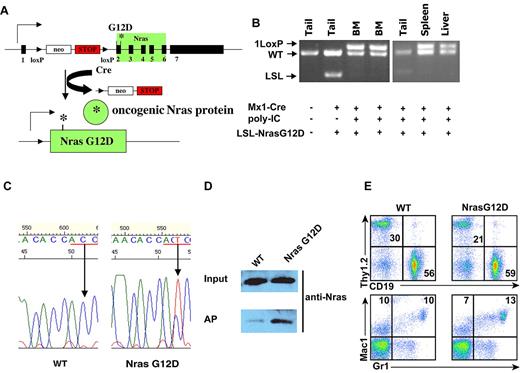
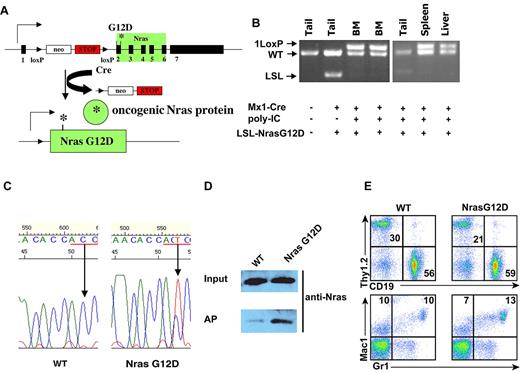
We used a conditional oncogenic Nras mouse line (LSL Nras G12D line)26 to induce oncogenic Nras expression from its endogenous locus in somatic cells. In this mouse line, expression of oncogenic Nras is silenced by a floxed stop cassette upstream of the coding sequence in the absence of Cre and induced upon temporally and spatially controlled Cre expression (Figure 1A). This line was crossed to Mx1-Cre transgenic mice to generate compound mice (LSL Nras G12D/+; Mx1-Cre) on a pure C57BL/6 background. Administration of pI-pC in compound mice stimulates endogenous interferon production and thus induces Cre expression from the interferon-α/β-inducible Mx1 promoter.29 We refer to pI-pC–treated compound mice as Nras G12D mice and pI-pC–treated Mx1-Cre mice as wild-type control mice throughout this manuscript.
Somatic expression of oncogenic Nras at its endogenous level does not lead to acute development of myeloproliferative disease. Six-week-old control and Nras G12D mice were injected with pI-pC as described in “Mice.” One week after last injection, different tissues were isolated and analyzed. (A) Schematic illustration of floxed and activated oncogenic Nras alleles. (B) Genotyping analysis of genomic DNA to detect wild-type allele, LSL allele, and recombined LSL allele (1 LoxP allele). (C) Total RNA was extracted from bone marrow cells. Direct sequencing of RT-PCR–amplified Nras gene using a reverse primer to confirm the sequences at the codon 12 (underlined in red). Arrows indicate the wild-type and mutated nucleotide at the codon 12. (D) Levels of Nras-GTP, the active form of Nras, were analyzed in lysates extracted from bone marrow cells by affinity purification (AP) of lysates using a glutathione S-transferase fusion with the Ras binding domain of Raf (Raf RBD) immobilized on agarose beads followed by Western blot analysis using an antibody against Nras. The top panel illustrates the total input levels of Nras proteins. (E) Peripheral blood samples were collected from Nras G12D mice and control mice. Debris and unlysed red blood cells (low forward scatter) and dead cells (propidium iodide positive) were excluded from analysis. The percentages of T cells (Thy1.2), B cells (CD19), and myeloid cells (Mac1 and Gr1) are indicated on each plot.
Somatic expression of oncogenic Nras at its endogenous level does not lead to acute development of myeloproliferative disease. Six-week-old control and Nras G12D mice were injected with pI-pC as described in “Mice.” One week after last injection, different tissues were isolated and analyzed. (A) Schematic illustration of floxed and activated oncogenic Nras alleles. (B) Genotyping analysis of genomic DNA to detect wild-type allele, LSL allele, and recombined LSL allele (1 LoxP allele). (C) Total RNA was extracted from bone marrow cells. Direct sequencing of RT-PCR–amplified Nras gene using a reverse primer to confirm the sequences at the codon 12 (underlined in red). Arrows indicate the wild-type and mutated nucleotide at the codon 12. (D) Levels of Nras-GTP, the active form of Nras, were analyzed in lysates extracted from bone marrow cells by affinity purification (AP) of lysates using a glutathione S-transferase fusion with the Ras binding domain of Raf (Raf RBD) immobilized on agarose beads followed by Western blot analysis using an antibody against Nras. The top panel illustrates the total input levels of Nras proteins. (E) Peripheral blood samples were collected from Nras G12D mice and control mice. Debris and unlysed red blood cells (low forward scatter) and dead cells (propidium iodide positive) were excluded from analysis. The percentages of T cells (Thy1.2), B cells (CD19), and myeloid cells (Mac1 and Gr1) are indicated on each plot.
pI-pC treatment of Nras G12D mice efficiently induced oncogenic Nras expression in bone marrow, spleen, and liver (Figure 1B-D). One week after the last injection of pI-pC, genotypic analysis of genomic DNA showed that the recombined allele was readily detectable in bone marrow, spleen, and liver cells, and gain of the recombined allele was associated with the loss of the LSL allele, indicating that LSL Nras G12D allele was efficiently recombined by Cre in these tissues (Figure 1B). In contrast, the LSL Nras G12D allele was inefficiently recombined by Cre in other nonhematopoietic tissues (Figure 1B). Total RNA was purified from bone marrow cells. Sequencing of RT-PCR amplification products confirmed that oncogenic Nras was efficiently transcribed at the mRNA level (Figure 1C). Affinity purification of GTP-bound Ras followed by Western blotting using a Nras-specific antibody30 demonstrated that the level of GTP-bound Nras was significantly increased in bone marrow cells expressing oncogenic Nras (Figure 1D).
All of the Nras G12D mice (n = 10) were grossly unremarkable 1 week after the last injection of pI-pC; both white blood cell counts and differentials were normal (Figure 1E and data not shown). Flow cytometric analysis of their hematopoietic tissues, including bone marrow, spleen, thymus, and lymph nodes, did not reveal any significant changes (data not shown). To determine whether Nras G12D myeloid progenitors displayed any abnormal growth patterns, bone marrow cells isolated from control mice or Nras G12D mice were plated in semisolid cultures in the presence of various concentrations of interleukin (IL)–3 or mGM-CSF (supplemental Figure 1, available on the Blood Web site; see the Supplemental Materials link at the top of the online article). Bone marrow cells from Nras G12D mice, but not controls, formed significant numbers of colony forming unit-granulocyte macrophage colonies in the absence of exogenous cytokines. In the presence of IL-3 or GM-CSF, although the colony size of Nras G12D cells was much larger (supplemental Figure 1 and data not shown), Nras G12D cells did not show characteristic hypersensitivity to IL-3 or GM-CSF. These results are in sharp contrast to those of mice expressing oncogenic Kras in a similar experimental system31,32 ; these mice develop acute MPD with a 100% penetrance and their bone marrow cells show hypersensitivity to both IL-3 and GM-CSF.
To determine whether the absence of acute MPD in Nras G12D mice is due to weak oncogenic Nras signaling, we examined the activation of ERK and Stat5 in response to GM-CSF in control and Nras G12D cells (supplemental Figure 2). Total bone marrow cells were deprived of serum and cytokines and stimulated with various concentrations of mGM-CSF. The cells were fixed and permeabilized after cytokine stimulation. These cells were defined in 3 populations based on their characteristic surface marker expression: c-Kit+ [Lin Sca1 IL7RΑ]–/low cells were enriched for myeloid progenitors, c-Kit− [Lin Sca1 IL7RΑ]–/low cells contained putative myeloid precursor cells, and c-Kit− [Lin Sca1 IL7RΑ]+ cells included terminally differentiated lymphoid cells, erythroblasts, and granulocytes. Phospho-ERK1/2 and phospho-Stat5 were analyzed in these 3 populations of cells using multiparameter flow cytometry.28 We did not observe significant hyperactivation of ERK or Stat5 in any subpopulations of Nras G12D bone marrow cells (supplemental Figure 2 and data not shown).
We followed hematopoietic changes in Nras G12D mice over 12 months by analyzing peripheral blood samples regularly with complete blood counts and flow cytometry (supplemental Figure 3). We did not observe any consistent, significant changes in any of the parameters we measured. Within a year after pI-pC induction, approximately 50% of Nras G12D mice were dead (7 of 15; supplemental Figure 4A). One of the 7 mice died of a chronic MPD with monocytosis, closely resembling human CMML, whereas the others presented with massive hepatomegaly with a multinodular infiltrate of malignant F4/80 positive macrophage lineage cells, compatible with a histiocytic sarcoma (supplemental Figure 4).
Recipient mice transplanted with total bone marrow cells expressing oncogenic Nras developed CMML-like phenotypes after a prolonged latency
The genesis of histiocytic sarcoma indicated the overproduction of monocyte/macrophage lineage of cells. However, the temporal onset and location of this disease might be related to the concomitant acquisition of oncogenic Nras in both hematopoietic cells and nonhematopoietic cells.
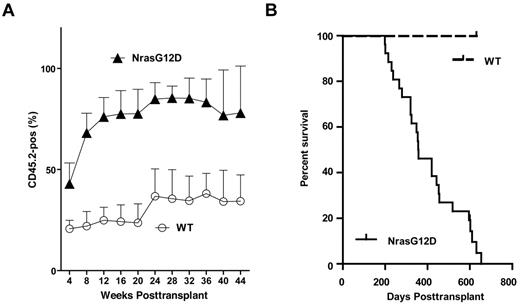
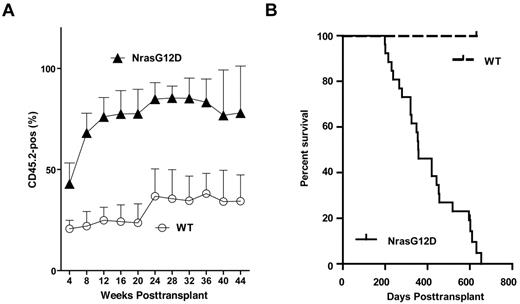
To test whether and how efficiently the oncogenic Nras mutations can initiate hematopoietic malignancies in an hematopoietic-specific manner, we transplanted 2.5 × 10⁵ total bone marrow cells expressing oncogenic Nras (CD45.2+) along with same number of competitor cells (CD45.1+) into 26 lethally irradiated recipient mice (supplemental Figure 5). Bone marrow cells expressing oncogenic Nras displayed a significant growth advantage over wild-type competitor cells from the very beginning of engraftment (Figure 2A).
All recipient mice transplanted with whole bone marrow cells expressing oncogenic Nras died after a prolonged latency. Lethally irradiated mice were transplanted with 2.5 × 10⁵ control bone marrow cells (n = 7) or bone marrow cells expressing oncogenic Nras (n = 26) along with same number of competitor cells. (A) Dynamic contribution of donor-derived white blood cells (CD45.2+) in peripheral blood of recipient mice at different time points posttransplant. (B) Kaplan-Meier comparative survival analysis of reconstituted mice. Cumulative survival was plotted against days after transplantation.
All recipient mice transplanted with whole bone marrow cells expressing oncogenic Nras died after a prolonged latency. Lethally irradiated mice were transplanted with 2.5 × 10⁵ control bone marrow cells (n = 7) or bone marrow cells expressing oncogenic Nras (n = 26) along with same number of competitor cells. (A) Dynamic contribution of donor-derived white blood cells (CD45.2+) in peripheral blood of recipient mice at different time points posttransplant. (B) Kaplan-Meier comparative survival analysis of reconstituted mice. Cumulative survival was plotted against days after transplantation.
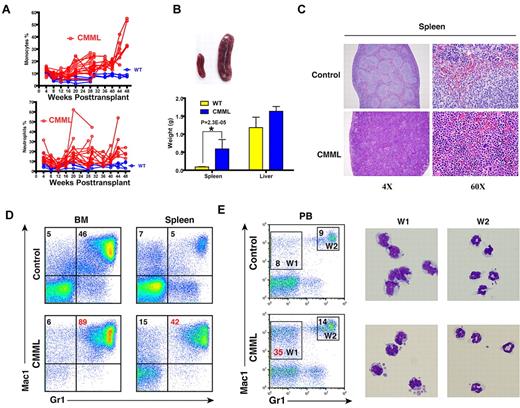
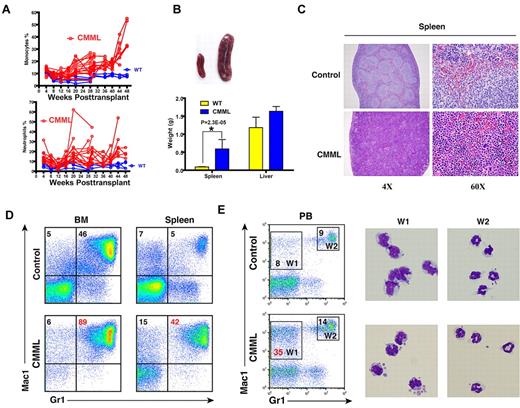
Twenty-five of 26 mice (96%) died with a CMML-like disease starting at 6 months post-transplant (Figure 2B). The disease was characterized by anemia and a leukocytosis with persistent monocytosis in peripheral blood (Figure 3A and supplemental Table 1). The median white blood cell count in CMML mice was significantly elevated (21.8 × 10³/μL vs. 6.4 × 10³/μL in controls). Absolute monocyte counts in CMML mice ranged from 1.9 × 10³/μL to 207.4 × 10³/μL with a median of 26.5 × 10³/μL, which was much higher than that of controls (0.6 × 10³/μL). The majority of CMML mice were anemic with significantly lower hematocrit, hemoglobin level, and red blood cell count, whereas the platelet count was often normal (supplemental Table 1). Diseased mice showed marked hepatosplenomegaly (Figure 3B); on average, their spleens and livers were approximately 8- to 10-fold and 1.6-fold heavier than control mice, respectively. Both the splenic and the hepatic parenchyma were heavily infiltrated by myelomonocytic cells, with the infiltration predominantly involving the white pulp of the spleen and hepatic portal triads (Figure 3C and data not shown). The hepatic lobular architecture was completely effaced by the infiltrative tumor cells. Extramedullary hematopoiesis was evident in both tissues with varying proportions of granulocytic, monocytic, erythroid, and megakaryocytic lineage cells. Flow cytometric analysis using myeloid cell specific markers demonstrated a predominant granulocytic/monocytic proliferation within the spleen and a hypercellular bone marrow revealing a predominantly granulocytic myeloid hyperplasia in diseased mice (Figure 3D). The dominant myeloproliferative features are consistent with a previous observation that oncogenic RAS mutations are particularly enriched in MP-CMML patients.14
The majority of recipient mice transplanted with whole bone marrow cells expressing oncogenic Nras developed a CMML-like disease. (A) Dynamic percentages of donor-derived monocytes and neutrophils in peripheral blood of diseased mice transplanted with Nras G12D cells or control mice transplanted with control cells. (B) Splenomegaly and hepatomegaly in diseased mice. (Top) Splenomegaly in a representative recipient mouse that developed a CMML-like disease. (Bottom) Results are presented as averages of spleen weights or liver weights + SD. (C) Representative histologic hematoxylin and eosin–stained sections from spleen showed an extensive infiltration of myelomonocytic cells and extramedullary hematopoiesis in recipient mice transplanted with bone marrow cells expressing oncogenic Nras. (D) Flow cytometric analysis of bone marrow cells and splenocytes using myeloid specific markers (Mac1 and Gr1). The percentages of monocytic (top left) and granulocytic (top right) lineages of cells are indicated on the plots. Representative data from 8 CMML mice are shown. (E) Quantification of monocytes (W1) and neutrophils (W2) in peripheral blood were based on their surface expression of Mac1 and Gr1. The right panels show May-Grunwald Giemsa–stained cytospin preparations of cells sorted from W1 and W2 regions to confirm the identities of cells.
The majority of recipient mice transplanted with whole bone marrow cells expressing oncogenic Nras developed a CMML-like disease. (A) Dynamic percentages of donor-derived monocytes and neutrophils in peripheral blood of diseased mice transplanted with Nras G12D cells or control mice transplanted with control cells. (B) Splenomegaly and hepatomegaly in diseased mice. (Top) Splenomegaly in a representative recipient mouse that developed a CMML-like disease. (Bottom) Results are presented as averages of spleen weights or liver weights + SD. (C) Representative histologic hematoxylin and eosin–stained sections from spleen showed an extensive infiltration of myelomonocytic cells and extramedullary hematopoiesis in recipient mice transplanted with bone marrow cells expressing oncogenic Nras. (D) Flow cytometric analysis of bone marrow cells and splenocytes using myeloid specific markers (Mac1 and Gr1). The percentages of monocytic (top left) and granulocytic (top right) lineages of cells are indicated on the plots. Representative data from 8 CMML mice are shown. (E) Quantification of monocytes (W1) and neutrophils (W2) in peripheral blood were based on their surface expression of Mac1 and Gr1. The right panels show May-Grunwald Giemsa–stained cytospin preparations of cells sorted from W1 and W2 regions to confirm the identities of cells.
Given the prolonged latency of disease development, we reasoned that the oncogenic Nras mutation alone is insufficient to produce CMML-like phenotypes. Rather, it might work cooperatively with additional genetic hits. Indeed, comparative genomic hybridization analysis of 2 independent neoplastic samples identified copy number changes in multiple gene loci (supplemental Table 2). Interestingly, 4 of the involved gene loci were shared by these 2 mice, which encode a hypothetical protein, tubby like protein 4, transmembrane protein 181, and p58IPK-interacting protein, respectively.
In contrast to myeloid differentiation, both T-cell and B-cell development were largely normal in recipient mice (supplemental Figure 6). Two of 26 mice developed T-cell malignancies, 1 of which also developed CMML. Otherwise, we observed a normal T-cell differentiation pattern based on their surface expression of T-cell markers (CD2, CD3, CD4, CD5, and CD8; n = 5; supplemental Figure 6A). None of the recipient mice developed B-cell malignancies. We examined B-cell development in bone marrow (data not shown) and spleen (supplemental Figure 6B) isolated from CMML mice based on their surface expression of B220, a marker expressed throughout B-cell development, in combination with other surface markers (reviewed in33 ). Due to the infiltration of myelomonocytes and extramedullary hematopoiesis, the B-cell compartment was often under-represented in spleens of CMML mice. Nonetheless, B-cell development was normal (n = 3).
Myeloid progenitors in CMML-like mice show abnormal growth pattern in semisolid culture
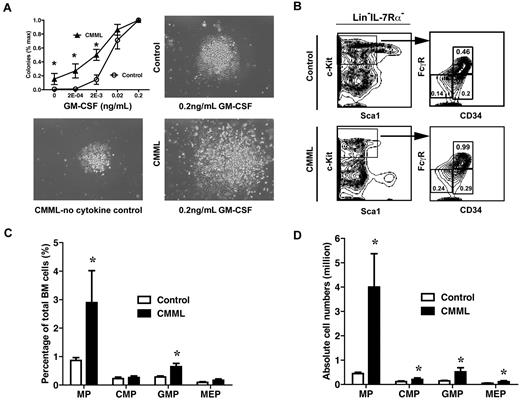
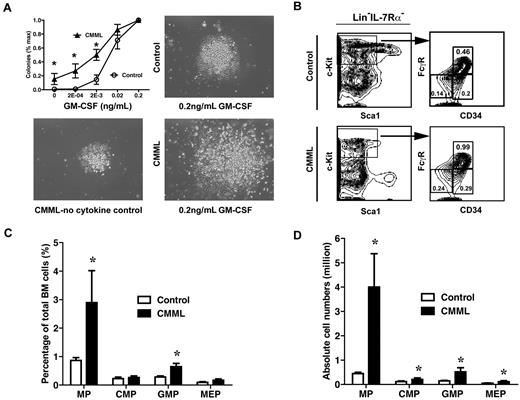
To determine whether myeloid progenitors isolated from CMML-like mice displayed similar abnormal growth patterns as seen in CMML patients, bone marrow cells isolated from control mice or CMML mice were plated in semisolid cultures in the presence of various concentrations of purified mGM-CSF. We found that only CMML cells formed spontaneous myeloid colonies in the absence of cytokines, and the colony numbers and sizes increased dramatically in the presence of GM-CSF compared with those of control cells (Figure 4A). Colony replating assays also showed that CMML myeloid progenitors gain transient self-renewal capabilities in vitro in response to GM-CSF (data not shown).
Myeloid progenitors from CMML mice show abnormal growth pattern in semisolid culture. (A) A quantity of 5 × 10⁴ bone marrow cells isolated from CMML mice and control mice were plated in duplicate in semisolid medium with or without GM-CSF. The data are presented as average percentages (from multiple CMML-like and control mice) of maximum number of colonies formed in culture with 0.2 ng/mL of GM-CSF. Photomicrographs (original magnification ×20) showed control and CMML myeloid progenitor colonies grown in different concentrations of GM-CSF. Student t test was performed. Error bars show SDs. Asterisks indicate P < .002. (B) Analysis of myeloid progenitors in bone marrow cells isolated from CMML and control mice. Percentages of myeloid progenitors (IL-7Rα– Lin– Sca1– c-Kit+ cells), common myeloid progenitors (CMPs; FcγRlo/− CD34+), GMPs (FcγRhi CD34+), and megakaryocyte erythroid progenitors (MEPs; FcγRloCD34–) relative to total bone marrow cells are indicated. (C-D) Quantitative analysis of myeloid progenitor compartment in control mice (n = 6) and CMML mice (n = 11). Results are presented as averages + SD. Student t test was performed. Asterisks indicate P < .05.
Myeloid progenitors from CMML mice show abnormal growth pattern in semisolid culture. (A) A quantity of 5 × 10⁴ bone marrow cells isolated from CMML mice and control mice were plated in duplicate in semisolid medium with or without GM-CSF. The data are presented as average percentages (from multiple CMML-like and control mice) of maximum number of colonies formed in culture with 0.2 ng/mL of GM-CSF. Photomicrographs (original magnification ×20) showed control and CMML myeloid progenitor colonies grown in different concentrations of GM-CSF. Student t test was performed. Error bars show SDs. Asterisks indicate P < .002. (B) Analysis of myeloid progenitors in bone marrow cells isolated from CMML and control mice. Percentages of myeloid progenitors (IL-7Rα– Lin– Sca1– c-Kit+ cells), common myeloid progenitors (CMPs; FcγRlo/− CD34+), GMPs (FcγRhi CD34+), and megakaryocyte erythroid progenitors (MEPs; FcγRloCD34–) relative to total bone marrow cells are indicated. (C-D) Quantitative analysis of myeloid progenitor compartment in control mice (n = 6) and CMML mice (n = 11). Results are presented as averages + SD. Student t test was performed. Asterisks indicate P < .05.
To determine whether the increase in colony numbers in semisolid culture is partially due to the increased numbers of myeloid progenitors, we also analyzed the frequencies of different myeloid progenitors in CMML mice (n = 10) and control mice (n = 6).34,35 The frequency of total myeloid progenitors, defined as c-Kit+ Lin−/low IL7Rα− Sca-1− cells, was significantly increased in CMML mice (2.9%), compared with those of control mice (0.9%; Figure 4C). This increase was partially due to the expansion of the granulocyte-macrophage progenitor (GMP) compartment (Figure 4B-C; 0.65% in CMML mice vs. 0.28% in control mice). Because of hypercellularity in CMML bone marrow, absolute numbers of all types of myeloid progenitors in CMML mice were significantly increased compared with those of controls (Figure 4D).
c-Kit− [Lin Sca-1 IL7Rα]−/low cells from CMML mice show hyperactivation of the ERK and Stat5 pathways
We investigated the mechanisms underlying the hypersensitivity of CMML cells to GM-CSF in semisolid cultures. We first examined whether this is due to the overproduction of endogenous GM-CSF. Serum GM-CSF levels in CMML mice and control mice were determined using Mouse GM-CSF Flex Set (BD Biosciences). The serum GM-CSF levels in CMML mice were comparable with those of control mice (data not shown). These results suggested that the abnormal growth pattern of CMML cells in semisolid culture is caused by hyperactivation of GM-CSF signaling.
To study GM-CSF signaling, we examined the activation of ERK and Stat5 in response to GM-CSF in c-Kit+ [Lin Sca1 IL7RΑ]–/low cells (enriched for myeloid progenitors), c-Kit− [Lin Sca1 IL7RΑ]–/low cells (putative myeloid precursor cells), and c-Kit− [Lin Sca1 IL7RΑ]+ cells (terminally differentiated lymphoid cells, erythroblasts, and granulocytes) as described in the first subsection of “Results.” Among the 3 populations of cells, activation of ERK1/2 and Stat5 by GM-CSF stimulation was the strongest in c-Kit− [Lin Sca1 IL7RΑ]+ cells. However, the activation pattern was indistinguishable between control and CMML cells (data not shown). In the c-Kit+ [Lin Sca1 IL7RΑ]–/low myeloid progenitor population, we found that activation of the ERK1/2 pathway in CMML cells was heterogeneous, and only approximately 20% of CMML mice displayed hyperactivation of this pathway (Figure 5A top), whereas hyperactivation of the Stat5 pathway in CMML cells was relatively consistent but marginal (Figure 5B top). In contrast, in the c-Kit− [Lin Sca1 IL7RΑ]–/low myeloid precursor population, CMML cells consistently showed hyperactivation of the ERK1/2 pathway at saturated concentrations of GM-CSF (Figure 5A bottom) and hyperactivation of the Stat5 pathway at low concentrations of GM-CSF (Figure 5B bottom).
c-Kit− [Lin Sca-1 IL7Rα]−/low cells from CMML mice show hyperactivation of the ERK and Stat5 pathways. Total bone marrow cells isolated from CMML mice or control mice were serum- and cytokine-starved for 1 hour and stimulated with various concentrations of GM-CSF (0, 0.16, 0.32, 2, and 10 ng/mL) at 37°C for 10 minutes. Levels of phosphorylated ERK1/2 were measured using phospho-specific flow cytometry. Nonneutrophil bone marrow cells were gated for data analysis. Representative gating strategy and plots of p-ERK1/2 (A) and p-Stat5 (B) are shown. Myeloid progenitors are enriched in c-Kit+ [Lin Sca-1 IL7Rα]−/low cells as described in Figure 4 (G1 cells), whereas G2 cells are defined as c-Kit− [Lin Sca-1 IL7Rα]−/low cells. To quantify the activation of ERK1/2 and Stat5 in CMML cells and control cells, median intensities of p-ERK1/2 and p-Stat5 at different GM-CSF concentrations are compared with their respective control cells at 0 ng/mL, which is arbitrarily set at 1. Representative results of 3 experiments of more than 10 independent experiments are shown.
c-Kit− [Lin Sca-1 IL7Rα]−/low cells from CMML mice show hyperactivation of the ERK and Stat5 pathways. Total bone marrow cells isolated from CMML mice or control mice were serum- and cytokine-starved for 1 hour and stimulated with various concentrations of GM-CSF (0, 0.16, 0.32, 2, and 10 ng/mL) at 37°C for 10 minutes. Levels of phosphorylated ERK1/2 were measured using phospho-specific flow cytometry. Nonneutrophil bone marrow cells were gated for data analysis. Representative gating strategy and plots of p-ERK1/2 (A) and p-Stat5 (B) are shown. Myeloid progenitors are enriched in c-Kit+ [Lin Sca-1 IL7Rα]−/low cells as described in Figure 4 (G1 cells), whereas G2 cells are defined as c-Kit− [Lin Sca-1 IL7Rα]−/low cells. To quantify the activation of ERK1/2 and Stat5 in CMML cells and control cells, median intensities of p-ERK1/2 and p-Stat5 at different GM-CSF concentrations are compared with their respective control cells at 0 ng/mL, which is arbitrarily set at 1. Representative results of 3 experiments of more than 10 independent experiments are shown.
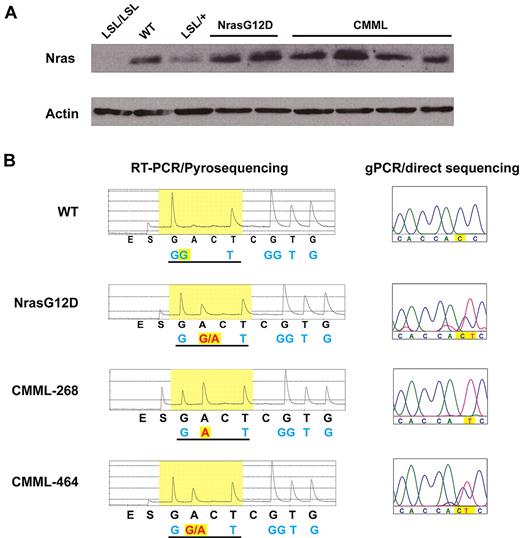
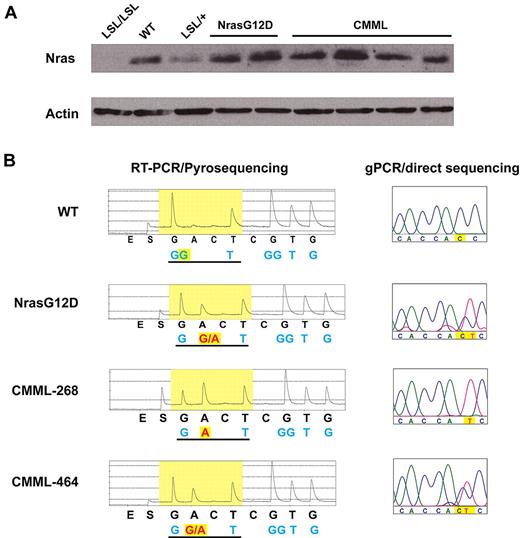
Compared with the phospho-flow results obtained from primary Nras G12D mice (supplemental Figure 2), our data suggest that aberrant GM-CSF signaling is acquired during CMML development. We tested whether this aberrant signaling results from up-regulation of oncogenic Nras expression. Western blot analysis showed that CMML cells express comparable level of total Nras as control and Nras G12D cells (Figure 6A). However, Pyrosequencing analysis of the G12 codon revealed that in 40% of CMML mice, the wild-type Nras transcript is missing (Figure 6B). Consistent with this result, genomic DNA sequencing of the Nras locus in these CMML samples showed loss of wild-type Nras allele (Figure 6B). Comparative genomic hybridization analysis and quantitative genomic PCR failed to detect any copy number change at the Nras locus (data not shown), indicating UPD of oncogenic Nras allele in these CMML samples. This genetic change up-regulates oncogenic Nras expression and is observed in CMML patients with oncogenic NRAS mutations as well.11
A fraction of CMML mice acquire uniparental disomy of oncogenic Nras allele. (A) Western blot analysis of total Nras expression levels in bone marrow cells from representative animals. Note: Nras expression is completely absent in LSL/LSL mice due to the stop cassette, whereas Nras expression in LSL/+ mice is half of that of wild-type (WT) mice. (B) Total RNA and genomic DNA were extracted from bone marrow cells. Pyrosequencing of RT-PCR amplified products and direct sequencing of genomic PCR products at the G12 codon in representative animals are shown. The wild-type and mutated nucleotides are highlighted in yellow.
A fraction of CMML mice acquire uniparental disomy of oncogenic Nras allele. (A) Western blot analysis of total Nras expression levels in bone marrow cells from representative animals. Note: Nras expression is completely absent in LSL/LSL mice due to the stop cassette, whereas Nras expression in LSL/+ mice is half of that of wild-type (WT) mice. (B) Total RNA and genomic DNA were extracted from bone marrow cells. Pyrosequencing of RT-PCR amplified products and direct sequencing of genomic PCR products at the G12 codon in representative animals are shown. The wild-type and mutated nucleotides are highlighted in yellow.
Oncogenic Nras signaling leads to hyperactivation of the Stat5 pathway mainly through the expansion of GM-CSF responsive granulocytic/monocytic precursors
We hypothesized that hyperactivation of the Stat5 pathway in CMML cells might be through up-regulation of surface expression of GM-CSFR and/or through the expansion of GM-CSF responsive cells. We fractionated c-Kit− [Lin Sca-1 IL7Rα]−/low cells using 2 monocytic precursor markers, ER-MP12 and ER-MP20.36,37 Based on their characteristic staining patterns, c-Kit− [Lin Sca-1 IL7Rα]−/low cells were defined into 5 distinct subpopulations: ER-MP12+ ER-MP20−, ER-MP12+ ER-MP20mid, ER-MP12− ER-MP20mid, ER-MP12− ER-MP20hi, and ER-MP12+ ER-MP20hi (Figure 7A, regions I-V, respectively). The percentage of region III cells in CMML mice was consistently and significantly higher than that in control mice (Figure 7B).
Granulocytic/monocytic precursor cells are expanded in c-Kit− [Lin Sca-1 IL7Rα]−/low compartment in CMML-like mice. Total bone marrow cells were isolated from control and CMML-like mice and simultaneously stained for myeloid progenitors as well as for granulocytic/monocytic precursors. (A) Regions I-V are defined by characteristic staining pattern of cells, including ER-MP12+ ER-MP20−, ER-MP12+ ER-MP20mid, ER-MP12− ER-MP20mid, ER-MP12− ER-MP20hi, and ER-MP12+ ER-MP20hi, respectively. The density plots and percentages of regions I-V cells in c-Kit− [Lin Sca-1 IL7Rα]−/low compartment (B) are shown from 1 representative control and 1 CMML-like mouse. (C) Sorted cells from region III were subjected to phospho-flow analysis in the ERK and Stat5 pathways as described in Figure 5.
Granulocytic/monocytic precursor cells are expanded in c-Kit− [Lin Sca-1 IL7Rα]−/low compartment in CMML-like mice. Total bone marrow cells were isolated from control and CMML-like mice and simultaneously stained for myeloid progenitors as well as for granulocytic/monocytic precursors. (A) Regions I-V are defined by characteristic staining pattern of cells, including ER-MP12+ ER-MP20−, ER-MP12+ ER-MP20mid, ER-MP12− ER-MP20mid, ER-MP12− ER-MP20hi, and ER-MP12+ ER-MP20hi, respectively. The density plots and percentages of regions I-V cells in c-Kit− [Lin Sca-1 IL7Rα]−/low compartment (B) are shown from 1 representative control and 1 CMML-like mouse. (C) Sorted cells from region III were subjected to phospho-flow analysis in the ERK and Stat5 pathways as described in Figure 5.
To determine whether region III cells are the major subpopulation of cells regulated by oncogenic Nras signaling, we sorted cells from regions II-V and performed phospho-flow analysis. Consistent with our hypothesis, region III cells isolated from CMML mice showed most significant hyperactivation of the ERK pathway upon GM-CSF stimulation (Figure 7C and data not shown). In contrast, activation of the Stat5 pathway in region III cells from CMML mice was indistinguishable from that of control cells. We further examined cell morphology of region III cells. Their morphologies generally corresponded to granulocytic/monocytic precursors in the ER-MP12− ER-MP20mid population (data not shown).
We measured surface expression level of GM-CSFR using chimeric protein containing the Fc fragment of human immunoglobulin G1 coupled to mouse GM-CSF (GM-Fc), which is able to specifically bind to mGM-CSFR and induce proliferation of GM-CSFR transduced Ba/F3 cells.38 The surface expression levels of GM-CSFR in different populations of CMML cells, including c-Kit+ [Lin Sca-1 IL7Rα]−/low myeloid progenitors, c-Kit− [Lin Sca-1 IL7Rα]−/low precursor cells, and regions I-V cells within the c-Kit− [Lin Sca-1 IL7Rα]−/low cells, were indistinguishable from those in control cells (supplemental Figure 7 and data not shown). These results indicate that hyperactivation of the Stat5 pathway in CMML cells is not through up-regulation of surface expression of GM-CSFR.
Oncogenic Nras-initiated CMML is transplantable to a fraction of secondary recipients with a similar latency as seen in primary CMML mice
To determine whether oncogenic Nras-initiated CMML is transplantable, we transplanted different amounts of bone marrow cells (1 × 10⁶, 5 × 10⁶, or 10 × 106) from individual CMML mice to sublethally irradiated secondary recipient mice. Three of 10 mice displayed CMML-like phenotypes after a prolonged latency (data not shown), indicating that despite the expansion of GMP compartment, these cells are not malignantly transformed and thus incapable of maintaining CMML-like phenotypes. Instead, the CMML-like phenotypes are likely to be maintained by hematopoietic stem cells (HSCs). The frequencies of HSCs in the bone marrows of primary CMML recipient mice are much lower than those of controls (low frequency of LSK cells in Figure 4B and data not shown). Therefore, it is not surprising that some of the secondary recipient mice did not develop CMML as they did not receive sufficient donor HSCs to establish long-term engraftment.
Discussion
In this paper, we study the cellular and signaling mechanisms concerning the induction of CMML by oncogenic Nras expressed from its endogenous locus. First, we demonstrate that as the first genetic hit, oncogenic Nras efficiently induces CMML in a cell-autonomous manner. Second, a novel population of CMML cells acquires aberrant GM-CSF signaling in both the ERK and Stat5 pathways during CMML development. Third, acquisition of aberrant GM-CSF signaling is associated with UPD of oncogenic Nras allele in 40% of CMML mice. Fourth, hyperactivation of the Stat5 pathway is mainly achieved through the expansion of granulocytic/monocytic precursors, which are highly responsive to GM-CSF and strongly regulated by oncogenic Nras signaling.
Over-expression versus endogenous expression of oncogenic Nras
The role of oncogenic Nras in leukemogenesis has been previously investigated in several mouse models. Transgenic mice expressing oncogenic Nras under the control of different promoters developed T-cell and B-cell lymphomas that do not usually harbor oncogenic NRAS mutations in humans.39-41 These results might be attributed to expression of this oncogene in the wrong cell types. Conceivably, the extent to which they accurately model human disease is questionable. Later attempts to over-express oncogenic Nras in bone marrow cells under the control of the Moloney murine leukemia virus long terminal repeat or using the murine stem cell virus vector yielded CMML/AML in recipient mice within 3-6 months post-transplant.42,43 However, these systems grossly over-express the oncogene. Whether or not CMML/AML would equally occur with endogenous transcriptional regulation of the Nras locus was, until now, uncertain. In our model, we show that endogenous expression of oncogenic Nras in recipient mice efficiently leads to a CMML-like disease after a prolonged latency and that disease development is associated with aberrant GM-CSF signaling and UPD of oncogenic Nras allele, both of which are seen in human CMML specimens.11,21 However, none of the recipient mice developed AML. These results further highlight the relevance of our model to the human disease and emphasize the importance of constructing and studying physiologic mouse models for human cancers.
Somatic versus bone marrow–specific expression of oncogenic Nras
In this new model, we find that widespread expression of oncogenic Nras G12D in mice largely leads to histiocytic sarcoma (supplemental Figure 4), whereas bone marrow–specific expression of oncogenic Nras G12D results in CMML (Figures 2–3). Given the long latency of CMML, it is highly likely that the early development of histiocytic sarcomas in the former model obscures the ascertainment of CMML that would eventually develop in most animals. The shared feature in these 2 experimental systems is the malignant transformation of the monocyte/macrophage cells. It would appear, however, that the genesis of histiocytic sarcoma requires simultaneous expression of oncogenic Nras in hematopoietic cells as well as in the hepatic microenvironment. In either case, we believe that it is critical to adopt the bone marrow transplantation system to study the cell-autonomous role of genes in leukemogenesis.
Endogenous oncogenic Kras signaling versus oncogenic Nras signaling
There are dramatic phenotypic discrepancies between endogenous oncogenic Kras and oncogenic Nras mouse models. Somatic expression of oncogenic Kras leads to an acute MPD with a 100% penetrance on both mixed genetic backgrounds31,32 as well as on a pure C57BL/6 background (data not shown). This disease phenotype is completely absent in Nras G12D mice maintained on the same pure C57BL/6 background (Figure 1). Moreover, bone marrow–specific expression of oncogenic Kras in transplanted recipient mice results in phenotypes closely resembling acute T-cell lymphoblastic leukemia/lymphoma (in approximately 60% of cases) and JMML (in approximately 20% of cases).27,44,45 In contrast, under the same experimental setting, bone marrow–specific expression of oncogenic Nras in transplanted recipient mice results in phenotypes closely resembling CMML (in approximately 95% of cases) and T-cell lymphoblastic leukemia/lymphoma (in approximately 8% cases) with prolonged latencies (Figure 3 and data not shown).
These results suggest that endogenous oncogenic Kras elicits different downstream signaling from oncogenic Nras. First, oncogenic Kras activates the downstream ERK pathway more potently than oncogenic Nras28 (supplemental Figure 2). Second, oncogenic Kras signaling might target different populations of hematopoietic cells from oncogenic Nras signaling. Third, because Kras is the major regulator of cytokine-dependent Akt activation,30 it is likely that oncogenic Kras rather than oncogenic Nras hyperactivates the Akt pathway in hematopoietic cells. This possibility is further supported by our observation that oncogenic Nras does not hyperactivate the Akt pathway upon stem cell factor stimulation in myeloid progenitors (data not shown).
Activation of Ras downstream effector pathways upon cytokine stimulation
ERK and Akt are the 2 major signaling effectors downstream of activated Ras. We studied both pathways in our CMML model in response to different cytokine stimulations. We only observed hyperactivation of the ERK pathway at saturated concentrations of GM-CSF. Several possibilities might explain this observation. First, although we defined the populations of hematopoietic cells with multiple surface markers, these cells are still a mixture of various progenitors or precursor cells. Therefore, hyperactivation of the ERK pathway in a small subpopulation of cells might be masked by the majority of negative cells. Second, oncogenic Nras signaling is too weak to result in a detectable hyperactivation of the ERK pathway at low concentrations of GM-CSF. Third, constitutive activation of Nras signaling might trigger some unknown mechanisms to suppress the hyperactivation of ERK. This possibility is further supported by previous reports in the case of oncogenic Kras.26,46
Surprisingly, in JMML and CMML patient samples, phospho-ERK responses to GM-CSF were quite heterogeneous compared with controls.21 This variability is in sharp contrast to our results. However, it remains unclear whether phospho-ERK was studied in CMML patients in the same subpopulation of monocytes, which show distinct aberrant Stat5 signaling. Several possibilities might contribute to the heterogeneity of the human results. First, JMML patients carry various genetic mutations along the Ras signaling pathway. The heterogeneity of these mutations might confer heterogeneity of signaling responses. Second, additional various mutations in these patients might add additional complexities to ERK activation. Third, the population of cells under study is still quite mixed. Therefore, the real hyperactivation signal in a subpopulation of cells is averaged out in the presence of nonresponsive cells.
We examined the activation of the Akt pathway in response to different concentrations of stem cell factor in myeloid progenitor population from CMML-like mice and control mice (data not shown). We did not observe any difference between CMML cells and control cells. This result is consistent with our previous report that Kras is the major regulator of cytokine-dependent Akt activation.30
Mechanism(s) underlying hyperactivation of Stat5 pathway in CMML
Although JMML and CMML patients carry defined mutations in the Ras signaling pathway, including mutations in the KRAS and NRAS genes, aberrant Stat5 signaling becomes a characteristic signaling signature in these patients21,47 as well as in our CMML-like mice (Figure 5). Similar observation of interaction between Ras/ERK signaling and Stat5 was previously reported.48 However, how oncogenic Ras signaling leads to hyperactivation of Stat5 remains unclear. In our CMML-like mice, enhanced onocogenic Nras signaling leads to the expansion of granulocytic/monocytic precursors, which are highly responsive to GM-CSF. When stimulated with GM-CSF, more CMML cells showed activation of Stat5 than control cells. Thus, hyperactivation of Stat5 is mainly achieved through the expansion of granulocytic/monocytic precursors rather than up-regulation of surface expression of GM-CSFR (Figure 7 and supplemental Figure 7). Additional mechanisms might also contribute to hyperactivation of Stat5 because not only the percentages of activated cells but also the signaling intensities are increased in both JMML patient samples47 and our CMML c-Kit− [Lin Sca-1 IL7Rα]−/low cells (Figure 5). One of the possibilities is down-regulation of negative regulators of the Stat5 pathway in these precursors.
A model for oncogenic Nras-initiated CMML
Based on our data, we propose the following model to explain oncogenic Nras-initiated CMML (supplemental Figure 8). As the first genetic hit, oncogenic Nras mutation occurs in a primitive hematopoietic cell, likely to be an HSC. While the hematopoietic cells carrying this mutation continue to proliferate and differentiate, they accumulate secondary genetic events, including UPD of oncogenic Nras allele. These genetic changes lead to aberrant GM-CSF signaling, which drives inappropriate cell growth and survival and subsequent manifestation of CMML-like phenotypes. Thus, the aberrant GM-CSF signaling plays an important role in CMML development and could constitute a valuable therapeutic target for CMML.
The online version of this article contains a data supplement.
The publication costs of this article were defrayed in part by page charge payment. Therefore, and solely to indicate this fact, this article is hereby marked “advertisement” in accordance with 18 USC section 1734.
Acknowledgments
We are grateful to Drs Kevin Haigis and Tyler Jacks for providing us the conditional oncogenic Nras allele. We thank Dr Peter Krutzik for his helpful suggestions of analyzing and presenting phospho-flow data. We are grateful to Dr Kristine Klos for her help with immunofluorescence staining of paraffin embedded tissues. We thank Drs Emery Bresnick, Jing Chen, Norman Drinkwater, Lily Huang, and Shannon Kenney for helpful discussion and critical comments on the manuscript.
This work was supported by a Howard Temin Award from the National Cancer Institute, a Shaw Scientist Award from the Greater Milwaukee Foundation, a research grant from the Elsa Pardee Foundation, and an ASH Scholar Award from the American Society of Hematology (J.Z.). This project was also supported in part by the University of Wisconsin Institute for Clinical and Translational Research, funded through a National Institutes of Health/National Center for Research Resources Clinical and Translational Science Award, 1UL1RR025011.
National Institutes of Health
Authorship
Contribution: J.W. contributed to the experimental design and execution and writing the manuscript; Y.L., Z.L., J.D., and M.-J.R. performed experiments; P.R.T. generated control Fc and GM-Fc fusion proteins; K.H.Y. and H.P. performed histopathology analysis; M.D.F. performed histopathology analysis and edited the manuscript; and J.Z. contributed to the experimental design and writing the manuscript.
Conflict-of-interest disclosure: The authors declare no completing financial interests.
Correspondence: Jing Zhang, McArdle Laboratory for Cancer Research, University of Wisconsin-Madison, 1400 University Ave, Rm 417A, Madison, WI 53706; e-mail zhang@oncology.wisc.edu.

![Figure 5. c-Kit− [Lin Sca-1 IL7Rα]−/low cells from CMML mice show hyperactivation of the ERK and Stat5 pathways. Total bone marrow cells isolated from CMML mice or control mice were serum- and cytokine-starved for 1 hour and stimulated with various concentrations of GM-CSF (0, 0.16, 0.32, 2, and 10 ng/mL) at 37°C for 10 minutes. Levels of phosphorylated ERK1/2 were measured using phospho-specific flow cytometry. Nonneutrophil bone marrow cells were gated for data analysis. Representative gating strategy and plots of p-ERK1/2 (A) and p-Stat5 (B) are shown. Myeloid progenitors are enriched in c-Kit+ [Lin Sca-1 IL7Rα]−/low cells as described in Figure 4 (G1 cells), whereas G2 cells are defined as c-Kit− [Lin Sca-1 IL7Rα]−/low cells. To quantify the activation of ERK1/2 and Stat5 in CMML cells and control cells, median intensities of p-ERK1/2 and p-Stat5 at different GM-CSF concentrations are compared with their respective control cells at 0 ng/mL, which is arbitrarily set at 1. Representative results of 3 experiments of more than 10 independent experiments are shown.](https://ash.silverchair-cdn.com/ash/content_public/journal/blood/116/26/10.1182_blood-2010-04-281527/5/m_zh89991063270005.jpeg?Expires=1769093477&Signature=uUpSy42Or3nXlgi7HvjkF6YdCG~zKBC18dE~esQe-eecEUXrjBPbGiYh1jsoAZ5lBQGESDTdjp3Qmb-RoIxwKHXwD-mnf3Pb-xYcu4htqgpoorC4hTrd0HsK7uhRUVSguORNQFY5JmTkZOlLsG~xDErJu~yqiAs2j6kyeUFcrZR-ENkR6nsWmn5I5gawSGAue1iXSdBUZ0UuXO9GJ5Q7dQUpnrxco42vB9Er2VzxS6BKaOnoR-8jD1UaZOLjnVs2wKS65E3GWIRp-Ls8yipjdpwPgrUbyR~rQCO8-ab5gF~ocUALpa5xaZ1O-KBGA3obd0oqsOHn0wMV0gzyo1NFyA__&Key-Pair-Id=APKAIE5G5CRDK6RD3PGA)
![Figure 7. Granulocytic/monocytic precursor cells are expanded in c-Kit− [Lin Sca-1 IL7Rα]−/low compartment in CMML-like mice. Total bone marrow cells were isolated from control and CMML-like mice and simultaneously stained for myeloid progenitors as well as for granulocytic/monocytic precursors. (A) Regions I-V are defined by characteristic staining pattern of cells, including ER-MP12+ ER-MP20−, ER-MP12+ ER-MP20mid, ER-MP12− ER-MP20mid, ER-MP12− ER-MP20hi, and ER-MP12+ ER-MP20hi, respectively. The density plots and percentages of regions I-V cells in c-Kit− [Lin Sca-1 IL7Rα]−/low compartment (B) are shown from 1 representative control and 1 CMML-like mouse. (C) Sorted cells from region III were subjected to phospho-flow analysis in the ERK and Stat5 pathways as described in Figure 5.](https://ash.silverchair-cdn.com/ash/content_public/journal/blood/116/26/10.1182_blood-2010-04-281527/5/m_zh89991063270007.jpeg?Expires=1769093477&Signature=MVAtmAHMGaTYAmAnIHj3lkuLlZGQqr3jn5SIx0apJ-xfHlcGX2bvtsEFSE13V4vRMGHI0jVI1xL4TfCyhI3o4xUekim33as3RM89IxwBaffZKIiR9Wz6yo~BAZXEHB1dc2g-9c~DLJjiFWa930D33oNznC3Ry~cMEFVMYZ579YI-oALNz36C~bfvWztDuoZwsiJXnV3U0~qqBAa5K1nJOkSNt2~unQgWe4vkKkeLhB7EhuhlPEtKNqDnEs-8txfSE6qH0sJj1YzTyI0PsN-G3yqAhb~seCh9OVjyLfjoylBYUbKqNG-T5BEu7kTtQ3bwOdKxmO7mljL8GLasuAeQVg__&Key-Pair-Id=APKAIE5G5CRDK6RD3PGA)

![Figure 5. c-Kit− [Lin Sca-1 IL7Rα]−/low cells from CMML mice show hyperactivation of the ERK and Stat5 pathways. Total bone marrow cells isolated from CMML mice or control mice were serum- and cytokine-starved for 1 hour and stimulated with various concentrations of GM-CSF (0, 0.16, 0.32, 2, and 10 ng/mL) at 37°C for 10 minutes. Levels of phosphorylated ERK1/2 were measured using phospho-specific flow cytometry. Nonneutrophil bone marrow cells were gated for data analysis. Representative gating strategy and plots of p-ERK1/2 (A) and p-Stat5 (B) are shown. Myeloid progenitors are enriched in c-Kit+ [Lin Sca-1 IL7Rα]−/low cells as described in Figure 4 (G1 cells), whereas G2 cells are defined as c-Kit− [Lin Sca-1 IL7Rα]−/low cells. To quantify the activation of ERK1/2 and Stat5 in CMML cells and control cells, median intensities of p-ERK1/2 and p-Stat5 at different GM-CSF concentrations are compared with their respective control cells at 0 ng/mL, which is arbitrarily set at 1. Representative results of 3 experiments of more than 10 independent experiments are shown.](https://ash.silverchair-cdn.com/ash/content_public/journal/blood/116/26/10.1182_blood-2010-04-281527/5/m_zh89991063270005.jpeg?Expires=1770199168&Signature=QLMtNMaK7EjcFs50S3NiH6LHgaDCm~IHlfA2DLz6KGOyxONsGhIBB9TC8UgGupMEIjfLBMwwF-lxJeRw10FOKwbHiLzGTn0MjiTRz17iP86puqYAaH0wc6riUaQlv2LI99ih-XCX4mZ8qRj5ULpV2YtYQNCC8is4yGkxUNkpBTZhnhE5~-o5i5FjDf7vT9ScpBiWUBZfPegVIvjnztkxot9l2khcSJPpBALI2-nmjuVncHm8rGMvVkKL0JakI2g7Lo4awhHtaCP1pbdIoxOj~M9HNJyQi3AW6ibXIHUgg6nk9rplvv-s5dK66bYubmu5cuQVC5Pkhj21guIGg4l05g__&Key-Pair-Id=APKAIE5G5CRDK6RD3PGA)
![Figure 7. Granulocytic/monocytic precursor cells are expanded in c-Kit− [Lin Sca-1 IL7Rα]−/low compartment in CMML-like mice. Total bone marrow cells were isolated from control and CMML-like mice and simultaneously stained for myeloid progenitors as well as for granulocytic/monocytic precursors. (A) Regions I-V are defined by characteristic staining pattern of cells, including ER-MP12+ ER-MP20−, ER-MP12+ ER-MP20mid, ER-MP12− ER-MP20mid, ER-MP12− ER-MP20hi, and ER-MP12+ ER-MP20hi, respectively. The density plots and percentages of regions I-V cells in c-Kit− [Lin Sca-1 IL7Rα]−/low compartment (B) are shown from 1 representative control and 1 CMML-like mouse. (C) Sorted cells from region III were subjected to phospho-flow analysis in the ERK and Stat5 pathways as described in Figure 5.](https://ash.silverchair-cdn.com/ash/content_public/journal/blood/116/26/10.1182_blood-2010-04-281527/5/m_zh89991063270007.jpeg?Expires=1770199168&Signature=zZSc1Yo2PajXu6jZvGleypppkB60b3zqNm6JzgetUA-TEUtM9alSNqhKjO8SsshJNyvWix2J1BkwIFtILNtdx0m5UTgOhSHkBtTtDyWJMliIZ9YvOki7ugklARv19xiFvT0M7Te3EWHk1XBIS7jaZpWKjj0noOMIrJkss1wXqywmdM8lccr2ZHpnG9sJEZxCQqP7Mb~svirPelCZjLfnjqGF8D2uUNySGR3bjRDPAczm9F986k0HKxaMGr21XdI6o4xqABcjqA-fTiVlfu-Q95aqDSAWdIR1Pog1TAZe9VhYpvjAeAu~nWxoW1U5Zt~dzjncCiF5D1DU1zJPe0PaOA__&Key-Pair-Id=APKAIE5G5CRDK6RD3PGA)