Abstract
The A4GALT locus encodes a glycosyltransferase that synthesizes the terminal Galα1-4Gal of the Pk (Gb3/CD77) glycosphingolipid, important in transfusion medicine, obstetrics, and pathogen susceptibility. Critical nucleotide changes in A4GALT not only abolish Pk formation but also another Galα1-4Gal–defined antigen, P1, which belongs to the only blood group system for which the responsible locus remains undefined. Since known A4GALT polymorphisms do not explain the P1−Pk+ phenotype, P2, we set out to elucidate the genetic basis of P1/P2. Despite marked differences (P1 > P2) in A4GALT transcript levels in blood, luciferase experiments showed no difference between P1/P2-related promoter sequences. Investigation of A4GALT mRNA in cultured human bone marrow cells revealed novel transcripts containing only the noncoding exon 1 and a sequence (here termed exon 2a) from intron 1. These 5′-capped transcripts include poly-A tails and 3 polymorphic sites, one of which was P1/P2-specific among > 200 donors and opens a short reading frame in P2 alleles. We exploited these data to devise the first genotyping assays to predict P1 status. P1/P2 genotypes correlated with both transcript levels and P1/Pk expression on red cells. Thus, P1 zygosity partially explains the well-known interindividual variation in P1 strength. Future investigations need to focus on regulatory mechanisms underlying P1 synthesis.
Introduction
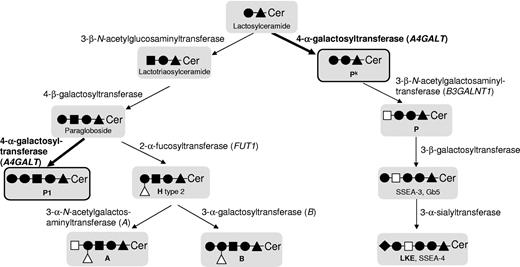
The genetic background has been clarified for 29 of 30 blood group systems recognized by the International Society of Blood Transfusion (ISBT),1 whereas only the P system (ISBT no. 003) remains the exception.2 Despite its name, this system contains only the P1 blood group antigen and neither the P antigen (globoside), which belongs to the GLOB system (ISBT no. 028), nor Pk in the GLOB collection (ISBT no. 209). The biosynthetic pathways, enzymes, and genes involved in synthesizing these glycosphingolipid antigens are summarized in Figure 1. The P1 antigen is present on hematopoietic3,4 and other cells5 but is not fully developed until several years after birth6 even if it is detected already at 12 weeks gestation.7 Naturally occurring antibodies can be produced against Pk, P, and P1 if antigens are lacking. The anti-Pk and anti-P may cause acute intravascular hemolytic transfusion reactions8 and recurrent spontaneous abortions due to damage of the placenta.9 Anti-P1 is sometimes detectable in individuals with the P1-deficient P2 phenotype, but typically has a lower temperature optimum. It is therefore considered a clinically insignificant although commonly found antibody specificity against red blood cells (RBCs).8 The Pk, P, and P1 antigens are also of particular interest in infectious disease because they act as cellular receptors for microorganisms and biotoxins.5 Susceptibility to pathogens such as P-fimbriated Escherichia coli,10 Parvovirus B19,11 and HIV12 differs depending on the P/Pk/P1 antigen status of the host cells to be infected. Interestingly, the prevalence of the P2 phenotype varies between 6% and 80% depending on the ethnicity of the population group investigated.13 It is likely that selection pressure during co-evolution of humans with microbes has had an impact on this variation.
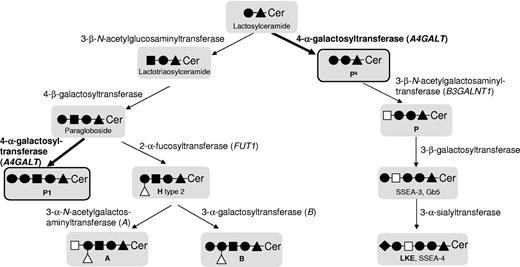
Scheme representing the biosynthesis of Pk, P and P1 antigens and some other related structures, such as the blood group H, A, and B antigens. The symbols used follow the recommendations of Varki et al;50 ie, glucose (▴), N-acetylglucosamine (■), galactose (●), N-acetylgalactosamine (□), fucose (Δ), and sialic acid (♦). Ceramide is abbreviated to Cer. Names of the involved glycosyltransferases are given, and genes known to underlie expression of blood group antigens are given in parentheses. Blood group antigens are written in bold, as are the enzyme activities involved in P1 and Pk synthesis, the 2 antigens most important for this study (also highlighted by black frames and thicker arrows).
Scheme representing the biosynthesis of Pk, P and P1 antigens and some other related structures, such as the blood group H, A, and B antigens. The symbols used follow the recommendations of Varki et al;50 ie, glucose (▴), N-acetylglucosamine (■), galactose (●), N-acetylgalactosamine (□), fucose (Δ), and sialic acid (♦). Ceramide is abbreviated to Cer. Names of the involved glycosyltransferases are given, and genes known to underlie expression of blood group antigens are given in parentheses. Blood group antigens are written in bold, as are the enzyme activities involved in P1 and Pk synthesis, the 2 antigens most important for this study (also highlighted by black frames and thicker arrows).
The P system was discovered in 192714 and the carbohydrate nature of the P1 antigen later elucidated by Morgan and Watkins to include a terminal α1-4Galactose (Gal) coupled to paragloboside, its glycosphingolipid precursor.15 Thus, the enzyme responsible for synthesis of P1 antigen is a 4-α-galactosyltransferase, the chromosomal location of which was determined to be 22q11.3-qter.16 Another blood-group-related 4-α-galactosyltransferase, Pk synthase, transfers Gal to lactosylceramide, a globoseries glycosphingolipid precursor, and is encoded by the third and last exon of A4GALT at 22q13.2.17-19 Indeed, the Pk antigen, also known as Gb3/CD77, resembles P1 in that both include terminal Galα1-4Gal structures of glycosphingolipid nature in humans.20 A summary of the antigens and phenotypes discussed here is found in Table 1. Because Pk is important in several fields of medicine, it has been studied extensively.5 Individuals lacking this antigen (along with P and P1) are designated p, a null phenotype that is rare in most populations,8 although less uncommon among certain population groups, including Swedes21 and the Amish.22 Critical nucleotide changes in the coding regions of A4GALT and B3GALNT1 that encode the Pk- and P-synthesizing enzymes, 4-α-galactosyltransferase (α4GalT, Pk/Gb3 synthase)17,19 and 3-β-N-acetylgalactosaminyltransferase (β3GalNAcT, P/globoside/Gb4 synthase),23,24 have been identified as the genetic bases of Pk and P deficiency, respectively. Subsequently, numerous other nucleotide changes in A4GALT were found to explain the rare p phenotype.22,25-28 In contrast, the genetic basis of the null phenotype (P2) in the P blood group system is still unknown but strikingly, the P1 antigen is lacking in individuals with the p phenotype.8 This implies a common enzymatic background for Pk and P1. However, RBCs of the relatively common P1-negative (P2) phenotype type positive for Pk, which shows that the explanation is not straightforward, and this puzzle has remained unresolved for decades. In addition, the well-known phenomenon of variable P1 expression on RBCs has been suggested to depend on zygosity for the P1 trait,29 but this theory awaits confirmation. Until now, a polymorphic genetic marker to differentiate between the P1 (P1+) and P2 (P1−) blood group phenotypes has been lacking. Accordingly, although DNA-based blood group typing can be undertaken for most antigens, it has not been possible for P1.2
At least 3 main hypotheses to explain the inheritance of P1 antigen have been put forward, including one model suggesting that the same α4GalT is able to transfer Gal residues to both lactosylceramide and paragloboside, but in order to use the latter as the acceptor, a regulatory protein is required.30 Another model postulates the existence of 2 different enzymes, and thus 2 genes, requiring both of them to be inactivated to cause the p phenotype.30 A third model proposes a single gene with 3 alleles; one allele coding for α4GalT that uses both lactosylceramide and paragloboside as acceptors, one allele encoding enzyme using lactosylceramide only and the third allele coding for an inactive transferase.31 None of the polymorphisms originally identified in the coding region of the A4GALT explained the P1/P2 phenotypes.17 Iwamura et al studied 17 Japanese samples and suggested that 2 single nucleotide polymorphisms (SNPs), −551_−550insC and −160A>G, in the 5′-upstream region of A4GALT might explain the P1/P2 phenotypes.32 However, the authors could not substantiate this claim in a transfection model,32 and it was left unsupported by 2 other studies in which the implicated SNPs only partially correlated with the P1/P2 phenotypes among 128 individuals tested.33,34 The implicated region was later shown to contain the A4GALT promoter, but the genetic basis of P1/P2 remained unsolved.35
It was recently reported that the human and chicken α4Gal-T enzymes can synthesize Pk and P1 glycolipids in an in vitro transfection model, whereas the pigeon counterpart makes only P1 antigen on glycoproteins.36 The glycoconjugates produced were not fully characterized but nevertheless this study again focused attention on A4GALT. We therefore set out to elucidate the genetic basis of the P1/P2 phenotypes and found transcripts with a novel A4GALT exon containing 3 polymorphic nucleotides, one of which predicts the presence of P1 antigen.
Methods
Samples and nucleic acid preparation
Bone marrow (n = 3) and blood (n = 205) from apparently healthy donors were obtained following informed consent in accordance with the Declaration of Helsinki. Approvals from The Regional Ethics Review Board at Lund University were obtained for bone marrow collection and genetic blood group analysis on blood samples from blood donors. RBCs were collected and stored in the CellStab low-ionic strength preservative solution (DiaMed AG) for phenotyping and flow cytometry. DNA was isolated using QIAamp DNA Blood Mini kit (QIAGEN GmbH). RNA was extracted from buffy coat using TRIzol reagent (Invitrogen). RNA from cultured cells was extracted using QIAshredder and RNeasy Mini kit (QIAGEN). RNA samples were treated with DNase to eliminate DNA contamination using TURBO DNA-free kit (Ambion), and cDNA was synthesized with High Capacity RNA-to-cDNA kit (Applied Biosystems) and the GeneAmp PCR System 2700 (Applied Biosystems).
Real-time PCR and data analysis
Quantitative polymerase chain reaction (PCR) was performed on 3 μL of cDNA with TaqMan probes and the 7500 Real-Time PCR System (Applied Biosystems), according to the manufacturer's instructions. Data were analyzed using Sequence Detection software Version 1.3.1 (Applied Biosystems). Enzyme-coding A4GALT transcripts were detected with a TaqMan Gene Expression Assay (Hs00213726_m1; Applied Biosystems, binding to exon 2-3 boundary). Transcript target quantities were normalized to 18S ribosomal RNA (assay Hs99999901_s1). All samples were run in triplicate. The sample with the lowest cycle threshold value was used as a calibrator. We considered as positive the results from any sample with at least 2 detected (cycle threshold < 40) values within the triplicate.
RACE
Messenger RNA was isolated from total RNA extracted from bone marrow cells cultured toward erythropoietic maturation as described previously37 by an mRNA Isolation kit (Roche Diagnostics). Rapid amplification of cDNA ends (RACE) was performed with the FirstChoice RLM-RACE kit (Ambion) according to the manufacturer's recommendations. In the 5′-RACE, cDNA was synthesized with random primers provided with the kit. Gene-specific primers Pk-150R and Pk-47R were used for PCR amplification together with the 5′-RACE primers provided in the kit. Primers Pk 2a-90R and Pk-2a-R-con were used to define the 5′ end of the transcripts including the new exon 2a. For the 3′-RACE, PCR was performed with primers Pk-ex1-F, Pk 69F, and Pk-110-F, together with the 3′-primers included in the kit. Primer sequences are shown in Table 2.
P1/P2 phenotyping
All samples were phenotyped for the P1 antigen using commercially available anti-P1 reagents according to routine blood banking procedures.38 The anti-P1 used varied over time (because this was done as part of routine practice), but all were Conformité Européenne (CE)–labeled reagents approved for clinical use on the European market.
A 15-donor cohort of samples was investigated with 3 different antisera (Table 3). Agglutinates were scored visually, and reaction strength was assigned as negative or positive, from weak (+) to the strongest (4+) according to immunohematologic practice. RBCs of known P1/P2 phenotypes were used as controls.
Sequencing
The novel exon 2a was amplified and sequenced. The buffered amplification mix contained 2 nmol of each dNTP (Applied Biosystems), 4 pmol forward primer Pk i1 2145F, 4 pmol reverse primer Pk i1 2648R (Table 2), 100 ng DNA, and 0.5 U Taq Gold Polymerase (Applied Biosystems). Reactions were executed in the GeneAmp PCR System 2700.
PCR conditions were 96°C for 7 minutes, then 30 cycles of 94°C for 30 seconds, 62°C for 30 seconds, 72°C for 20 seconds. The same primers were used for sequencing. All amplification products were separated by high-voltage electrophoresis on 3% agarose gels (SeaKem; FMC Bioproducts) stained with ethidium bromide (0.56 mg/L gel; Sigma-Aldrich). Products were purified using the QIAquick gel extraction kit (QIAGEN), sequenced with the BigDye Terminator kit v1.1 (Applied Biosystems), and analyzed on a 3130 Avant/Genetic Analyzer (Applied Biosystems).
P1/P2 genotyping methods
PCR-ASP.
A PCR-ASP (allele-specific primer) assay was designed for P1/P2 genotyping. Buffered amplification mixes with a total volume of 11 μL included 2 nmol of each dNTP, 4 pmol PkP1P2-F, 4 pmol PkP1m-R or PkP2m-R, 0.8 pmol each forward and reverse control primers JK-ASP-CF and JK-ASP-CR (Table 2), 100 ng DNA, and 0.5 U Taq Gold Polymerase. Amplification was performed as above with addition of an elongation step for 1 minute at 72°C. Amplicons were visualized on 3% agarose gels.
PCR-RFLP.
Primers Pk2145F and Pk2a-240-R were used to amplify a PCR fragment using the above conditions. The amplified fragment was digested with NlaIII (New England Biolabs) for 1 hour at 37°C and digestion products separated and stained on 4% agarose gels.
Allelic discrimination.
A custom-made TaqMan SNP Genotyping Assay (Applied Biosystems) was run according to the manufacturer′s instructions on the 7500 Sequence Detection System (Applied Biosystems).
Luciferase assay
Constructs for the luciferase assay were made from 2 promoter variants containing 5 polymorphic sites. PCR fragments of 6 different sizes from each variant were amplified with primers listed in Table 2. PCR conditions: 200 ng genomic DNA were mixed in a final volume of 25 μL containing 3mM MgCl2, 0.4mM dNTP, 1 × guanine-cytosine (GC)-rich buffer with DMSO (dimethyl sulfoxide), 0.5M GC-rich resolution solution, 0.4μM each forward primer and Pk+6R for all fragments, and 2 U GC-rich enzyme (Roche). Thermal cycling was undertaken in the GeneAmp PCR system 2700: initial denaturation at 96°C for 3 minutes was followed by 10 cycles at 94°C for 15 seconds, 63°C for 30 seconds, 68°C for 2 minutes, then 25 cycles at 94°C for 15 seconds, 60°C for 30 seconds, and 68°C for 2 minutes. Amplicons were separated and eluted as above. The fragments were digested with MluI/HindIII and cloned into the pGL3 basic vector (Clonetech). pGL3 promoter vector (Clonetech) was used as positive control and pGL3 basic vector (Clonetech) as negative control. Constructs were introduced into 8 × 10⁶ Ramos cells by electroporation using a Gene Pulser (Bio-Rad Laboratories) with electrical settings of 320 V/960 μF. After incubation for 16 hours at 37°C, luminescence was measured using the Dual-Luciferase Reporter Assay System (Promega) and a Glomax 20/20 luminometer (Promega) according to the manufacturer instructions. Values of Firefly luciferase were normalized to the values of Renilla luciferase, which was used as an internal control of transfection efficiency.
Flow cytometry
Washed RBCs (approximately 0.5 × 10⁶) were suspended in 50 μL of phosphate-buffered saline (PBS) in 96-well plates (NUNC) and fixed with 0.07% gluteraldehyde for 10 minutes at room temperature (RT) to prevent agglutination. After incubation, the plate was centrifuged for 1 minute at 350 × g, the supernatant discarded, and RBCs resuspended in PBS. The primary antibody was incubated with the RBCs for 10 minutes at RT, followed by 35 minutes at 4°C. RBCs were washed twice with PBS and incubated with secondary antibody for 10 minutes at RT. The antibodies used are described in Table 3. All incubation steps were performed in the dark on a rotary mixer. Data were collected with a calibrated FACScan flow cytometer (BD Biosciences) and analyzed using Cell Quest software v3.1f (BD Biosciences). PP1Pk-negative (p phenotype) RBCs were used as negative control and P1k RBCs as positive control.
Statistical analysis
Independent 2-sample t test assuming equal variance and 2-tailed distribution was used to determine the significance. The genotype groups (P1P1, P1P2, or P2P2) were compared with each other using the XLSTAT 2009 (Addinsoft) data analyzer. Data were considered statistically significant with respect to the following criteria: *P < .05, **P < .01, ***P < .001.
Results
Semiquantification of A4GALT transcripts from P1 and P2 phenotypes
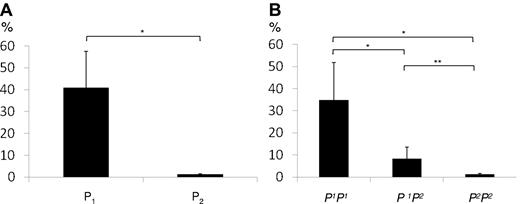
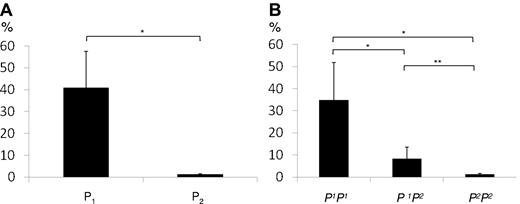
Enzyme-encoding A4GALT transcript levels were initially measured in 10 random blood samples with (P1) or without (P2) the P1 antigen on RBCs. As shown in Figure 2A, the A4GALT transcript levels were approximately 30 times higher in the 5 P1+ samples compared with the P1− samples (Figure 2B is discussed below). A substantial variation in transcript levels among P1 samples was noted, however. To investigate whether the marked difference in transcript levels between P1 and P2 individuals is due to previously described variations in the 5′-upstream sequence,32,33 a functional study of the proposed promoter region35 was undertaken.
Quantification of A4GALT transcripts. (A) Transcript levels measured by TaqMan gene expression assay in 5 P1 and 5 P2 individuals shows a significant difference. Target quantities were normalized to 18S ribosomal RNA. (B) A4GALT transcript levels depend on P1/P2 genotype. Gene expression levels in peripheral blood were determined with the TaqMan assay in 15 samples of the genotypes P1P1 (n = 5), P1P2 (n = 5), and P2P2 (n = 5). Target quantities were normalized to 18S ribosomal RNA. Both graphs show the mean values and error bars represent SEM values. The y-axis represents the percentage of the highest value obtained. Significance levels are shown as asterisks above the bars.
Quantification of A4GALT transcripts. (A) Transcript levels measured by TaqMan gene expression assay in 5 P1 and 5 P2 individuals shows a significant difference. Target quantities were normalized to 18S ribosomal RNA. (B) A4GALT transcript levels depend on P1/P2 genotype. Gene expression levels in peripheral blood were determined with the TaqMan assay in 15 samples of the genotypes P1P1 (n = 5), P1P2 (n = 5), and P2P2 (n = 5). Target quantities were normalized to 18S ribosomal RNA. Both graphs show the mean values and error bars represent SEM values. The y-axis represents the percentage of the highest value obtained. Significance levels are shown as asterisks above the bars.
Qualitative characterization of A4GALT transcripts
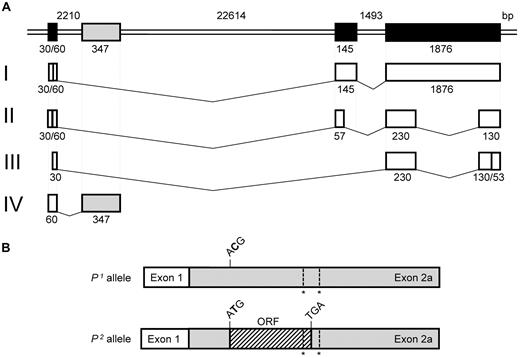
Before creating constructs for the Luciferase assay, 5′/3′-RACE analysis was performed to define the transcription start sites and ends of the A4GALT transcripts. Four different A4GALT transcripts were detected in the Ramos cell line used for these experiments. The originally described transcript with 3 exons (transcript I in Figure 3A) was found with 2 different transcription start sites, in which the length of exon 1 was either 30 or 60 bp. Another transcript (transcript II in Figure 3A) lacked part of exon 2 and most of exon 3, whereas a third transcript (transcript III in Figure 3A) lacked the whole of exon 2 and most of exon 3. These transcripts were sequenced in P1 and P2 individuals, but no polymorphisms were found compared with the genomic consensus sequence. The fourth transcript (designated transcript IV in Figure 3) only consisted of exon 1, a sequence from intron 1 and a poly-A tail, while exons 2 and 3 were missing. This transcript was also found following RACE analysis on cultured human bone marrow cells from donors with different P1/P2 phenotypes and is described in more detail below. Sequences of the identified transcripts and their characteristics were deposited in GenBank (supplemental Figure 1, available on the Blood Web site; see the Supplemental Materials link at the top of the online article).
A4GALT and transcript variants. (A) Schematic presentation of A4GALT at the top with the 3 previously known exons (in black) and a novel exon (here designated exon 2a in gray). The GenBank accession no. NC_00022.10 sequence was used to calculate exon and intron sizes indicated below or above their respective symbols. Four different transcript variants (designated I-IV with previously known exons in white and the new exon 2a in gray) were found in the Ramos cell line, and the actual exon size according to sequencing is given below each white box. Transcript IV was also found in cultured primary human bone marrow cells. (B) The new transcript is shown with exon 1 in white and exon 2a in gray. It includes 1 polymorphism specific for P1/P2 (ACG versus ATG, in which the SNP is highlighted in bold) and 2 unspecific polymorphisms (indicated by asterisks). In P2, the specific polymorphism gives rise to an ORF (hatched) with the potential to be translated into a 28-amino acid peptide.
A4GALT and transcript variants. (A) Schematic presentation of A4GALT at the top with the 3 previously known exons (in black) and a novel exon (here designated exon 2a in gray). The GenBank accession no. NC_00022.10 sequence was used to calculate exon and intron sizes indicated below or above their respective symbols. Four different transcript variants (designated I-IV with previously known exons in white and the new exon 2a in gray) were found in the Ramos cell line, and the actual exon size according to sequencing is given below each white box. Transcript IV was also found in cultured primary human bone marrow cells. (B) The new transcript is shown with exon 1 in white and exon 2a in gray. It includes 1 polymorphism specific for P1/P2 (ACG versus ATG, in which the SNP is highlighted in bold) and 2 unspecific polymorphisms (indicated by asterisks). In P2, the specific polymorphism gives rise to an ORF (hatched) with the potential to be translated into a 28-amino acid peptide.
Two variants of the A4GALT promoter are equally active
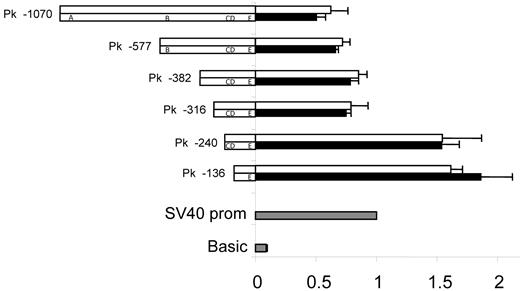
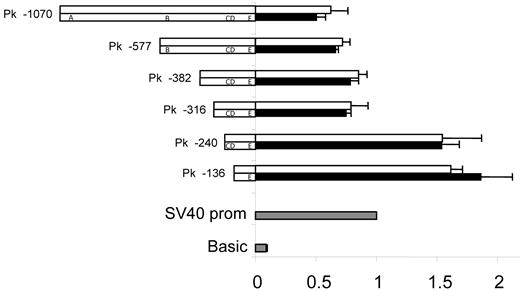
The sequence 5′ upstream of exon 1 in A4GALT was found to harbor strong promoter activity (Figure 4). The 2 shortest deletion constructs (136 and 240 bp long) used to demonstrate this gave approximately 50% higher luciferase levels than the positive control including the strong simian virus 40 (SV40) promoter, whereas sequences longer than 240 bp showed slightly lower expression levels compared with the control. Thus, none of 5 polymorphic sites in the promoter appeared to influence expression levels.
Promoter activity is unaffected by polymorphic sites. Two promoter variants, I (top) and II (bottom), that included the 2 polymorphic sites previously associated with the P1/P2 phenotypes32-34 were constructed as deletion mutants (the names of which are indicated on the left) and investigated. Polymorphisms are designated as follows: A = −907_−903del, B = −551_−550insC, C = −164A>G, D = −160C>T, and E = −17_+8del. Ramos cells were transfected with construct DNA and Renilla DNA. pGL3-vector with SV40 promoter sequence was used as positive control (gray) for which the luciferase activity was set to 1. pGL3-basic was used as negative control (gray). Values from the different constructs were compared with the SV40 promoter vector value. Luciferase values are shown as white (promoter variant I) or black bars (promoter variant II). The results represent the mean of 3 independent experiments and error bars represent standard error of the mean values. The apparent repressor site located between positions −316 and −240 upstream of the transcription start site was evident in both variants analyzed and has also been reported by Okuda et al.35
Promoter activity is unaffected by polymorphic sites. Two promoter variants, I (top) and II (bottom), that included the 2 polymorphic sites previously associated with the P1/P2 phenotypes32-34 were constructed as deletion mutants (the names of which are indicated on the left) and investigated. Polymorphisms are designated as follows: A = −907_−903del, B = −551_−550insC, C = −164A>G, D = −160C>T, and E = −17_+8del. Ramos cells were transfected with construct DNA and Renilla DNA. pGL3-vector with SV40 promoter sequence was used as positive control (gray) for which the luciferase activity was set to 1. pGL3-basic was used as negative control (gray). Values from the different constructs were compared with the SV40 promoter vector value. Luciferase values are shown as white (promoter variant I) or black bars (promoter variant II). The results represent the mean of 3 independent experiments and error bars represent standard error of the mean values. The apparent repressor site located between positions −316 and −240 upstream of the transcription start site was evident in both variants analyzed and has also been reported by Okuda et al.35
Discovery of SNPs in a novel A4GALT transcript
The intronic 289/290-bp sequence spliced to exon 1 in one of the new transcript variants (IV) described above is in fact an alternative exon 2 and was therefore designated exon 2a. The novel exon was sequenced in 95 samples from individuals with the P1 and P2 phenotypes. Three polymorphisms were identified at nucleotide (nt) positions 42C>T, 122T>G, and 135C>delC (where nt 1 is the first residue in exon 2a). Remarkably, nt 42 predicted P1/P2 status, whereas the alterations at positions 122 and 135 showed no allele specificity. All P2 samples were homozygous for 42T; P1 samples were either homozygous for C or heterozygous. The C>T substitution at nt 42 introduces a potential start codon in the P2, which gives rise to a short hypothetical open reading frame (ORF) of 28 amino acids (Figure 3B). One of the other polymorphic sites (122T/G in exon 2a) tentatively changes the last residue in the potential ORF from Gly28 to Trp, thus resulting in 2 variants of the P2-related ORF. 122G is found in 64% of alleles in the P2P2 genotype group, but none of the alleles among P1P1 individuals.
P1/P2 genotype screening
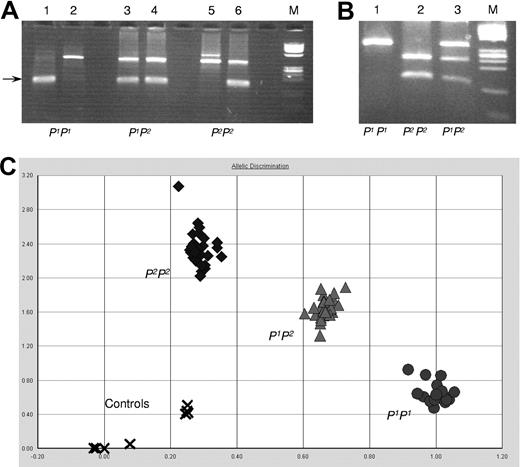
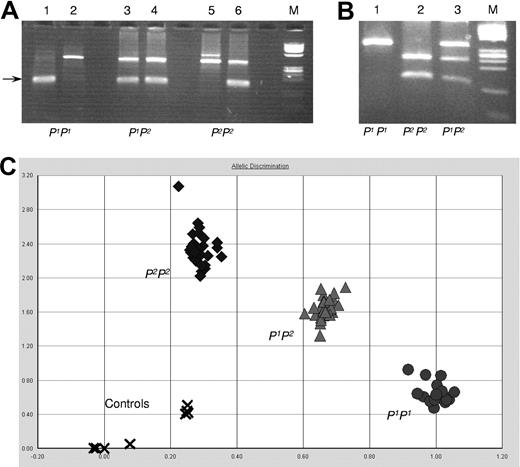
To investigate the correlation between exon 2a polymorphism and P1/P2 phenotypes, more samples were genotyped. Three different genotyping methods were designed and evaluated based on the above findings: PCR-ASP, PCR-RFLP, and AD by a SNP genotyping assay. All 3 assays showed specific and easily interpretable typing patterns (Figure 5) compared with sequence data. It was concluded that all 3 methods could be used for screening purposes as outlined below.
P1/P2 genotyping assays. (A) PCR-ASP: lanes 1, 3, and 5 show the P1-specific amplification, and lanes 2, 4, and 6 show P2-specific amplicons (size indicated by an arrow). The upper band is the JK blood group gene-derived control band present in both JK*A and JK*B and found in all individuals tested so far including those with the Jk(a-b-) phenotype. Lanes 1 and 2, a P1 homozygous sample; lanes 3 and 4, a P1P2 heterozygous sample; and lanes 5 and 6, a P2 homozygous sample. ϕX 174 DNA/HinfI was used as size marker (M). (B) PCR-RFLP: fragments amplified from exon 2a digested with NlaIII and run on a 4% agarose gel. Lane 1 shows the undigested P1P1 sample; lane 2 shows the fully digested P2P2 sample; and lane 3 shows the P1P2 sample with both digested and undigested fragments. ϕX 174 DNA/HinfI was used as size marker (M). (C) AD by the SNP genotyping assay: 25 samples to be typed and 3 control samples with known genotype (one with each genotype) were run in triplicate. Water was used as negative control (indicated by x). All samples clustered in 3 well-defined and separate areas (circles for P1P1; triangles for P1P2; and diamonds for P2P2 samples).
P1/P2 genotyping assays. (A) PCR-ASP: lanes 1, 3, and 5 show the P1-specific amplification, and lanes 2, 4, and 6 show P2-specific amplicons (size indicated by an arrow). The upper band is the JK blood group gene-derived control band present in both JK*A and JK*B and found in all individuals tested so far including those with the Jk(a-b-) phenotype. Lanes 1 and 2, a P1 homozygous sample; lanes 3 and 4, a P1P2 heterozygous sample; and lanes 5 and 6, a P2 homozygous sample. ϕX 174 DNA/HinfI was used as size marker (M). (B) PCR-RFLP: fragments amplified from exon 2a digested with NlaIII and run on a 4% agarose gel. Lane 1 shows the undigested P1P1 sample; lane 2 shows the fully digested P2P2 sample; and lane 3 shows the P1P2 sample with both digested and undigested fragments. ϕX 174 DNA/HinfI was used as size marker (M). (C) AD by the SNP genotyping assay: 25 samples to be typed and 3 control samples with known genotype (one with each genotype) were run in triplicate. Water was used as negative control (indicated by x). All samples clustered in 3 well-defined and separate areas (circles for P1P1; triangles for P1P2; and diamonds for P2P2 samples).
A total of 208 donor samples, including the ones previously sequenced, were P1/P2-typed by serology and at least one of the newly developed genotyping methods. The results of this screening are summarized in Table 4. Full concordance between phenotype and genotype was observed in 207 samples, and only in one case was a discrepancy noted (see Table 4 for details).
Effects of P1/P2 zygosity on A4GALT, P1 and Pk expression levels
Fresh blood samples from selected donors were collected and genotyped with the PCR-ASP method until 5 of each of the 3 different genotypes P1P1, P1P2, and P2P2 were available for in-depth studies of the correlation between zygosity for P1/P2 and 3 expression parameters.
P1 expression measured by serologic testing.
Hemagglutination was performed with 2 monoclonal and one polyclonal anti-P1. All P2P2 samples were negative with the monoclonal reagents, and the P1P1samples were strongly positive, whereas P1P2 heterozygous samples showed weaker serologic reactions than homozygous samples. The polyclonal antibody gave similar reaction patterns but displayed a broader variation, and in 2 cases, P2P2 samples actually gave weakly false positive reactions (Figure 6).
Three different antisera against P1 antigen tested with hemagglutination test. Five samples each with the 3 genotypes P1P1(▴), P1P2(Δ), P2P2 (•) were tested with 2 monoclonal anti-P1 reagents [Immuclone (MAb1), Seraclone (MAb2)] and a polyclonal (PAb) anti-P1 goat antiserum as indicated on the x-axis. Agglutination reactions were visually graded between 0 and 4+ and registered on the y-axis.
Three different antisera against P1 antigen tested with hemagglutination test. Five samples each with the 3 genotypes P1P1(▴), P1P2(Δ), P2P2 (•) were tested with 2 monoclonal anti-P1 reagents [Immuclone (MAb1), Seraclone (MAb2)] and a polyclonal (PAb) anti-P1 goat antiserum as indicated on the x-axis. Agglutination reactions were visually graded between 0 and 4+ and registered on the y-axis.
A4GALT transcription levels.
TaqMan analysis of enzyme-encoding A4GALT transcripts (transcript variant I in Figure 3A) showed significantly higher levels in the P1P1 samples (approximately 28× P2P2 level) than both P1P2 and P2P2 samples (Figure 2B), thus confirming the initial finding in random samples defined by serology only (Figure 2A). There was also a significant (4×) difference in transcript levels between P1P2 and P2P2 samples (Figure 2B).
Antigen expression measured by flow cytometry.
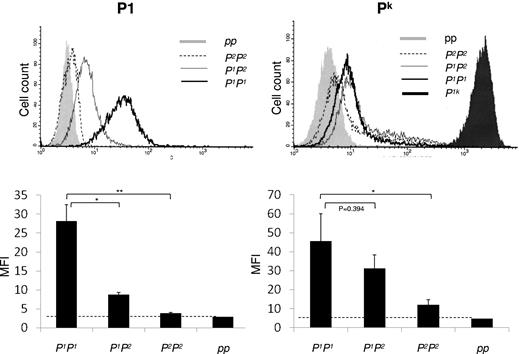
Flow cytometric analysis with monoclonal anti-P1 confirmed the serologic analysis and showed the same pattern as gene expression with significantly lower expression of P1 antigen on RBCs with P1P2 genotype than on P1P1 cells. P2P2 cells appeared to have similar expression as the single example of cells with p phenotype (ie, negative) and showing only background levels of fluorescence (Figure 7). In addition, analysis of Pk antigen expression demonstrated that the Pk levels on RBCs from P1P2-heterozygous donors were lower than P1P1-homozygous, although the difference was not statistically significant. The P2P2-homozygous cells displayed more Pk expression than cells with p phenotype but significantly lower than P1P1 cells (Figure 7).
Pk and P1 antigen expression on RBCs measured by flow cytometric analysis. P1 antigen expression is shown top left with a representative histogram and bottom left the mean fluorescence intensity (MFI) values in a bar graph. Pk antigen expression is shown to the right. In both cases, the genotypes of the tested cells are indicated below the x-axis. As indicated above the histograms, the P1P1 sample is shown with a dark bold line, the heterozygous P1P2 sample with a gray solid line, and the P2P2 sample is shown by a dotted line. The pp sample (negative control) is shown as a filled gray peak, and for the Pk expression, a P1k sample (positive control) is included and shown with a filled black peak.
Pk and P1 antigen expression on RBCs measured by flow cytometric analysis. P1 antigen expression is shown top left with a representative histogram and bottom left the mean fluorescence intensity (MFI) values in a bar graph. Pk antigen expression is shown to the right. In both cases, the genotypes of the tested cells are indicated below the x-axis. As indicated above the histograms, the P1P1 sample is shown with a dark bold line, the heterozygous P1P2 sample with a gray solid line, and the P2P2 sample is shown by a dotted line. The pp sample (negative control) is shown as a filled gray peak, and for the Pk expression, a P1k sample (positive control) is included and shown with a filled black peak.
Discussion
The lack of knowledge regarding the genetic basis for the P1 antigen of the P blood group system has prevented DNA-based typing.2 We have now identified a polymorphic site in the Pk-synthase–encoding A4GALT that correlates to the P1/P2 histo-blood group phenotypes. This discovery makes it possible for the first time to predict the presence or absence of P1 antigen on RBCs by testing DNA. The findings presented here also definitively link the 2 Galα4Gal-terminating glycosphingolipid antigens, P1 and Pk, to each other genetically. The 3 long-standing hypotheses about the genetic relationship between the P1 and Pk antigens outlined in the introduction can now be evaluated in a new light. As indicated by our discovery of a P1/P2-predictive SNP in the novel exon 2a of A4GALT and also suggested by previous studies,32,36 it is highly likely that the α4GalT encoded by A4GALT, synthesizes both antigens. Accordingly, the concept of a closely linked homologous galactosyltransferase gene,30 which encodes for P1 synthesis only while the A4GALT product makes Pk, can be ruled out. Thus, it is logic that genetic alterations found previously in exon 3 cause loss of both P1 and Pk antigens in the p phenotype.17,19,25,27 In fact, our data favor the hypothesis of one gene with 3 types of alleles at a single locus: one that makes P1 and Pk, another that makes Pk only, and a third that makes neither.31 The only difference, of course, is that 26 p alleles (data from dbRBC39 ) have been identified since the cloning of A4GALT a decade ago.17-19 Therefore, it would be expected that both P1 and P2 alleles (defined by the newly discovered exon 2a SNP) can be inactivated by a range of different crucial nucleotide changes to become p alleles. This is indeed the case, as evidenced by our recent finding that the 2 main p alleles in Swedish individuals, 548T>A and 560G>A,17,19,27 are based on the P1 and P2 allelic backbones, respectively (B.T., J.S.W., Å. Helberg, M.L.O., unpublished data, August 2010).
The third hypothesis proposes that a regulating factor encoded by a gene at a chromosomal location close to A4GALT binds to the Pk-synthesizing α4GalT. This would modify the enzyme's acceptor preference from lactosylceramide only (P2 phenotype), to lactosylceramide and paragloboside, which would allow synthesis of both P1 and Pk (Figure 1).30 This model has an appealing analogy in the 4-β-galactosyltransferase, which can bind α-lactalbumin made in mammary tissue so that the enzyme's acceptor specificity changes from N-acetylglucosamine toward glucose and permits synthesis of lactose disaccharides during lactation.40 Interestingly, we identified a short ORF for a 28-amino acid peptide in the new A4GALT transcripts described here that is unrelated to the α4GalT ORF. However, this does not occur in P1 as hypothesized but only in P2. In addition to this qualitative change, we also observed striking quantitative differences in transcript levels (Figure 2) and antigen expression (Figures 6–7) between P1 and P2 individuals. Consequently, it is tempting to conclude that the original regulator theory is invalid. Instead, an alternative hypothesis on the same theme may be formulated: a P2-related molecule (genomic DNA sequence, the new transcript, or a peptide) may down-regulate transcription at the A4GALT locus so that lower amounts of enzyme-encoding mRNA (transcript variant I in Figure 3A) and hence less α4GalT will be produced in the presence of P2. According to this new hypothesis, Pk can be synthesized even at low enzyme levels because lactosylceramide is the favored acceptor, while paragloboside can only be used to make P1 when more enzyme is present. If the regulatory effect of the P2-related molecule is dose-dependent, this may mean that more P1 and Pk antigens would be synthesized in P1-homozygous individuals than in heterozygotes, which is what our data indicate.
Okuda et al studied regulation of A4GALT and found 3 potential binding sites for the Sp1 transcription factor in the promoter but none of these sites involved positions −551_−550insC or −160A>G.35 We measured promoter activity in 2 common promoter sequences, differing at 5 polymorphic sites including these 2 SNPs. However, no differences in the promoter activity could be detected (Figure 4). In theory, the absence of different transcription levels between these promoter variants could be due to lack of transacting factors important for distinguishing between P1 and P2 in the cell line used. It may therefore be necessary to use cell lines of different origins and P1/P2 phenotype to rule out any functional difference between the 2 A4GALT promoter variants. However, it should be kept in mind that none of the genetic differences observed in this region correlated fully with P1/P2 phenotypes.33 Okuda et al investigated the regulation of A4GALT to determine if E coli responsible for hemolytic uremic syndrome can up-regulate Pk expression to aggravate the disease,35 a topic also relevant to other infections, such as urinary tract infections and HIV, and of particular interest since we show here that Pk levels, at least in RBCs, vary according to the zygosity of P1.
We detected significantly more P1 and Pk antigens on RBCs from donors homozygous for P1 than those heterozygous. Thus, zygosity may at least in part explain the well-known but poorly understood variation in P1 strength on RBCs between individuals. It has been proposed previously29 that zygosity for the P1 trait may underlie the strong (scored as 3 to 4+), medium, or weak (scored as 1 to 3+ or even w+) agglutination with anti-P1, and this study indicates that this is indeed the case. Genotyping for P1/P2 may therefore be of value for those reference laboratories producing in-house test RBCs. As previously proposed for other blood groups,41 it is important to characterize the zygosity of test RBC donors so that detection of irregular blood group antibodies pretransfusion is performed at the highest level of safety. Although anti-P1 does not generally cause hemolytic transfusion reactions, accurate identification of anti-P1 permits exclusion of other specificities and selection of P1− cells for further serologic analysis or cross-match–compatible units.
In addition to the quantitative aspects (ie, lower transcript and antigen levels when P2 is present in single or double dose), we identified several different splicing variants among A4GALT-mRNA. The latter is not unexpected, especially in immortalized cell lines. Two of these transcripts (transcript variants II/III in Figure 3A) were not further investigated here due to lack of P1/P2-specific polymorphisms even if they were present also in human mRNA. It has been suggested that A4GALT may have an upstream exon 1 with an alternative promoter,42 but this was deduced from incomplete transcripts in melanoma and breast cancer cells. All transcripts detected in the current study had approximately the same transcription start point and appeared to use the same promoter. The polymorphic transcript (transcript variant IV) was both found in cell lines and human bone marrow independent of P1/P2 genotype but was undetectable in peripheral blood. Attempts to design a real-time PCR assay for its quantification failed due to unspecific binding (data not shown), possibly due to the Alu-derived exon 2a, see below.
Interestingly, the P2-derived ORF of exon 2a is located within an Alu sequence. These approximately 300-bp elements constitute approximately 10% of the human genome, are only found in primates,43 but are thought not to be translated. Comparisons were made to 34 Alu subfamilies and the highest alignment scores were observed for AluSx/AluSq, but neither subfamily had a thymidine at the position corresponding to the P1/P2-specific SNP. Basic Local Alignment Search Tool analysis against several protein databases identified numerous human proteins that are highly homologous to the candidate peptide (data not shown). It has been suggested that Alu motifs are involved in regulation of gene expression,44 but the impact of this is unclear as is the potential for translated Alu sequences to act as transacting factors.
Our data establish the previously suspected genetic linkage between the Pk and P1 antigens, which calls for a blood group terminologic change. Based on abstract presentations of these data at recent scientific congresses,45,46 we proposed to the ISBT Working Party on Red Cell Immunogenetics and Blood Group Terminology that the Pk antigen should be removed from the GLOB collection (ISBT no. 209) and instead join the P1 antigen in the P blood group system (ISBT no. 003). Our proposal also included that the new and more appropriate name for this system should be P1PK to reflect the antigens included. This change eliminates the confusion that arises from the fact that the P antigen is not part of the P blood group system but resides in the GLOB system. Indeed, our proposal to the Working Party was accepted and the new system name, P1PK, is now in effect (oral communication of Geoff Daniels, Bristol, United Kingdom; June 26, 2010).
In summary, the identification of a novel A4GALT transcript with a P1- versus P2-defining SNP has eventually resulted in the possibility of determining these phenotypes genetically. This tool has potential value not only in transfusion medicine, a field where automated use of blood group-specific SNPs has just emerged at large scale.47-49 It may also be of interest for DNA-based prediction of susceptibility to infections caused by pathogens for which P1 and Pk glycosphingolipid levels are of importance. More work is required to understand the mechanisms by which the newly found SNP exerts its function and how the enzyme that synthesizes the P1/Pk antigens is regulated. Furthermore, any clue toward a possible function of Alu motifs in the human genome has implications beyond blood group expression.
The online version of this article contains a data supplement.
The publication costs of this article were defrayed in part by page charge payment. Therefore, and solely to indicate this fact, this article is hereby marked “advertisement” in accordance with 18 USC section 1734.
Acknowledgments
We thank Dr Åsa Hellberg and Dr Alan Chester for fruitful discussions and critical review of data. We also thank Annika Hult for technical assistance with flow cytometric analysis, Dr Magnus Jöud for Alu database searches, and Dr Fredrik Svennelid for assistance with genotyping. Dr Jill Storry is thanked for constructive review of the manuscript. Dr Ed Nudelman is acknowledged for verifying by enzyme-linked immunosorbent assay that the monoclonal anti-P1 used in the study does not cross-react with commercially available pure Pk(Gb3/CD77) glycolipid.
This work was supported by the Swedish Research Council (project no. 71X-14251), the Medical Faculty at Lund University, governmental ALF research grants, and the Skåne county council's Research and Development foundation, Sweden.
Authorship
Contribution: B.T. and J.S.W. conducted experiments; B.T., J.S.W., and M.L.O. analyzed and interpreted data; and B.T. and M.L.O. designed the study and wrote the paper.
Conflict-of-interest disclosure: B.T. and M.L.O. have applied for intellectual property protection of methods described in the paper. J.S.W. declares no competing financial interests.
Correspondence: Martin L. Olsson, Division of Hematology and Transfusion Medicine, Department of Laboratory Medicine, Lund University, BMC C14, SE-221 84 Lund, Sweden; e-mail: Martin_L.Olsson@med.lu.se.

![Figure 6. Three different antisera against P1 antigen tested with hemagglutination test. Five samples each with the 3 genotypes P1P1(▴), P1P2(Δ), P2P2 (•) were tested with 2 monoclonal anti-P1 reagents [Immuclone (MAb1), Seraclone (MAb2)] and a polyclonal (PAb) anti-P1 goat antiserum as indicated on the x-axis. Agglutination reactions were visually graded between 0 and 4+ and registered on the y-axis.](https://ash.silverchair-cdn.com/ash/content_public/journal/blood/117/2/10.1182_blood-2010-08-301333/4/m_zh89991064180006.jpeg?Expires=1769304357&Signature=Bw9XKS~u-y9eyeXFQbgJbjtKNNvux4qaZpHi55wHCBZEUKhwfpZEHV5XcqC5KAPAcCKzEDkCsJ3CLgXIrRRlSPPOI2PP0WOSEYnieI4PdoKpdHy9N1jMCodMG-j0X3Lb7EfdZIAWzZDcYdGzNyiGOIGgC0BN~QZzklsP0TeuybxFYP2JJPW~BAJGTjT-5b~qCRfZryPpeyox2Q8j8d8uR-Smi~Z~EPaWSaROxVpuUy1AUobS~GajBQuQR8I-SYYn5X2t9WRSTw9DCG6jKwepbkHIcyeCSfobykH5D9KDFWnQszchx4236iJ0emCh9H-9w0A2P15Yd~W16jLXaoQyzg__&Key-Pair-Id=APKAIE5G5CRDK6RD3PGA)



![Figure 6. Three different antisera against P1 antigen tested with hemagglutination test. Five samples each with the 3 genotypes P1P1(▴), P1P2(Δ), P2P2 (•) were tested with 2 monoclonal anti-P1 reagents [Immuclone (MAb1), Seraclone (MAb2)] and a polyclonal (PAb) anti-P1 goat antiserum as indicated on the x-axis. Agglutination reactions were visually graded between 0 and 4+ and registered on the y-axis.](https://ash.silverchair-cdn.com/ash/content_public/journal/blood/117/2/10.1182_blood-2010-08-301333/4/m_zh89991064180006.jpeg?Expires=1769538105&Signature=mMOUUg5sRMDPxNtkT~oKmL1Ldp1yOSuhlu3wDbXVMpHLSvJXwJzP7nQ3RGrbDa3tgvYhQvP8Rm8nXRb3F7-lMqeIcCZhx7GpGK9DE2az3Jd8djxrxbb-IOab9G0RuicdkM2rwGdpQYZt-ULJryHyun3LPsrq8o7zPt1937J7GUchYa8RVrgsmehOLYgkqVc7MqYvS7ZIO-PW8x67Zytu9ceQWbZO67rWanov6kAzK08dGAR-iJm9RlBcY-RXomlkubWAoIwuD2V0GDCV50DvVl7rivyOA3ZUxu7HnpM8t85l3s68TjjSmMO5qi44QEZhHJ7G-arnd8nkITHKus4Q7Q__&Key-Pair-Id=APKAIE5G5CRDK6RD3PGA)
