Abstract
Abstract 2617
National Cancer Institute (NCI)-funded cooperative oncology group trials have improved overall survival for children with cancer from 10% to 85%, and have set standards of care for adults with malignancies. However, the lack of data on resource utilization and treatment costs of patients on cooperative group trials is a critical limitation particularly in the present economic climate. To address this important knowledge gap, we merged data from the Children's Oncology Group (COG) AAML0531 Phase III trial for de novo acute myeloid leukemia (AML) and the Pediatric Health Information Systems (PHIS) data base to determine resource utilization and inpatient treatment costs for the overall trial and by treatment arm.
1022 eligible patients without trisomy-21 enrolled on AAML0531 were randomized to standard chemotherapy plus gemtuzumab (GMTZ) or standard chemotherapy (no GMTZ). Patients enrolled at 43 free standing pediatric hospitals in PHIS had COG and PHIS data merged by a probabilistic algorithm using center, ICD9 code for AML (205.xx), and date of birth. Once merged, resource utilization and cost data were analyzed for the first Induction chemotherapy course based on PHIS data. Cost data were estimated using standardized costs determined from a validated master costing index.
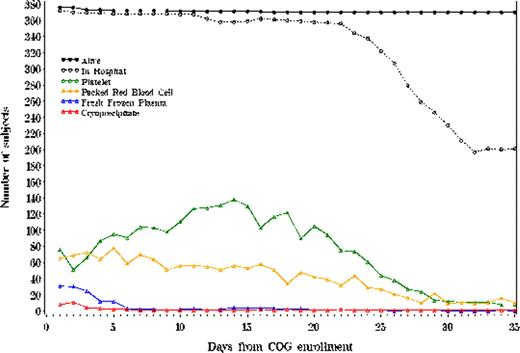
Of 416 patients enrolled on the Phase III COG trial at PHIS centers, 392 (94%) were successfully matched. Of the 392 matched patients, 378 (96%) had inpatient PHIS data available beginning at date of study enrollment and 259 (66%) had cost data available. Patients with and without available data did not differ in demographic characteristics. Daily blood product usage is illustrated in Figure 1. Patients receiving GMTZ required a significantly greater number of platelet transfusions per 100 hospital days (26.4 vs 22.1, p = 0.02), but fewer red cell transfusions (15.8 vs 19.2, p = 0.04). Hemostatic factor transfusions did not differ significantly between treatment arms. Table 1 presents mean number of antibiotic, antifungal and antiviral exposures per 100 hospital days. On average, patients received a total of 2.3 antibiotic and antifungal medication exposures for each hospital day during the first hospitalization. Antibiotic and antifungal use did not differ significantly by treatment arm. Median cost of Induction I did not differ by treatment arm: $98,324 (GMTZ) vs $93,846 (no GMTZ), p = 0.45. However, treatment costs increased significantly by age categories of 0–1, 1–9, 10–19, and greater than 19 years: $71,859, $87,171, $107,071, and $197,614, p = 0.0003. No cost differences by gender or race/ethnicity were observed.
To our knowledge, these are the first data demonstrating that patients enrolled on a NCI-funded cooperative group oncology trial can be identified in an administrative data set, and that the supportive care resources utilization and treatment cost data can be analyzed by treatment arm and other patient characteristics. For AAML0531, these data demonstrate a significant difference in platelet and red cell transfusions between study arms and a significantly increasing treatment costs by age category. Additional work is ongoing to include all treatment courses in the resource utilization and cost analyses, to determine the drivers of total hospital costs, and to correlate resource utilization with reported adverse events. Such data will provide investigators, clinicians, and others with accurate estimates of the changes in resources and costs needed to treat pediatric patients with GMTZ. Furthermore, this approach should be broadly applicable to other pediatric and adult cooperative group oncology trials.
Daily Blood Product Administration during the First Chemotherapy Course
Mean number of antibiotic, antiviral and antifungal exposure days per 100 hospital days during the first hospital admission for AML with 95% confidence intervals
| Administration Route . | Antibiotics . | Antifungals . | Antivirals . |
|---|---|---|---|
| Oral (PO) | 28.8 (26.5–31.2) | 41.0 (37.4–44.56) | 7.3 (5.1–9.6) |
| Intravenous (IV) | 134.1 (127.5–140.6) | 29.4 (26.0–32.9) | 5.9 (4.1–7.6) |
| Either PO or IV | 162.9 (156.0–169.8) | 70.4 (66.9–74.0) | 13.2 (10.2–16.2) |
Hall:CHCA: Employment. Bertoch:CHCA: Employment.
Author notes
Asterisk with author names denotes non-ASH members.


