Abstract
Chronic lymphocytic leukemia (CLL) demonstrates a global down-regulation of miR-15a and miR-16 and a selective silencing of the related miR-29b in aggressive disease. Deletions in chromosome 13 [del(13q14)] partially account for the loss of expression of miR-15a and miR-16, but the mechanisms by which miR-29b becomes silenced is unknown. In the present study, we show that the histone deacetylases (HDACs) are overexpressed in CLL and mediate the epigenetic silencing of miR-15a, miR-16, and miR-29b. HDAC inhibition triggered the accumulation of the transcriptionally activating chromatin modification H3K4me2 and restored the expression of miR-15a, miR-16, and miR-29b in approximately 35% of samples. Ectopic expression of miR-15a and miR-16 and HDAC inhibition–induced expression of miR-15a, miR-16, or miR-29b in primary CLL cells was associated with declines in the levels of Mcl-1, but not Bcl-2, mitochondrial dysfunction, and induction of cell death. Therefore, our results show that HDACs aberrantly silence the expression of the critical tumor suppressors miR-15a, miR-16, and miR-29b in CLL. Deacetylase inhibition may be a therapeutic strategy that restores the expression of these miRs to antagonize Mcl-1, an important survival protein in these cells. Consequently, CLL patients who exhibit such epigenetic silencing may benefit from HDAC inhibitor–based therapy.
Introduction
miRs are a class of endogenous noncoding RNAs 19-25 nucleotides in size that demonstrate altered expression profiles in most cancers.1 They regulate gene expression at the transcriptional or translational level1,2 to function either as tumor suppressors or oncogenes depending on both the cellular context and the targets repressed within any given cell type.1 At present, more than 1000 miRs have been identified in chronic lymphocytic leukemia (CLL).3,4
CLL is a disease caused by the clonal accumulation of neoplastic B cells that display impaired apoptosis. Low levels of expression of several miRs have been functionally linked to the apoptotic resistance that is characteristic of CLL.5 For example, losses in miR-15a and miR-165,6 or miR-29b7 are associated with high levels of expression of Bcl-25 and Mcl-1.6,8 Bcl-2 and Mcl-1 function by sequestering proapoptotic members of the Bcl-2 family so as to prevent mitochondrial dysfunction and cell death.9 Pro-apoptotic and anti-apoptotic signals appear to converge on Mcl-1 in CLL, suggesting a critical role for this protein in regulating survival in this disease.9,10 High levels of Bcl-2 and Mcl-1 or failure to decrease Mcl-1 levels is associated with poor responses to chemotherapy, disease progression, and inferior survival in CLL.11,12
Loss of the tumor suppressors miR-15a and miR-16 leads to the spontaneous generation of CLL in mice.13,14 Ectopic expression of miR-15a and miR-16 targets Bcl-25 and Mcl-1,6 induces apoptosis in certain cell lines,5 and suppresses tumorigenesis in xenograft leukemia6 and solid-tumor models.15 miR-15a and miR-16 are located on an intron of the dleu2 gene at the 13q14 locus and are coordinately expressed with their host gene.16 Deletions in chromosome 13 [del(13q14)] occur commonly in CLL, involve the loss of a single (> 50% samples) or both alleles (24%),13 and result in genomic losses centered around the miR-15a and miR-16 locus.17 However, many samples express low levels of these miRs despite a lack of observable deletions in 13q.18 In addition, mature miR-16 is also derived from the miR-15a-16-2 located on an intron of the SMC4 gene on chromosome 3q26.19 However, smc4 is also expressed at low levels in CLL.19 These findings suggest the existence of additional regulatory mechanisms that might function in conjunction with del(13q14) to mediate the silencing of miR-15a and miR-16 in CLL.
miR-29b functions as a tumor suppressor in CLL and other tumor types because of its ability to target Mcl-1,8 SP1,20 DNMT3a and DNMTb,21 Tcl-1,22 and Cdk6.23 The expression of miR-29b was found to be selectively down-regulated in aggressive CLL by unknown mechanisms and also to be associated with a poor prognosis.7 Paradoxically, the expression of miR-29b was reported to be high in indolent CLL compared with B lymphocytes and miR-29–transgenic mice develop an indolent form of leukemia.24
The histone deacetylases (HDACs) are chromatin-modulating enzymes that catalyze the removal of acetyl groups on specific lysines around gene promoters to trigger the demethylation of lysine 4 on histones (H3K4me2/3). Loss of these activating marks promotes chromatin compaction, prevents access to transcription factors, and leads to epigenetic gene silencing.25 The importance of HDACs in the pathology of CLL is suggested by results obtained with a variety of a small-molecule inhibitors of HDACs such as panobinostat (LBH589), vorinostat (SAHA), and romidepsin (MS275) that effectively kill CLL cells26-30 ex vivo. However, initial clinical trials with early-generation HDAC inhibitors in high-risk patients showed limited activity.31,32 A recent study showed that damage to the mitochondria was a key requirement for the therapeutic activity of HDAC inhibitors such as LBH589.33
The results of the present study demonstrate that HDACs mediate the epigenetic silencing of miR-15a, miR-16, and miR-29b in one-third of all CLL patients to constitute an independent mechanism that facilitates the pathobiology of CLL. Silencing of miR-15a and miR-16 may cooperate with del(13q14) to account for the disproportionately low levels of miR-15a and miR-16 in CLL. Induction of miR-15a, miR-16, and miR-29b in response to HDAC inhibition is associated with decreases in the levels of the survival protein Mcl-1, loss of mitochondrial function, and activation of cell death.
Methods
Patient samples and controls
Sixty samples from patients with CLL and 9 samples from normal donors were obtained after informed consent at the M D Anderson Cancer Center in accordance with the Declaration of Helsinki. All experiments were approved by the M. D. Anderson Cancer Center institutional review board. Lymphocytes were isolated through Ficoll-Hypaque gradient centrifugation (Amersham Pharmacia Biotech) and processed for cell culture, ChIP, RNA extraction, protein lysates, and determination of cell death (annexin positivity). Mononuclear cells purified from whole blood obtained from normal donors were either used directly or further purified into the CD19+ fraction using the EasySep negative selection B-cell enrichment kit (StemCell Technologies). Clinical data such as FISH cytogenetics, ZAP70 kinase, and heavy chain mutation status were available for most patients in the study.
Cell culture and chemicals
Primary CLL cells were maintained in RPMI 1640 medium. Panobinostat (LBH589) was provided by Novartis. MS-275 and SAHA were purchased from Axxora and Cayman Chemical. All reagents were dissolved in 100% DMSO (Burdick & Jackson) to a stock concentration of 10−2 M and stored at −80°C. Primary CLL cells were treated with 10nM LBH589, 3μM SAHA, or MS275 for the indicated times.
Western blotting
Immunoblotting was performed with Abs against HDAC1, HDAC2, and HDAC3 (Abcam), H3AcK9/14 and GAPDH (Millipore), Mcl-1 and Bcl-2 (Santa Cruz Biotechnology), and cleaved caspase-3 (Cell Signaling Technologies). Bcl-2 and Mcl-1 were quantitated using the densitometry function on the Odyssey infrared imager (LICOR), normalized to GAPDH within the same sample, and expressed as a percentage of control.
Real-time PCR
Total RNA was extracted from cells using the mir-Vana RNA extraction kit (Applied Biosystems). The relative quantities of miR-15a, miR-16, and miR-29b were measured on 5 ng of total RNA by quantitative RT-PCR using the mir-Vana reverse transcription kit, followed by quantitative PCR using primer-probes in the Prism 7700 Sequence Detection System (Applied Biosystems), and determined by the comparative CT method using snRNA RNU6B levels for normalization. Primers for evaluating the expression of dleu2 and Smc4 were purchased from Applied Biosystems and their relative expression was calculated after normalization to the expression of GAPDH used as a loading control in the same samples.
ChIP assays linked to promoter arrays or quantitative RT-PCR
Equal amounts of cross-linked chromatin from CLL cells were used to carry out ChIP directed against H3K4me2 or rabbit IgG used as a nonspecific control (Jackson ImmunoResearch Laboratories).34 DNA eluted from immunoprecipitates were purified using QIA-Quick columns (QIAGEN) and dissolved in 50 μL of water. Standard PCR reactions using 3 μL of the immunoprecipitated DNA were performed with primer sequences specific for the miR-15a-16 and miR-29b promoter. In other experiments, chromatin from CLL samples with del(13q14) was harvested before and after HDAC inhibition and immunoprecipitated with Abs against H3K4me2, total HH3 (Abcam), or IgG (Jackson ImmunoResearch Laboratories). The DNA eluted was amplified using the whole-genome amplification kit (Sigma-Aldrich), labeled with Cy3 (H3K4me2) and Cy5 (total H3), and hybridized to a custom array from Nimblegen tiled with probes 200 bp apart and spanning10 kb upstream and 5 kb downstream of the transcription start site for all miR promoters. The data were visualized on the University of California–Santa Cruz genome browser.
miR overexpression
Pre-miR precursor molecules miR-15a and miR-16-1 and pre-miR precursor molecule negative control #1 were obtained from Ambion. All miRs were transfected at 300nM using the Amaxa nucleofector and the cell line nucleofector kit V, program U1335 into primary leukemia cells (5 × 10⁶/nucleofection) for 48 hours, after which cells were harvested for RNA and protein analysis. In standardization experiments, the transfection efficiency ranged between 41% and 50% based on the uptake of the fluorescent transfection indicator siGLO (Dharmacon) (data not shown).
Apoptosis assays
Primary CLL cells (1 × 10⁶) were incubated with 25nM tetramethylrhodamine, methyl ester, perchlorate (Invitrogen) and annexin V–FITC (BD Biosciences) for 15 minutes. Fluorescence of at least 10 000 cells was determined on a FACSCalibur flow cytometer (BD Biosciences) to determine the mitochondrial membrane potential and percentage of apoptotic cells within the same population.
Results
miR-15a and miR-16 are expressed at low levels in CLL
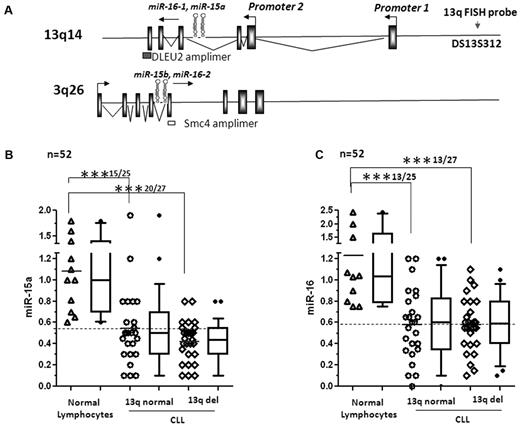
Samples were classified based on their del(13q14) status (Table 1). Additional clinical characteristics such as the presence of chromosomal aberrations at 11q, 17p, and trisomy 12 as detected by FISH, ZAP70 kinase, and heavy chain variable region status are also listed (Table 1). The genomic organization of miR-15a, miR-16-1, miR-15b, miR-16-2, and their host genes dleu2 and smc4 are shown in Figure 1A. We quantitated the expression of miR-15a and miR-16 in 52 CLL samples categorized according to their del(13q14) status, and in healthy lymphocytes (both total mononuclear lymphocytes and CD19+ purified B cells) using real-time RT-PCR. miR-15a was well expressed in both CD19+ (range 0.6-1.4, n = 6) and total lymphocytes (range 1.0-1.8, n = 5) with an average expression of 1.1 ± 0.4. Samples with a relative decrease of 60% or greater compared with the average expression in normal samples were taken to underexpress miR-15a. By these criteria, miR-15a was underexpressed in 15 of 25 (60%) samples with normal 13q14 status (P < .001) and in 20 of 27 (73%) samples with del(13q14)14 (P < .001; Figure 1B). Similarly, the levels of miR-16 were expressed at an average level of 1.2 ± 0.6 (n = 11, range 0.75-2 in CD19+ B cells and 1-2.4 in total lymphocytes). In comparison, the levels of miR-16 were low in 13 of 25 (52%) and 13 of 27 (48%) samples (P < .001; Figure 1C). The median levels of expression of miR-15a and miR-16, SD, and percentiles (10-90) are represented by box and whisker plots beside the dot plots for each category (Figure 1B-C). Pairwise comparison of the levels of miR-15a and miR-16 within the same CLL samples indicated that the level of mature miR-15a was lower than that of miR-16 in most samples (data not shown). We then evaluated whether levels of expression of miR-15a and miR-16 differed in CLL samples that expressed clinical markers associated with adverse prognosis and found that the expression of miR-15a and miR-16 were unaffected by ZAP70 kinase status (supplemental Figures 1A and 2A, available on the Blood Web site; see Supplemental Materials link at the top of the online article), Ig heavy-chain variable region mutation status (supplemental Figures 1B and 2B), or cytogenetic FISH subtypes (FISH normal, del11q, +12, and del17p) other than del(13q14) (supplemental Figures 1C and 2C).
Expression of mir-15a and miR-16 in 13q intact and 13q−CLL. (A) Structure of dleu2-miR-15a-16-1 and smc4-miR-15b-16-2 genes. (B) Levels of miR-15a as measured by quantitative RT-PCR and normalized to the levels of RNU6B used as a loading control in lymphocytes (total and CD19+ B cells) from normal donors and 13q+ or 13q− CLL. The data were then expressed as a percentage of the values obtained for one arbitrarily chosen normal set at 1. Each column on the graph is a composite of dot plots showing the actual expression values of miR-15a and a box and whisker plot representing the 90% confidence interval. Statistical analysis was conducted using ANOVA; mean expression of miR-15a was significantly different between normal lymphocytes compared with 13q normal and 13q− CLL (***P < .001), but was not significant between the 2 groups (13q normal vs 13q−) of CLL. (C) Levels of miR-16 as measured by quantitative RT-PCR and normalized to the levels of RNU6B used as a loading control in lymphocytes (total and CD19+ B cells) from normal donors and 13q+ or 13q− CLL. The data were then expressed as a percentage of the values obtained for one arbitrarily chosen normal set at 1. Each column on the graph is a composite of dot plots showing the actual expression values of miR-6 and a box and whisker plot representing the 90% confidence interval. Statistical analysis was conducted using ANOVA; mean expression of miR-6 was significantly different between normal lymphocytes and 13q normal and 13q− CLL lymphocytes (***P < .001), but was not significant between the 2 groups (13q normal vs 13q−) of CLL.
Expression of mir-15a and miR-16 in 13q intact and 13q−CLL. (A) Structure of dleu2-miR-15a-16-1 and smc4-miR-15b-16-2 genes. (B) Levels of miR-15a as measured by quantitative RT-PCR and normalized to the levels of RNU6B used as a loading control in lymphocytes (total and CD19+ B cells) from normal donors and 13q+ or 13q− CLL. The data were then expressed as a percentage of the values obtained for one arbitrarily chosen normal set at 1. Each column on the graph is a composite of dot plots showing the actual expression values of miR-15a and a box and whisker plot representing the 90% confidence interval. Statistical analysis was conducted using ANOVA; mean expression of miR-15a was significantly different between normal lymphocytes compared with 13q normal and 13q− CLL (***P < .001), but was not significant between the 2 groups (13q normal vs 13q−) of CLL. (C) Levels of miR-16 as measured by quantitative RT-PCR and normalized to the levels of RNU6B used as a loading control in lymphocytes (total and CD19+ B cells) from normal donors and 13q+ or 13q− CLL. The data were then expressed as a percentage of the values obtained for one arbitrarily chosen normal set at 1. Each column on the graph is a composite of dot plots showing the actual expression values of miR-6 and a box and whisker plot representing the 90% confidence interval. Statistical analysis was conducted using ANOVA; mean expression of miR-6 was significantly different between normal lymphocytes and 13q normal and 13q− CLL lymphocytes (***P < .001), but was not significant between the 2 groups (13q normal vs 13q−) of CLL.
HDACs mediate the repression of miR-15a and miR-16 in CLL
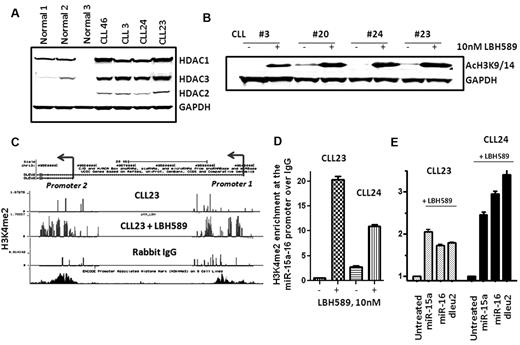
Because several samples displayed low levels of miR-15a and miR-16 without evidence of gene deletions on 13q, we evaluated the role of epigenetic mechanisms—specifically, those mediated by the HDACs—in silencing the expression of these miRs. As a first step, we evaluated the expression of HDAC1-3 in CLL and normal lymphocytes and showed that HDAC1, HDAC2, and HDAC3 are overexpressed in CLL lymphocytes compared with normal lymphocytes (Figure 2A). Higher expression of HDACs may be functionally related to enhanced HDAC activity and aberrant silencing of target genes in CLL.
HDAC expression in CLL and consequences of HDAC inhibition on chromatin marks at the miR-15a and miR-16 genes. (A) Expression of HDAC1-3 in CLL and normal lymphocytes. (B) Increased acetylation of histone H3 (H3K9/14) in CLL samples exposed to 10nM LBH589. (C-D) Increased levels of the H3K4me2 modification at the dleu2-miR-15a-16 promoter in CLL samples after exposure to 10nM LBH589 for 5 hours. (E) Induction of miR-15a and miR-16 in the same CLL samples after exposure to 10nM LBH589 for 5 hours.
HDAC expression in CLL and consequences of HDAC inhibition on chromatin marks at the miR-15a and miR-16 genes. (A) Expression of HDAC1-3 in CLL and normal lymphocytes. (B) Increased acetylation of histone H3 (H3K9/14) in CLL samples exposed to 10nM LBH589. (C-D) Increased levels of the H3K4me2 modification at the dleu2-miR-15a-16 promoter in CLL samples after exposure to 10nM LBH589 for 5 hours. (E) Induction of miR-15a and miR-16 in the same CLL samples after exposure to 10nM LBH589 for 5 hours.
HDAC-mediated gene repression is linked to low levels of acetylation on histones (H3K9Ac) and low levels of trimethylation on lysine 4 on histones (H3K4me2), a chromatin modification required for active transcription.36 Conversely, HDAC inhibition is likely to promote acetylation on H3K9/14Ac, which in turn triggers the accumulation of H3K4me2 around target gene promoters to restore gene expression.36 Cellular lysates from untreated CLL samples displayed low levels of H3K9/14Ac, which increased after deacetylase inhibition for 5 hours (Figure 2B). Next, the levels of H3K4me2 were determined at the promoters for the dleu2–miR-15a-16 and smc4–miR-15b-16 genes. Ten CLL samples were subjected to ChIP assays for H3K4me2 and evaluated on promoter arrays (CHIP) that contained sequences for the dleu2-miR-15a-16 and smc4–miR15b-16 promoters before and after HDAC inhibition with LBH589 for 5 hours. The levels of H3K4me2 were sparse at the dleu2–miR-15a-16 promoter in all CLL samples and in the nonspecific IgG control; data from one representative sample are shown (Figure 2C CLL23 and rabbit IgG). HDAC inhibition in these CLL samples resulted in the robust accumulation of H3K4me2 at both promoters for the dleu2–miR-15a-16 gene in 3 of 10 samples (30%); the data from CLL23 after LBH589 exposure is shown (Figure 2C CLL23 + LBH589). To confirm the results of the ChIP-CHIP experiments, we performed individual ChIP assays for all 3 samples that displayed accumulation of H3K4me2 after HDAC inhibition. Each of these samples demonstrated a 10- to 20-fold increase in the levels of H3K4me2 at the dleu2–miR-15a-16 promoter (quantitated results from 2 samples are shown in Figure 2D). Correspondingly, accumulation of H3K4me2 was followed by a transcriptional induction in the levels of miR-15a and miR-16 in conjunction with their host gene dleu2 in both CLL samples (Figure 2E). In contrast, although 4 of 10 samples accumulated H3K4me2 modifications at the smc4–miR-15b-16-2 promoter after HDAC inhibition, this was not accompanied by increases in the expression of smc4 (data not shown).
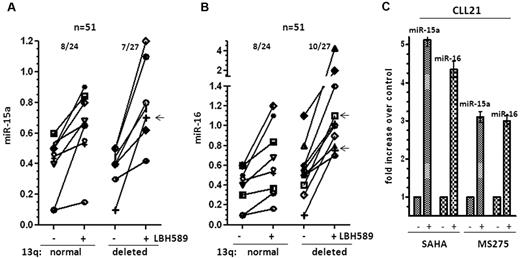
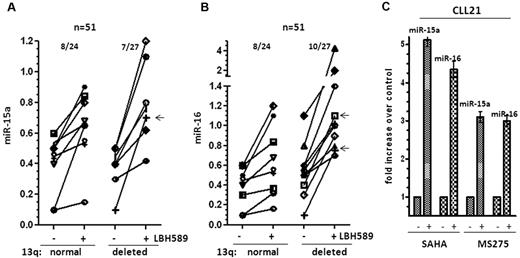
To determine the overall incidence of HDAC-mediated silencing of miR-15a and miR-16 in CLL, we determined the expression of these miRs before and after HDAC inhibition. In our cohort, 25 of 52 samples had normal 13q status, 10 of 52 samples had del(13q14) as the sole genetic abnormality, and 17 of 52 samples had del(13q14) in addition to other cytogenetic abnormalities. Deacetylase inhibition restored the expression of miR-15a and miR-16 in 8 of 24 (33%) evaluable samples with normal 13q. In the del(13q14) cohort, 7 of 27 (25%) samples induced miR-15a, of which 1 sample displayed del(13q14) as the sole genetic abnormality and 6 others had monoallelic losses in del(13q14) in addition to other cytogenetic abnormalities. Similarly, 10 of 27 (37%) samples induced miR-16, of which 2 samples displayed del(13q14) as the sole genetic abnormality and 8 others had monoallelic losses in del(13q14) in addition to other cytogenetic abnormalities to achieve an overall induction of miR-15a in 15 of 51 samples (30%) and miR-16 in 18 of 51 samples (32%; Figure 3A-B).
Induction of mir-15a and miR-16 in 13q+and 13q−CLL on HDAC inhibition. (A) Increase in miR-15a expression in 13q+ and 13q− CLL samples after exposure to 10nM LBH589 for 3-6 hours. The -fold increase after exposure to LBH589 was calculated and then represented as the increase in expression over levels of expression (as determined in Figure 1B) in untreated cells. The arrow (←) marks samples with del13q as the sole abnormality that induced miR-15a. (B) Increase in miR-16 in 13q+ and 13q− CLL samples after exposure to 10nM LBH589. The -fold increase after exposure to LBH589 was calculated and is represented as the change in expression over levels of expression (as determined in Figure 1C) in untreated cells. The arrows (←) mark samples with del13q as the sole abnormality that induced miR-16 (C) Induction of miR-15a and miR-16 in a CLL sample after exposure to the HDAC inhibitors SAHA (3μM) and MS275 (3μM) for 3-6 hours.
Induction of mir-15a and miR-16 in 13q+and 13q−CLL on HDAC inhibition. (A) Increase in miR-15a expression in 13q+ and 13q− CLL samples after exposure to 10nM LBH589 for 3-6 hours. The -fold increase after exposure to LBH589 was calculated and then represented as the increase in expression over levels of expression (as determined in Figure 1B) in untreated cells. The arrow (←) marks samples with del13q as the sole abnormality that induced miR-15a. (B) Increase in miR-16 in 13q+ and 13q− CLL samples after exposure to 10nM LBH589. The -fold increase after exposure to LBH589 was calculated and is represented as the change in expression over levels of expression (as determined in Figure 1C) in untreated cells. The arrows (←) mark samples with del13q as the sole abnormality that induced miR-16 (C) Induction of miR-15a and miR-16 in a CLL sample after exposure to the HDAC inhibitors SAHA (3μM) and MS275 (3μM) for 3-6 hours.
Because miR-15a and miR-16 are transcribed in conjunction with their host genes dleu2 and smc4, we evaluated the expression of these host transcripts in response to LBH589 for 3-6 hours in 12 CLL samples, and demonstrated that the levels of miR-15a and miR-16 were induced in conjunction with the dleu2 gene in most (8-9 of 12) samples evaluated, whereas only 2 of 12 samples demonstrated an increase in the levels of miR-16 in conjunction with the Smc4 transcript (Table 2), suggesting that the HDAC-driven silencing of dleu2 is largely responsible for the epigenetic loss of expression of miR-15a and miR-16 in CLL. One sample demonstrated increases in miR-15a and miR-16 without observable increases in either dleu2 or Smc4 (Table 2).
Finally, the action of the related HDAC inhibitors vorinostat (SAHA) and romidepsin (MS275) on the expression of miR-15a and miR-16 was evaluated. Exposure to either 3μM SAHA or 3μM MS275 elicited both histone acetylation and transcriptional reactivation of miR-15a and miR-16 within 3-6 hours in CLL cells (Figure 3C), indicating that reversal of epigenetic silencing of miR-15a and miR-16 is an action shared by multiple members of this class of therapeutic agents.
Expression and HDAC-mediated silencing of miR-29b in CLL
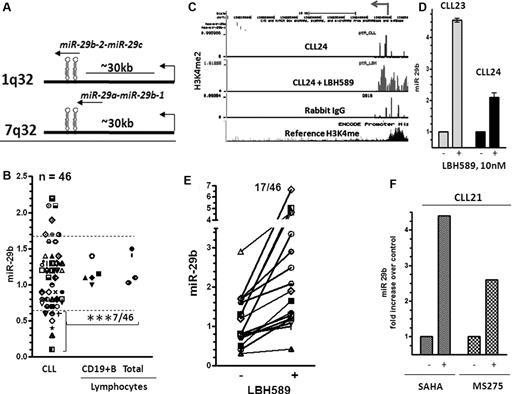
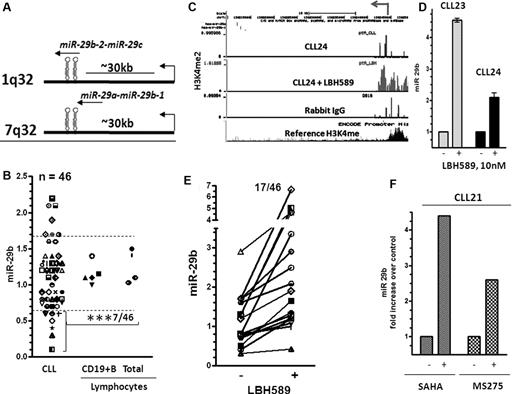
miR-29b is an intergenic miR that is transcribed in conjunction with miR-29a from chromosome 7 and miR-29c from chromosome 1 (Figure 4A). A seminal report indicated that miR-29b become selectively down-regulated in aggressive CLL,37 whereas another report found that the levels of miR-29b were elevated by 3- to 4-fold in CLL.24 To address this, we compared the levels of miR-29b expression in 46 CLL and 9 normal lymphocytes (mononuclear cells and CD19+ B cells). Of these, only 7 of 46 samples (15%) expressed levels that were higher, 32 of 46 samples (70%) expressed levels equivalent to, and 7 of 46 samples (15%) demonstrated a 50% or greater reduction in the expression of miR-29b compared with the levels in normal lymphocytes (n = 9) (n = 5 for CD19+ B cells n = 4 for total lymphocytes, P < .001, Figure 4B). The levels of miR-29b were lower in samples that expressed ZAP70 kinase, but this difference was not statistically significant (supplemental Figure 3A). Similarly, levels of miR-29b did not differ significantly in mutated versus unmutated samples or in different cytogenetic groups (supplemental Figure 3B and C).
Structure, expression,and induction of miR-29b in response to HDAC inhibition in CLL. (A) Structure of miR-29a-b and miR-29b-c genes. (B) Levels of miR-29b as measured by quantitative RT-PCR and normalized to the levels of RNU6B used as a loading control in lymphocytes (total and CD19+ B cells) from normal donors and 46 CLL samples. The data were then expressed as a percentage of the values obtained for one arbitrarily chosen normal set at 1. Statistical analysis was conducted using ANOVA; mean values of miR-29b was significantly different between normal lymphocytes and CLL lymphocytes that showed a 60% or greater decrease in expression (***P < .001). (C) Increase in the levels of the H3K4me2 modification at the miR-29b promoter in a representative CLL sample after exposure to 10nM LBH589 for 5 hours. (D) Induction of miR-29b in the same CLL samples after exposure to 10nM LBH589 for 5 hours. The -fold increase after exposure to LBH589 was calculated and is represented as increase in levels of expression (as determined in Figure 4B) over that in untreated cells. (E) Induction of miR-29b in 46 CLL samples on HDAC inhibition. (F) Induction of miR-15a and miR-16 in a CLL sample after exposure to the HDAC inhibitors SAHA (3μM) and MS275 (3μM) for 3-6 hours.
Structure, expression,and induction of miR-29b in response to HDAC inhibition in CLL. (A) Structure of miR-29a-b and miR-29b-c genes. (B) Levels of miR-29b as measured by quantitative RT-PCR and normalized to the levels of RNU6B used as a loading control in lymphocytes (total and CD19+ B cells) from normal donors and 46 CLL samples. The data were then expressed as a percentage of the values obtained for one arbitrarily chosen normal set at 1. Statistical analysis was conducted using ANOVA; mean values of miR-29b was significantly different between normal lymphocytes and CLL lymphocytes that showed a 60% or greater decrease in expression (***P < .001). (C) Increase in the levels of the H3K4me2 modification at the miR-29b promoter in a representative CLL sample after exposure to 10nM LBH589 for 5 hours. (D) Induction of miR-29b in the same CLL samples after exposure to 10nM LBH589 for 5 hours. The -fold increase after exposure to LBH589 was calculated and is represented as increase in levels of expression (as determined in Figure 4B) over that in untreated cells. (E) Induction of miR-29b in 46 CLL samples on HDAC inhibition. (F) Induction of miR-15a and miR-16 in a CLL sample after exposure to the HDAC inhibitors SAHA (3μM) and MS275 (3μM) for 3-6 hours.
To determine whether HDACs play a role in silencing miR-29b, we exposed primary cells to 10nM LBH589 and conducted ChIP-CHIP assays to determine the levels of H3K4me2 at the miR-29b promoter. The levels of H3K4me2 were sparse at this promoter in all CLL samples and in the nonspecific IgG control (data from one representative sample are shown in Figure 4C CLL24 and rabbit IgG). HDAC inhibition in these CLL samples resulted in the robust accumulation of H3K4me2 at the miR-29b promoter in 5 of 10 samples (Figure 4C CLL24 + LBH589; 50%) and in the transcriptional reexpression of the cognate miR, as shown in 2 samples (Figure 4D). We then determined that HDAC inhibition restored the expression of miR-29b in 17 of 46 CLL samples (37%; Figure 4E). Again, as in the case of miR-15a and miR-16, levels of miR-29b were induced within 3 hours of exposure to other classes of HDAC inhibitors such as SAHA and MS275 (Figure 4F).
Action of miR-15a and miR-16 on Mcl-1 and Bcl-2 in primary CLL cells
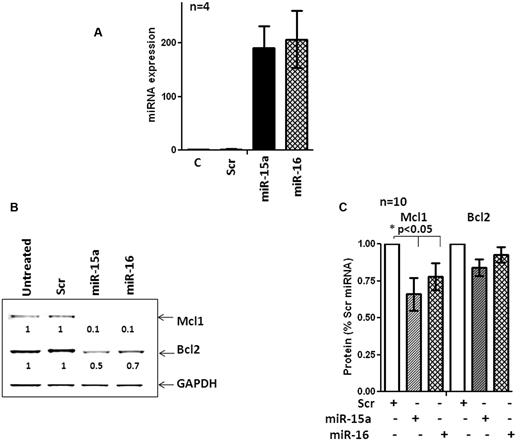
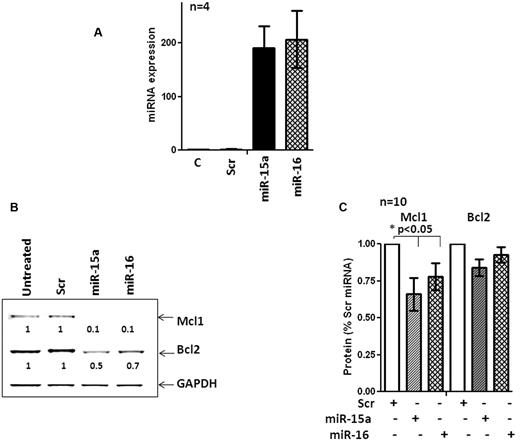
The interactions between miRs and their cognate targets within cells are profoundly influenced by cellular context.38-40 Therefore, miRs that target a mRNA in a given cell type may target entirely different mRNAs in another type.39,40 Mcl-1 and Bcl-2 were identified as the targets of miR-15a and miR-16 in a megakaryocytic cell line that lacked miR-15a and miR-16.5,6 However, direct evidence evaluating the ability of miR-15a and miR-16 to target Bcl-2 and Mcl-1 in primary CLL cells was lacking. Therefore, we used nucleofection to ectopically express miR-15a, miR-16, and a nontargeting miR in 10 primary CLL samples. The efficiency of nucleofection was approximately 41%-54% (not shown) and resulted in the robust expression of miR-15a and miR-16 in nucleofected cells (Figure 5A). Overexpression of miR-15a and miR-16 caused a steep decline in the levels of Mcl-1 and Bcl-2 in one CLL sample (Figure 5B). In 9 additional samples, Mcl-1 levels were reduced, albeit to various extents (P < .05 by 1-way ANOVA), whereas levels of Bcl-2 protein were not decreased consistently (Figure 5C; n = 10). Overexpression of miR-15a and miR-16 reduced the levels of Mcl-1 but not Bcl-2 in primary CLL cells.
miR-15a and miR-16 target Mcl1 but not Bcl-2 in primary CLL cells. (A) Expression of miR-15a and miR-16 in a CLL sample after nucleofection for 48 hours. (B) Levels of Mcl-1 and Bcl-2 in a CLL sample after nucleofection with miR-15a, miR-16, or a scrambled nontargeting control (Scr) miR for 48 hours. (C) Quantitation of the levels of Mcl-1 and Bcl-2 in 10 primary CLL samples after nucleofection with miR-15a, miR-16, or a Scr miR for 48 hours. Statistical significance of the decrease of Mcl-1 and Bcl-2 levels was determined by 1-way ANOVA.
miR-15a and miR-16 target Mcl1 but not Bcl-2 in primary CLL cells. (A) Expression of miR-15a and miR-16 in a CLL sample after nucleofection for 48 hours. (B) Levels of Mcl-1 and Bcl-2 in a CLL sample after nucleofection with miR-15a, miR-16, or a scrambled nontargeting control (Scr) miR for 48 hours. (C) Quantitation of the levels of Mcl-1 and Bcl-2 in 10 primary CLL samples after nucleofection with miR-15a, miR-16, or a Scr miR for 48 hours. Statistical significance of the decrease of Mcl-1 and Bcl-2 levels was determined by 1-way ANOVA.
Relationship of LBH-induced increases in miR-15a and miR-16 to the cellular levels of Mcl-1 and Bcl-2 in primary CLL
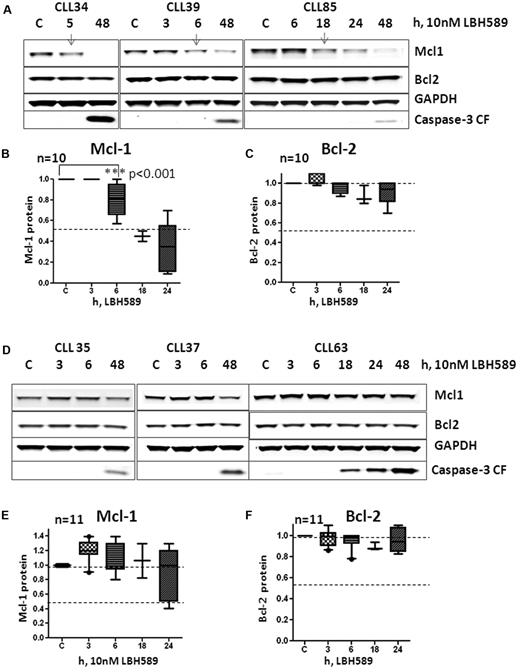
Although miR-15a and miR-16 target Mcl-1 or Bcl-2 under conditions of ectopic expression and miR-29b targets Mcl-1 in a variety of cell lines, tumor models, and in primary leukemia cells, data evaluating the relationship between the HDAC inhibition–induced increase in miR-15a and miR-16 or miR-29b expression and loss of Mcl-1and Bcl-2 are lacking. Therefore, CLL samples (n = 21) were exposed to LBH589 and evaluated for their ability to induce miR-15a, miR-16, and miR-29b and for the levels of Mcl-1 and Bcl-2. Ten of 21 samples responded to LBH589 exposure by inducing the expression of miR-16 in all samples within 3 hours, and of miR-29b in all but 1 sample. miR-15a, however, was induced in only 6 of the 10 samples. In Figure 6A, we show 3 representative samples that induced miR-16 to 1.4-fold (CLL#34), 5-fold (CLL#39), and 2-fold (CLL#85); miR-15a to 1.5-fold (CLL#34) and 2-fold (CLL#85); and miR-29b to 1.5-fold (CLL#34), 2-fold (CLL#39), and 1.5-fold (CLL#85) over untreated cells. In these samples, the levels of Mcl-1 declined (Figure 6A top panel and 6B Mcl-1 quantitation, 0-6 hours; P < .05, 2 tailed t test) before the activation of caspase-3 compared with cells that did not induce miR-15a and miR-16. However, the levels of Bcl-2 did not decrease significantly (Figure 6C). Conversely, samples that did not activate miR expression in response to LBH589 (n = 11) maintained or increased Mcl-1 and Bcl-2 levels at these times (Figure 6D-F).
Relation between induction of miR-15a, miR-16, miR-29b,and decrease of Mcl-1 and Bcl-2 in response to 10nM LBH589 in CLL cells. (A) Levels of Mcl-1, Bcl-2, GAPDH, and cleaved caspase-3 at 3, 6, 18, or 24 hours in 3 CLL samples that activated miR-15a, miR-16, or miR-29b in response to 10nM LBH589. (B) Quantitation of Mcl-1 levels at various times (up to 48 hours) in 9 CLL samples that activated miR-15a, miR-16, or miR-29b in response to 10nM LBH589. (C) Quantitation of Bcl-2 levels at various times (up to 48 hours) in 9 CLL samples that activated miR-15a, miR-16, or miR-29b in response to 10nM LBH589. (D) Levels of Mcl-1, Bcl-2, GAPDH, and cleaved caspase-3 at 3, 6, 18, or 24 hours in 3 CLL samples that did not activate miR-15a, miR-16, or miR-29b in response to 10nM LBH589. (E) Quantitation of Mcl-1 levels at various times (up to 48 hours) in 11 CLL samples that did not activate miR-15a, miR-16, or miR-29b in response to 10nM LBH589. (F) Quantitation of Bcl-2 levels at various times (up to 48 hours) in 11 CLL samples that did not activate miR-15a, miR-16, or miR-29b in response to 10nM LBH589.
Relation between induction of miR-15a, miR-16, miR-29b,and decrease of Mcl-1 and Bcl-2 in response to 10nM LBH589 in CLL cells. (A) Levels of Mcl-1, Bcl-2, GAPDH, and cleaved caspase-3 at 3, 6, 18, or 24 hours in 3 CLL samples that activated miR-15a, miR-16, or miR-29b in response to 10nM LBH589. (B) Quantitation of Mcl-1 levels at various times (up to 48 hours) in 9 CLL samples that activated miR-15a, miR-16, or miR-29b in response to 10nM LBH589. (C) Quantitation of Bcl-2 levels at various times (up to 48 hours) in 9 CLL samples that activated miR-15a, miR-16, or miR-29b in response to 10nM LBH589. (D) Levels of Mcl-1, Bcl-2, GAPDH, and cleaved caspase-3 at 3, 6, 18, or 24 hours in 3 CLL samples that did not activate miR-15a, miR-16, or miR-29b in response to 10nM LBH589. (E) Quantitation of Mcl-1 levels at various times (up to 48 hours) in 11 CLL samples that did not activate miR-15a, miR-16, or miR-29b in response to 10nM LBH589. (F) Quantitation of Bcl-2 levels at various times (up to 48 hours) in 11 CLL samples that did not activate miR-15a, miR-16, or miR-29b in response to 10nM LBH589.
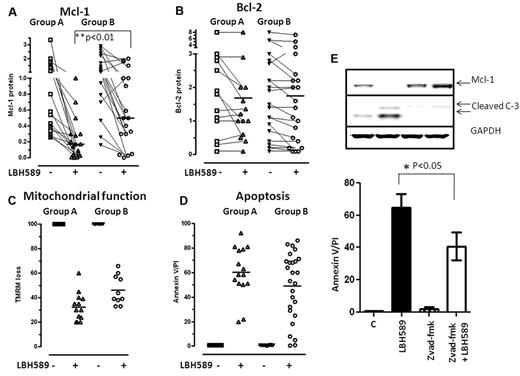
Because exposure of cells to HDAC inhibitors has also been shown in CLL and other tumors to activate caspase-3,41 which cleaves both Bcl-2 and Mcl-1,42 we evaluated the appearance of processed caspase-3 at various times after LBH589 exposure. Cleaved caspase-3 became evident after 18-24 hours of exposure to LBH589 and was associated with declines in the levels of full-length Mcl-1 in all CLL samples, whereas the levels of Bcl-2 remained constant (Figure 6). When the relationship among miR induction, processed caspase-3, and Mcl-1 and Bcl-2 levels was evaluated in a larger cohort of samples that were either left untreated or exposed to LBH589 for 48 hours (n = 35), we found that the levels of Mcl-1 (Figure 7A) were significantly lower in samples that activated both Mcl-1–targeting miR and caspase-3 (group A) compared with those that activated caspase-3 alone (group B; P < .01, 2 tailed unpaired t test; Figure 7A), whereas the levels of Bcl-2 remained largely unchanged for up to 48 hours of exposure to LBH589 in both groups of samples (Figure 7B). In addition, the LBH589-induced decreases in Mcl-1 were temporally associated with loss of mitochondrial membrane potential (Figure 7C) and induction of apoptosis in primary CLL cells (Figure 7D), suggesting that decreases in the levels of this prosurvival protein were sufficient to induce cell death in CLL cells independently of Bcl-2. Because declines in Mcl-1 occurred in all CLL samples after the activation of caspase-3, we evaluated whether blocking caspase-3 activation would preserve Mcl-1 protein and attenuate the ability of LBH589 to induce apoptosis in CLL cells. We exposed CLL cells (n = 4) to 10μM z-vad-fmk, a pan caspase inhibitor, for 3 hours before exposing them to LBH589 for 48 hours. Our data indicate that the appearance of processed caspase-3 was evident in cells exposed to LBH589 for 48 hours, but pretreatment with z-vad-fmk not only prevented the appearance of active caspase-3, but also preserved the levels of Mcl-1 protein (Figure 7E top panel). These samples did not activate the miR pathway that targets Mcl-1. Blocking the action of caspases was associated with a partial decrease in the ability of LBH589 to induce cell death (P < .05 by paired t test, n = 4; Figure 7E graph).
Action of 10nM LBH589 on Mcl-1, Bcl-2, mitochondrial membrane depolarization and apotosis in CLL cells. Change in Mcl-1 (A), Bcl-2 (B), and mitochondrial membrane depolarization as measured by loss of the mitochondrial dye TMRM (C) and increase in annexin V/propidium iodide positivity after exposure to 10nM LBH589 for 48 hours (D). (E) Influence of pre-exposure to z-vad-fmk on the action of 10nM LBH589 for 48 hours on Mcl-1, appearance of cleaved caspase-3, and apoptosis in primary CLL cells (n = 4).
Action of 10nM LBH589 on Mcl-1, Bcl-2, mitochondrial membrane depolarization and apotosis in CLL cells. Change in Mcl-1 (A), Bcl-2 (B), and mitochondrial membrane depolarization as measured by loss of the mitochondrial dye TMRM (C) and increase in annexin V/propidium iodide positivity after exposure to 10nM LBH589 for 48 hours (D). (E) Influence of pre-exposure to z-vad-fmk on the action of 10nM LBH589 for 48 hours on Mcl-1, appearance of cleaved caspase-3, and apoptosis in primary CLL cells (n = 4).
Discussion
Despite the important role of miR-15a and miR-16 in the pathogenesis of CLL, there still exists a lack of consensus on the extent to which these critical tumor-suppressor miRs are underexpressed in this disease. The first study showing that miR-15a and miR-16 were underexpressed in a majority (68%) of CLL patients used Northern blotting to determine its expression levels, but the quantitative criteria used to determine their underexpression were not provided.43 Another group used RT-PCR in which all miRs were tailed with a common sequence and reverse transcribed using a universal primer, followed by PCR, and used an 8-fold reduction as a cutoff to determine that they were underexpressed in only 11% of CLL patients.44 However, several other studies used a 40%-60% reduction in expression as the cutoff for down-regulation.15,45,46 Using this latter technique and using a cutoff of 60% or greater reduction in expression, we established that miR-15a was underexpressed in 67% and miR-16 in 50% of CLL patients. In agreement with previous reports,18,44 levels of mature miR-15a were significantly lower than mature miR-16. The reasons for this imbalance are still unresolved because miR-15a and miR-16 are transcribed as a single unit before being processed into their mature forms. One study implicated defects in the processing of pre–miR-15a into its mature form.19 An alternative explanation would be the contribution of miR-16 transcribed from the alternate host gene, Smc4.
Genomic losses and epigenetic mechanisms represent the 2 major mechanisms by which gene expression is regulated.36 Our findings demonstrating the selective overexpression of HDAC1-3 in CLL but not normal lymphocytes may identify an independent mechanism for the silencing of miR-15a and miR-16 in CLL. In support of this epigenetic gene-repressive mechanism, CLL cells were characterized by low levels of the transcriptionally activating H3K4me2 chromatin modification at the promoters for the miR-15a and miR-16 genes and expressed low levels of this miR cluster. HDAC inhibition elicited an increase in the levels of acetylation on histones and triggered the accumulation of H3K4me2 at the miR-15a and miR-16 promoter, events that likely facilitated the recruitment of RNA polymerase II to this promoter, as evidenced by the increased levels of expression of miR-15a and miR-16.
Deacetylase inhibition restored the expression of miR-15a and miR-16 in 15 of 51 (30%) and miR-16 in 18 of 51 (32%) evaluable samples, of which 8 samples that had an intact 13q and 7 (miR-15a) to 10 (miR-16) samples displayed del(13q14). In the del(13q14) cohort, 1(miR-15a) to 2 (miR-16) samples displayed del(13q14) as the sole genetic abnormality, whereas all others harbored monoallelic losses in del(13q14) in addition to other cytogenetic abnormalities. In samples that harbored del11q in addition to del(13q14), because the genes deleted on 11q do not affect the expression of miR-15a and miR-16, they are likely to behave identically to samples that have del(13q14) as the sole abnormality in terms of their effect on miR-15a-16 expression. In samples with monoallelic del(13q14) as well as del17p, del17p and the resultant loss of p53 function can impair the transcriptional activation of miR-15a and miR-1647 or facilitate higher levels of Mcl-1.48 Therefore, the presence of del17p complicates evaluations of miR-15a and miR-16 and their relation to del(13q14). When all samples with monoallelic del(13q14) that induced miR-15a and miR-16 are considered together, our results indicate that the HDACs repressed miR-15/16 expression on the residual allele (based on the ability of HDAC inhibition to restore miR-15a and miR-16 expression in them) and provide an example of functional cooperativity between a genetic and epigenetic mechanism to achieve gene repression. Finally, samples that displayed biallelic losses of 13q had the lowest levels of miR-15a and miR-16 expression, which were not reexpressed after HDAC inhibition.
Further, miR-15a and miR-16 were largely reexpressed in conjunction with the host gene dleu2, but not smc4. Finally, our findings that smc4–miR-15a–miR-16 accumulated H3K4me2 marks but did not induce the smc4 transcript suggest the need for additional transcriptional factors that may be required to facilitate transcription of smc4 by RNA polymerase II.
Contrary to the study that found a 5-fold higher expression of miR-29b in CLL samples,24 we determined that miR-29b was underexpressed in only 7 of 46 (15%) samples. Whereas both studies evaluated miR-19b expression in equivalent numbers of CLL samples, our use of a larger cohort of lymphocytes from healthy donors (n = 9 total and CD19+ B lymphocytes) to compare miR-29b expression in CLL may afford a superior comparator to the 2 cord blood samples used as the normal control in the other study. HDAC inhibition restored H3K4me2 marks and robustly induced the expression of 17 of 46 (37%) samples, indicating that a significant number of samples were subject to HDAC-mediated repression in CLL.
The targets repressed by miRs are uniquely dependent on cellular context. Ectopic expression increased the expression of miR-15a and miR-16 by 110- to 400-fold in primary CLL cells, which was associated with variable but reproducible declines in the levels of Mcl-1 but not Bcl-2. These differences in the ability of miR-15a and miR-16 to target Bcl-2 and Mcl-1 in primary CLL cells may reflect interpatient variation and cellular context that regulate the access of miRs to the target mRNA, as well as the basal levels of Mcl-1 in unperturbed cells. In parallel, HDAC inhibition induced miR-15a, miR-16, and miR-29b between 2- and 5-fold, which was sufficient to elicit a rapid loss in the levels of Mcl-1 but not Bcl-2, suggesting that a 2- to 5-fold induction of miR was likely to be sufficient to target Mcl-1. We also observed a strong association between induction of miR-16 and miR-29b and losses in Mcl-1. Even though miR-15a was not induced in half of the samples, Mcl-1 levels were reduced at early time points as long as miR-16 and miR-29b were induced, raising the possibility that miR-16 and miR-29b were sufficient to target Mcl-1. Further, samples that activated both Mcl-1 targeting miR and Mcl-1 targeting caspase-3 reduced Mcl-1 levels to a greater extent than samples that activated only caspase-3. Nonetheless, both groups of patients may benefit clinically from HDAC inhibitor therapy because of its efficacy in reducing Mcl-1, which is associated with loss of mitochondrial function and induction of cell death in primary leukemia cells. In keeping with this, when the action of caspase-3 was blocked, levels of Mcl-1 were maintained (this cohort of samples did not activate the miR-15-16 pathway to Mcl-1 degradation), and this was associated with a partial attenuation of LBH589-induced cell death. Because HDAC inhibition activates other miR29 and protein signaling cascades, many of which converge on the mitochondrial pathway to apoptosis,49 it becomes difficult to isolate the cause and effect relationship between decreases in Mcl-1 and mitochondrial dysfunction and resultant cell death.
In conclusion, our data are the first to establish that HDACs silence miR-15a, miR-16, and miR-29b in 30%-35% of CLL samples. The HDAC-mediated silencing of miR-15a and miR-16 miR may cooperate with del(13q14) to account for the disproportionately low levels of these miRs. Low levels of miR-15a and miR-16 in addition to the selective loss of miR-29b in a subset of CLL may contribute to the pathobiology of the disease. Future prospective trials should evaluate the specific impact of epigenetic silencing of miR-15a, miR-16, and miR-29b on disease behavior and progression. Deacetylase inhibition restored the expression of these miRs, an action that was associated with a loss in the levels of Mcl-1, but not Bcl-2, and loss of CLL survival. Therefore, this offers a therapeutic strategy that antagonizes an important survival mechanism in cells, and CLL patients who exhibit such epigenetic silencing may represent a group that may benefit from HDAC inhibitor–based therapy.
An Inside Blood analysis of this article appears at the front of this issue.
The online version of this article contains a data supplement.
The publication costs of this article were defrayed in part by page charge payment. Therefore, and solely to indicate this fact, this article is hereby marked “advertisement” in accordance with 18 USC section 1734.
Acknowledgments
The authors thank Susan Lerner and Susan Smith for providing clinical data.
This work was supported by the CLL Global Research Foundation, the Ladies Leukemia League Foundation, and the National Institutes of Health (CA81534). K.V. was a Troy Tech summer intern (Troy High School, Fullerton, CA) under the mentorship of D.S. M.S. was supported by a New Investigator Scholarship from the Hematology Society of Australia and New Zealand.
National Institutes of Health
Authorship
Contribution: D.S. conceived of the study, interpreted the data, and wrote the manuscript; C.L., K.V., and M.S. conducted the experiments; and V.K.P., W.G.W., and M.J.K. interpreted the data and helped to write the manuscript.
Conflict-of-interest disclosure: The authors declare no competing financial interests.
Correspondence: Deepa Sampath, PhD, Department of Experimental Therapeutics, M. D. Anderson Cancer Center, 1901 East Rd, Rm 4SCR3.1047, Houston, TX 77054; e-mail: dsampath@mdanderson.org.


