Key Points
Autologous activated T cells can drive antigen-independent proliferation of CLL cells through CD40 and IL-21 signaling.
An IL-21 gene induction signature, IL-21 mRNA, and protein can be found in CLL lymph node samples.
Abstract
Chronic lymphocytic leukemia (CLL) cells multiply in secondary lymphoid tissue, but the mechanisms leading to their proliferation are still uncertain. In addition to B-cell receptor (BCR)–triggered signals, other microenvironmental factors might well be involved. In proliferation centers, leukemic B cells are in close contact with CD4+CD40L+ T cells. Therefore, we here dissected the signals provided by autologous activated T cells (Tact) to CLL cells. Although the gene expression profile induced by Tact was highly similar to that induced by sole CD40 signaling, an obvious difference was that Tact induced proliferation of CLL cells. We determined that stimulation with only CD40L+IL-21 was sufficient to induce robust proliferation in CLL cells. We then defined an interleukin (IL)–21-induced gene signature in CLL, containing components of Janus kinase/signal transducer and activator of transcription and apoptosis pathways, and this signature could be detected in lymph node (LN) samples from patients. Finally, we could detect IL-21 RNA and protein in LN, and IL-21 production ex vivo by LN CD4+CXCR5+ follicular helper T cells. These results indicate that in addition to BCR signaling, activated T cells might contribute to CLL cell proliferation via CD40 and IL-21. Targeting these signaling pathways might offer new venues for treatment of CLL.
Introduction
Chronic lymphocytic leukemia (CLL) is characterized by the progressive accumulation of mature, monoclonal CD5+ B lymphocytes in peripheral blood (PB), bone marrow (BM), and lymph nodes (LN). CLL cells accumulate because of proliferation and resistance to apoptosis.1 Both processes are believed to be governed by the interaction of CLL cells with the microenvironment in lymphoid organs,2 because circulating CLL cells are largely arrested in the G0/G1 phase of the cell cycle and undergo spontaneous apoptosis in vitro3 . Various membrane-bound and soluble proteins from this protective microenvironment—such as stromal cell-derived factor 1, B-cell activating factor, A PRoliferation Inducing Ligand (APRIL),4-6 vascular endothelial growth factor,7 and CD40 ligand (CD40L)8,9 —increase resistance to spontaneous and drug-induced apoptosis, but much less is known about the mechanisms of proliferation of CLL cells.
B-cell receptor (BCR) signaling is believed to have a central role in CLL by promoting cell survival and proliferation and modulating migration and tissue homing.10 It has been suggested that, in an appropriate microenvironment, the BCR becomes engaged by microbial or autoantigens, which along with other costimulatory signals promote the expansion of the CLL clone.2 Also, very recently, cell-autonomous antigen-independent BCR signaling was reported as a crucial determinant in CLL.11 BCRs cloned from CLL samples but not from other B-cell malignancies induced autonomous Ca2+ signals, yet in vitro CLL cells do not proliferate or respond similarly to BCR ligation. In general, BCR ligation in immunoglobulin (Ig) H chain (IgH)–unmutated CLL leads to activating/proliferative responses, whereas it favors anergic/antiapoptotic responses in IgH-mutated CLL.12 This suggests that in addition to BCR-mediated mechanisms, other signals may also contribute to proliferation of CLL cells.
In proliferation centers, CLL cells are in close contact with activated CD40L+ CD4+ T cells,13 and it has been proposed that these cells can support the growth of CLL cells through CD40 ligation.14 In addition, autologous activated CD4+ T cells have been shown to play a key role in CLL expansion in a recently developed adoptive transfer mouse model of CLL.15 However, although CD40L stimulation alters the apoptotic profile of CLL cells and increases their resistance to apoptosis,8 it induces minimal proliferation on its own.16 Thus, there might be other stimuli provided by activated CD4+ T cells that contribute to proliferation of CLL cells.
Previously, a variety of T-cell-derived cytokines have been studied for involvement in the induction of proliferation in CLL cells.17,18 A prominent candidate is interleukin (IL)–21, a cytokine that has a fundamental role in the development of T-cell-dependent B-cell responses19,20 and has also been studied recently in the context of CLL proliferation.21-23 IL-21 shares the common receptor γ-chain with IL-2, IL-7, and IL-15 and is produced by activated human CD4+ T cells, as well as Th17, T follicular helper, and natural killer T cells.19 Depending on the interplay with costimulatory signals and on the developmental stage of a B cell, IL-21 induces proliferation, differentiation into Ig-producing plasma cells, or apoptosis in both mice and humans.24,25 In CLL cells, direct stimulation with IL-21, or subsequent to CD40 stimulation, led to apoptosis.26,27 However, the presence of T cells in close proximity to CLL cells in proliferation centers9,13 led us to hypothesize that in this microenvironment, CLL cells could be exposed simultaneously to CD40L and IL-21 and that this could contribute to proliferation. Therefore, we investigated BCR-independent, T-cell-induced proliferation of CLL cells in vitro and the presence of IL-21 in LN from CLL patients.
Methods
Patient samples
Patient material was obtained from CLL patients, after informed consent, during routine follow-up or diagnostic procedures in our institute. The studies were approved by our Ethical Review Board and conducted in agreement with the Helsinki Declaration of 1975, revised in 1983. PB mononuclear cells (PBMCs) of CLL patients and healthy donors, and BM-derived mononuclear cells were isolated by Ficoll density gradient centrifugation (Pharmacia Biotech, Roosendaal, The Netherlands) and stored in liquid nitrogen. LN material was minced to isolate cells. Expression of CD5 and CD19 (both Beckton Dickinson [BD] Biosciences, San Jose, CA) on leukemic cells was assessed by flow cytometry (FACScalibur, BD Biosciences) and analyzed with CellQuest software (BD Biosciences). All samples contained at least 90% CD5+/CD19+. Cells were cultured as described.8,28
Culture of CLL cells with autologous activated T cells
PBMC from CLL patients (>90% CD5+ CD19+ cells) were thawed, and after positive selection with CD19+ magnetic beads (MACS, Miltenyi Biotec B.V., Leiden, The Netherlands), CLL cells were labeled with 5 µM dodecyldimethylamine oxide -succinimidyl ester (DDAO-SE) (Invitrogen, Carlsbad, CA) and cocultured with autologous T cells (eluted fraction from CD19+ magnetic beads), activated with anti-CD3 (1 μg/mL, clone 1XE, Sanquin, Amsterdam, The Netherlands) and anti-CD28 (3 μg/mL, clone 15E8, Sanquin). Nonactivated (resting) T cells served as negative controls. To block CD40 and IL-21 signaling, anti-CD40L mAb (5 µg/mL, Abcam, Cambridge, UK) and anti-IL21R Fc (20 µg/mL, R&D Systems, Minneapolis, MN) were used. As a control, the Fc portion of human IgG1 was used (20 µg/mL, R&D Systems). CLL cells were permeabilized (FoxP3 staining buffers, eBioscience, San Diego, CA) and stained with an antibody against Ki-67 (BD Biosciences).
Assessment of proliferation and apoptosis
PBMC (1.0 × 10⁷ per milliliter) were labeled with 0.5 μM carboxyfluorescein diacetate succinimidyl ester (CFSE; Molecular Probes, Life Technologies, Grand Island, NY) as described before.16 Cells were cultured on 3T40L or 3T3 control cells as described previously,8 in absence or presence of recombinant human IL-21 (25 ng/mL, Gibco, Invitrogen), IL-2 (50 U/mL; Sanquin), IL-15 (25 ng/mL; Gibco, Invitrogen), CpG (1 μg/mL, ODN2006, Invitrogen), or anti-IgM antibodies (clone MH15, Sanquin). After 5 days, proliferation was assessed in a fluorescence-activated cell sorter (FACS) Canto (BD Biosciences) and analyzed with FlowJo software (TreeStar, Ashland, OR). Apoptosis was analyzed in the same cultures as described.16
Western blot
Western blotting was performed as described previously.28 Blots were probed with anti-human Bcl-xL (catalogue number 620211, BD Biosciences), Bim (catalogue number AAP-330E, Enzo, Antwerp, Belgium), Tubulin (catalogue number T6199, Sigma-Aldrich Chemie B.V., Zwijndrecht, The Netherlands), Noxa (catalogue number IMG-349, Imgenex, San Diego, CA), Mcl-1 (catalogue number 4572, Cell Signaling, Danvers, MA), Stat3, and phospho-Stat3 (catalogue numbers 9139 and 9145, Cell Signaling). IRDye 680 donkey anti-rabbit IgG, IRDye 800 donkey anti-goat IgG, or IRDye 800 donkey anti-mouse IgG (Westburg, Leusden, The Netherlands) were used as secondary antibodies.
Reverse transcription—multiplex ligation-dependent probe amplification (RT-MLPA) assay
RT-MLPA (MRC-Holland, Amsterdam, The Netherlands) procedure was performed and analyzed as described previously.29 Data were normalized by defining housekeeping (HK) genes with Genorm program, as previously described30 and expressing individual peaks in relation to the sum of expression values of the HK genes.
Granzyme B and perforin measurement, IL-21 quantitative polymerase chain reaction
Granzyme B and perforin staining after CD40+Il-21 stimulation were performed as described.31 IL-21 quantitative polymerase chain reaction was performed with Fast SYBR Green Master Mix on a StepOne Plus machine (Life Technologies, Breda, The Netherlands) using the following primers: IL-21 forward 5′-GGCAACATGGAGAGGATTG-3′ and IL-21 reverse 5′-AAGCAGGAAAAAGCTGACCA-3′. The results were normalized to 18S using the ΔCt method.
Immunohistochemistry
Paraffin-embedded LN samples from CLL patients were cut, deparaffinized, and rehydrated through xylene and ethanol. Endogenous peroxidase was blocked by incubation in 0.03% H2O2 in methanol, for 20 minutes at room temperature, and then heat-induced epitope retrieval was performed in Tris-EDTA (pH = 9.0) buffer. Samples were incubated with anti-human IL-21 antibody (rabbit polyclonal, eBioscience) overnight at 4°C. Immunoreactive cells were visualized using BrightVision poly-HRP-anti-mouse/rabbit/rat IgG and BrightDAB (Immunologic, Duiven, The Netherlands), and counterstained with hematoxylin. Isotype control sections were prepared using normal rabbit IgG control antibody (Dako, Eindhoven, The Netherlands). Images were acquired in a DM5000B microscope with a PL FLUOTAR 40×/1.00-0.50 objective, using a DFC500 camera (Leica Microsystems, Heppenheim, Germany) coupled to the imaging program Image Pro Plus vs 5.02 (Media Cybernetics, Rockville, MD).
IL-21 production by LN-derived T cells
To identify the IL-21-producing population in CLL lymph nodes, we analyzed matched PB/LN node pairs from CLL patients after PMA/ionomycin stimulation. Cells (2 × 10⁶) were rested in medium O/N, and stimulated in nontreated 96 wells, using a mix of phorbol-12-myristate-13-acetate (PMA) (10 ng/mL), ionomycin (1 μg/mL), anti-CD28 (15E8, 2 μg/mL), anti-CD29 (TS 2/16, 1 μg/mL), Brefeldin A (Invitrogen, 10 μg/mL), and Golgistop in a final volume of 200 μL for 4 hours. The same mix lacking PMA/ionomycin was added as control. Cells were stained using the following antibodies in phosphate-buffered saline /0.5% bovine serum albumin: CD3-V450, CD4-PerCP/Cy5.5, CD8-BrilliantViolet 421, CXCR5-FITC, and Live/Dead fixable red cell stain for 30 minutes at 4°C. Subsequently, cells were permeabilized using the Fix and Perm Kit (Invitrogen) and stained for intracellular CD40L-PE and IL-21-APC for 30 minutes at 4°C, and analyzed on an LSR Fortessa flow cytometer (BD Biosciences) and analyzed with FlowJo software.
Statistical analysis
Differences between groups were compared using either the Student t test or the Mann-Whitney U test (paired, when applicable). P values < .05 were considered statistically significant.
Results
Autologous activated T cells induce a gene profile highly similar to that induced by CD40L
We previously showed that prolonged CD40 stimulation of CLL cells mimics the situation in LN in terms of antiapoptotic profile and drug resistance.9 However, this model oversimplifies the complex interactions between T cells and CLL cells in the lymphoid organs and induces no or minimal proliferation.16 Therefore, we investigated more directly the signals provided by autologous activated T cells (Tact) to CLL cells.
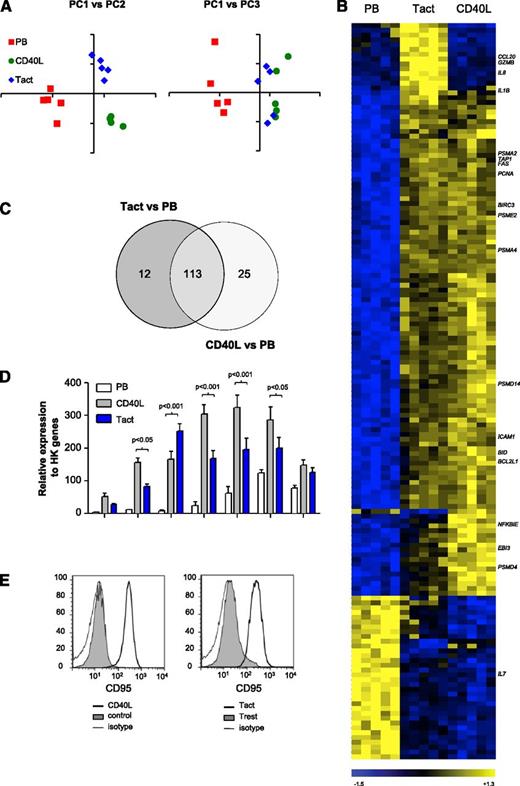
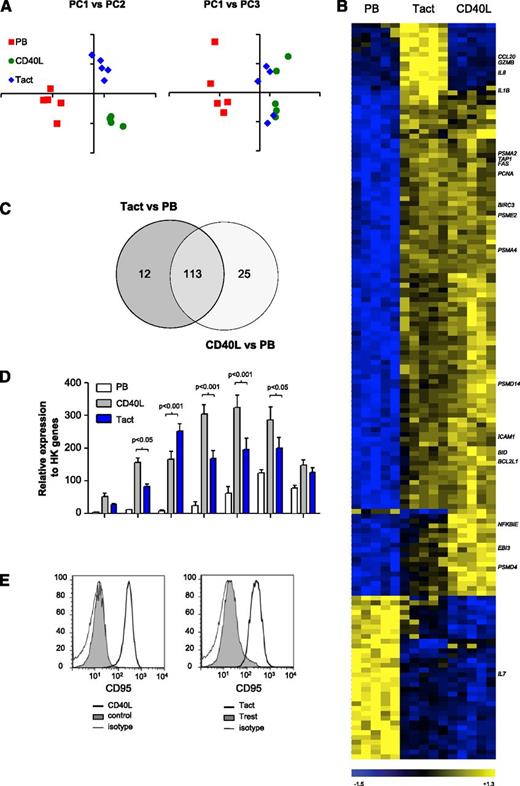
We compared the gene expression profile induced by Tact and by CD40L stimulation alone. CD19+ cells from PB of CLL patients were cultured with purified, activated autologous T cells in T cell:B cell ratio of 1:2. Because we were interested in early response genes, gene expression was analyzed at t = 16 hours with whole genome microarrays (Gene Expression Omnibus accession number GSE50572). After normalization, unsupervised clustering was performed by principal component analysis. The first principal component (PC) is the mathematical combination of measurements that accounts for the largest amount of variability. Plotting PC1 vs PC2 distinguished the 3 different treatments (Figure 1A), and plotting PC1 vs PC3 showed a clear separation between PB and samples that were stimulated with either Tact or CD40L but not between the 2 in vitro systems. Next, we evaluated differential gene expression among the 3 groups. One hundred fifty-three genes were differentially expressed between any pair of groups (analysis of variance [ANOVA], P < .01, Bonferroni correction, minimum present calls = 1; Figure 1B and supplemental Table 2 [available on the Blood Web site]). As inferred by the previous analyses, 74% of these genes (113 out of 153) were modulated by both in vitro systems compared with PB, and only a minority of genes were different in 1 in vitro system alone (Figure 1C and supplemental Table 2). Gene set enrichment analysis was performed to interrogate which biological pathways were induced in CLL cells by Tact (Table 1). Both Tact and CD40L signaling regulated gene sets related to the proteasome, apoptosis, and cell cycle. Additionally, Tact differentially regulated a gene set related to cytokine-cytokine receptor interaction.
The gene expression signature induced in CLL cells by autologous activated T cells is very similar to that induced by CD40L stimulation. (A-C) Gene expression analysis (U133 plus 2.0 array, Affymetrix) of sorted CD20+ CD5+ CLL cells derived from PB or cultured with CD40L-expressing cells (CD40L) or Tact for 16 hours. Samples are numbers 2, 5B, 19, 24, and 27 as detailed in supplemental Table 1. (A) Principal component analysis is a statistical method for exploring large datasets by reducing the measurements (dimensions) to the few PCs that explain the main patterns. The coordinates obtained for the 3 PCs (PC1, PC2, and PC3) are depicted in 2-dimensional graphs. (B) Heatmap of 153 differentially expressed genes (ANOVA P < .01; minimum present calls >1; Bonferroni correction for multiple testing), depicting results for paired samples from the 5 patients mentioned above. (C) Venn diagram of the genes differentially expressed between Tact vs PB and CD40L vs PB. (D) The expression of different apoptotic mediators was analyzed by MLPA in the same samples as in panels A-C. Results are shown for relevant genes as relative expression to HK genes. (E) Purified CLL B cells were stained with DDAO and cultured for 48 hours either with CD40L-expressing fibroblasts (CD40L) or a control cell line (control) (left panel) or with autologous T cells, in the absence (resting T cells, Trest) or presence of agonistic antibodies against CD3 and CD28 (Tact) (right panel). CD95 expression was then assessed by flow cytometry on DDAO+ cells. Representative histograms are shown for each condition for sample 21.
The gene expression signature induced in CLL cells by autologous activated T cells is very similar to that induced by CD40L stimulation. (A-C) Gene expression analysis (U133 plus 2.0 array, Affymetrix) of sorted CD20+ CD5+ CLL cells derived from PB or cultured with CD40L-expressing cells (CD40L) or Tact for 16 hours. Samples are numbers 2, 5B, 19, 24, and 27 as detailed in supplemental Table 1. (A) Principal component analysis is a statistical method for exploring large datasets by reducing the measurements (dimensions) to the few PCs that explain the main patterns. The coordinates obtained for the 3 PCs (PC1, PC2, and PC3) are depicted in 2-dimensional graphs. (B) Heatmap of 153 differentially expressed genes (ANOVA P < .01; minimum present calls >1; Bonferroni correction for multiple testing), depicting results for paired samples from the 5 patients mentioned above. (C) Venn diagram of the genes differentially expressed between Tact vs PB and CD40L vs PB. (D) The expression of different apoptotic mediators was analyzed by MLPA in the same samples as in panels A-C. Results are shown for relevant genes as relative expression to HK genes. (E) Purified CLL B cells were stained with DDAO and cultured for 48 hours either with CD40L-expressing fibroblasts (CD40L) or a control cell line (control) (left panel) or with autologous T cells, in the absence (resting T cells, Trest) or presence of agonistic antibodies against CD3 and CD28 (Tact) (right panel). CD95 expression was then assessed by flow cytometry on DDAO+ cells. Representative histograms are shown for each condition for sample 21.
The induction of apoptosis-related genes was further validated by MLPA.29 Increased expression of BCL2L1 (Bcl-xL), BID, Fas (CD95), BIRC2 (cIAP1), BCL2A1 (Bfl-1), CDKN1A (p21), and SERPINB9 (PI9), both by CD40L and Tact, was found (Figure 1D), albeit the levels after CD40L stimulation were in most cases higher. Induction of CD95 protein was also confirmed by FACS analysis (Figure 1E). These results suggest that the overall gene expression profile induced by Tact and CD40L stimulation in CLL cells is highly similar.
IL-21, in combination with CD40 stimulation, and Tact induce proliferation of CLL cells
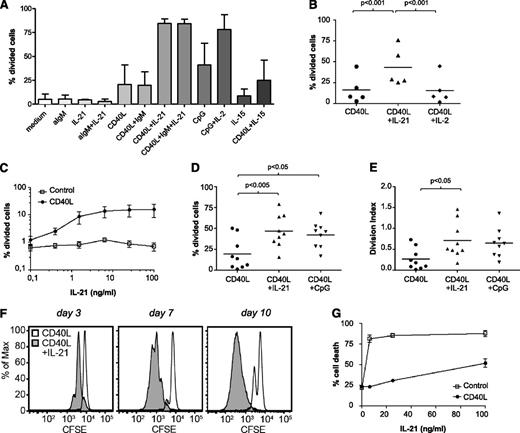
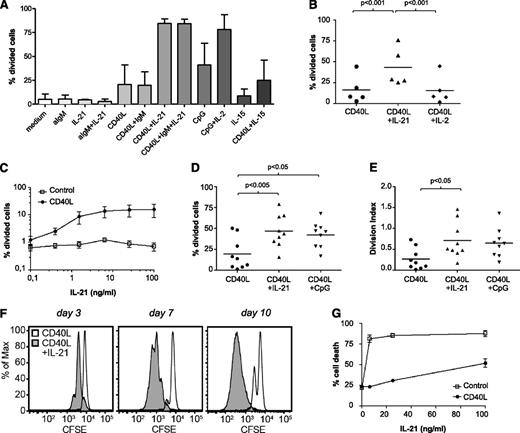
The microarray analyses indicated that Tact induced cell cycle as well cytokine signaling gene sets. Using a similar system as described before with CD40 and CpG triggering,16,32 we therefore evaluated which cytokines in combination with CD40 stimulation could induce proliferation in CLL cells. Of note, stimulation with CD40 + IL-21 induced the highest levels of proliferation, in comparison with CD40 + anti-IgM, or CD40 + IL-15 (Figure 2A). As reported before, IL-2 induced proliferation in combination with CpG32 but not in combination with CD40 stimulation (Figure 2A-B). As expected, in normal B cells, anti-IgM + CD40 triggering did lead to proliferation (data not shown).
IL-21 plus CD40 signaling induces proliferation in CLL cells. (A) CFSE-stained CLL cells were cultured after various stimulations as indicated. After 6 days, the percentage of divided cells was calculated with FlowJo. Results are depicted as mean ± standard deviation (SD) from samples 5A, 12A, and 15. (B) CFSE-stained CLL cells were cultured with CD40L-expressing fibroblasts in the absence or presence of IL-21 (25 ng/mL) or IL-2 (50 U/mL). Proliferation was assessed after 5 days, and the percentage of divided cells is depicted as individual values for 5 patients (samples 6B, 7, 8, 10, 28), together with the average value. (C) CFSE-stained CLL cells were cultured with 3T3 control line or with CD40L-expressing 3T3 in absence or presence of different concentrations of IL-21 for 5 days. The percentage of divided cells is depicted as mean ± SD, for samples 12B, 16A, and 29B. (D-E) CFSE-stained CLL cells were cultured with CD40L-expressing fibroblasts in the absence or presence of IL-21 (25 ng/mL) or CpG (1 μg/mL). The percentage of divided cells (panel C) and division index (panel D) after 5 days are depicted as individual values for 9 patients (samples 4, 5C, 6C, 13, 17, 25, 26, 29A, 31), together with the average value. (F) CFSE-stained CLL cells were cultured with CD40L-expressing fibroblasts in the absence or presence of IL-21 (25 ng/mL), and the stimulation was renewed after 3 and 7 days. Proliferation was assessed at day 3, 7, and 10. Results are shown as representative histograms from sample 12B. (G) In the cultures from panel C, cell death was assessed after 5 days. Results are shown as the percentage of cell death (DiOC6− PI+/−), mean ± SD.
IL-21 plus CD40 signaling induces proliferation in CLL cells. (A) CFSE-stained CLL cells were cultured after various stimulations as indicated. After 6 days, the percentage of divided cells was calculated with FlowJo. Results are depicted as mean ± standard deviation (SD) from samples 5A, 12A, and 15. (B) CFSE-stained CLL cells were cultured with CD40L-expressing fibroblasts in the absence or presence of IL-21 (25 ng/mL) or IL-2 (50 U/mL). Proliferation was assessed after 5 days, and the percentage of divided cells is depicted as individual values for 5 patients (samples 6B, 7, 8, 10, 28), together with the average value. (C) CFSE-stained CLL cells were cultured with 3T3 control line or with CD40L-expressing 3T3 in absence or presence of different concentrations of IL-21 for 5 days. The percentage of divided cells is depicted as mean ± SD, for samples 12B, 16A, and 29B. (D-E) CFSE-stained CLL cells were cultured with CD40L-expressing fibroblasts in the absence or presence of IL-21 (25 ng/mL) or CpG (1 μg/mL). The percentage of divided cells (panel C) and division index (panel D) after 5 days are depicted as individual values for 9 patients (samples 4, 5C, 6C, 13, 17, 25, 26, 29A, 31), together with the average value. (F) CFSE-stained CLL cells were cultured with CD40L-expressing fibroblasts in the absence or presence of IL-21 (25 ng/mL), and the stimulation was renewed after 3 and 7 days. Proliferation was assessed at day 3, 7, and 10. Results are shown as representative histograms from sample 12B. (G) In the cultures from panel C, cell death was assessed after 5 days. Results are shown as the percentage of cell death (DiOC6− PI+/−), mean ± SD.
In combination with CD40L, IL-21 induced proliferation of CLL cells over a range of concentrations (Figure 2C). As previously reported,16 a small number of CLL samples proliferated somewhat in response to CD40L, but this was always increased both by IL-21 or cytosine guanine dinucleotide (CpG) stimulation (Figure 2D), but not noticeably by IL-4, another Thelper cytokine (data not shown). The division index—the average number of cell divisions of a cell in the original population—was lower than 2 for all treatments (Figure 2E). To check whether this was due to shortage of nutrients/stimulation or a block in proliferation, we refreshed the stimuli and medium every 3 to 4 days, which led to proliferation of the majority of CLL cells (Figure 2F). Previous reports had suggested that IL-21 alone or subsequent to CD40 stimulation could induce apoptosis.26,27 In agreement, we found that in absence of CD40, IL-21 induced significant levels of apoptosis (Figure 2G), but this was largely diminished by the CD40 + IL-21 combination. Thus, in the presence of CD40L stimulation, IL-21 signaling results in proliferation of CLL cells, with a significant decrease in the induction of cell death.
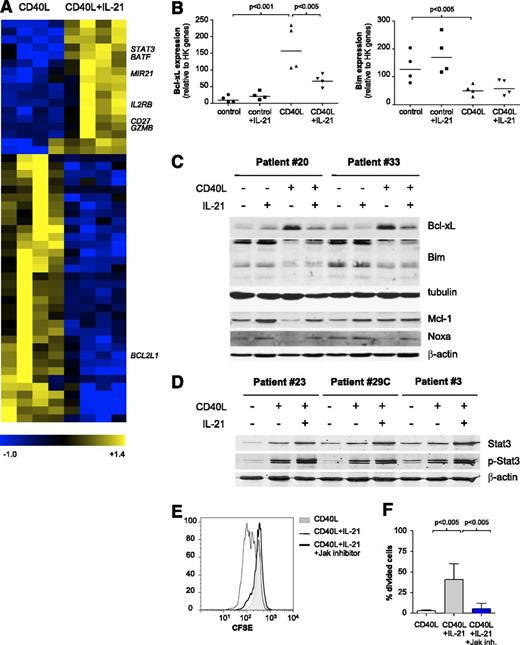
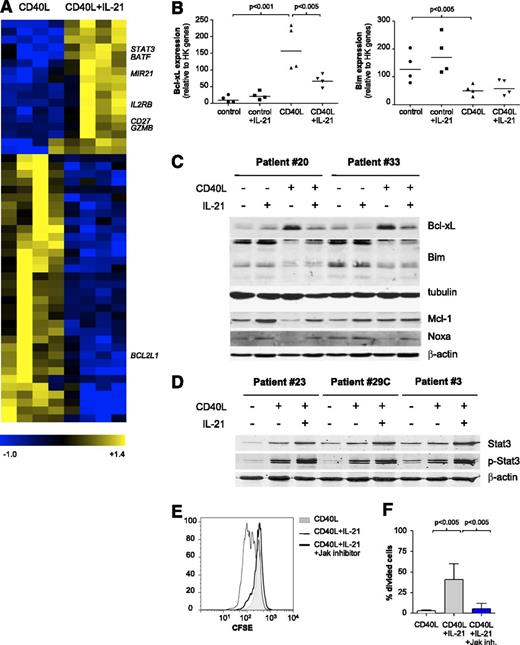
We next investigated changes underlying the switch from apoptosis to proliferation upon CD40 + IL-21 stimulation. Freshly thawed CLL PBMCs were incubated overnight on CD40L-expressing cells in the presence or absence of IL-21. Microarray analysis revealed that 51 genes were significantly regulated by IL-21 in CD40L-stimulated cells (P < .01, fold change >3; Figure 3A and supplemental Table 3). Of these, 17 genes were upregulated and 34 downregulated, among which we found a significant decrease in BCL2L1 (Bcl-xL) (Figure 3A). To validate this, gene expression of Bcl-xL and other apoptosis-related mediators in CLL cells stimulated with CD40L and/or IL-21 were analyzed via MLPA assay. As described previously,8,28 in vitro CD40 stimulation of CLL cells induced the transcription of BCL2L1 (Bcl-xL) and BCL2A1 (Bfl-1) and led to a decrease in the expression of BCL2L11 (Bim) (Figure 3B). IL-21 interfered with Bcl-xL upregulation induced by CD40L but did not affect Bim downregulation, both at RNA and protein levels (Figure 3B-C). In addition, Mcl-1 protein was also upregulated by CD40 + IL-21, in comparison with CD40 alone, compensating for the increase in Noxa protein (Figure 3C). Overall, the balance in pro- and antiapoptotic Bcl-2 members appeared in line with the observed shift to a prosurvival state of the CD40 + IL-21 combination, in comparison with IL-21 alone.
IL-21 alters the antiapoptotic profile induced by CD40L by downregulating Bcl-XL and induces proliferation through Jak-STAT3. (A) Gene expression analysis of sorted CD19+ CD5+ CLL cells, cultured with CD40L-expressing fibroblasts in the absence or presence of IL-21 for 16 hours. Heatmap of 51 differentially expressed genes (ANOVA P < .01; fold change >3; minimum present calls >3; minimum highest expression >200), depicting results for paired samples from 4 patients (samples 2, 5B, 11, 30). (B) The RNA samples from panel A were analyzed for expression of different apoptotic mediators by MLPA. Results are shown for relevant genes as relative expression to HK genes (mean ± SD; n = 4). (C-D) CLL cells cultured as in panel A were analyzed after 72 hours by western blot for the indicated BCl-2 family members. Tubulin and β-actin were used as loading controls. (E) CFSE-stained CLL cells were cultured with CD40L-expressing fibroblasts alone, together with IL-21 (25 ng/mL) or IL-21 plus an inhibitor of Jak kinases (Ruxolitinib, 1 μg/mL) for 5 days. Representative histograms from sample 23 are shown. (F) CLL cells were cultured as in panel E. The percentage of divided cells is depicted as mean ± SD, for samples 16B, 23, and 29C.
IL-21 alters the antiapoptotic profile induced by CD40L by downregulating Bcl-XL and induces proliferation through Jak-STAT3. (A) Gene expression analysis of sorted CD19+ CD5+ CLL cells, cultured with CD40L-expressing fibroblasts in the absence or presence of IL-21 for 16 hours. Heatmap of 51 differentially expressed genes (ANOVA P < .01; fold change >3; minimum present calls >3; minimum highest expression >200), depicting results for paired samples from 4 patients (samples 2, 5B, 11, 30). (B) The RNA samples from panel A were analyzed for expression of different apoptotic mediators by MLPA. Results are shown for relevant genes as relative expression to HK genes (mean ± SD; n = 4). (C-D) CLL cells cultured as in panel A were analyzed after 72 hours by western blot for the indicated BCl-2 family members. Tubulin and β-actin were used as loading controls. (E) CFSE-stained CLL cells were cultured with CD40L-expressing fibroblasts alone, together with IL-21 (25 ng/mL) or IL-21 plus an inhibitor of Jak kinases (Ruxolitinib, 1 μg/mL) for 5 days. Representative histograms from sample 23 are shown. (F) CLL cells were cultured as in panel E. The percentage of divided cells is depicted as mean ± SD, for samples 16B, 23, and 29C.
IL-21 is known to engage Janus kinase/signal transducer and activator of transcription (JAK/STAT) signaling in CLL.21 In agreement, STAT3 expression and phosphorylation were induced as detected by microarray and western blotting (Figure 3A,D). IL-21 caused sustained STAT3 but not STAT5 activation (data not shown). To establish the requirement for JAK signaling, we added a pan-JAK inhibitor to the system, and this indeed prevented proliferation (Figure 3E-F).
In accordance with previous studies in healthy B cells and CLL cells,16,33-35 we detected a significant induction of granzyme B by IL-21 in CD40L-stimulated CLL cells. Granzyme B induction after IL-21 was confirmed by flow cytometry and was more marked after CD40 stimulation (supplemental Figure 1B). Of note, the increase in Granzyme B was not accompanied by expression of perforin, and IL-21 treatment did not alter the percentages of Granzyme B+ or Granzyme B+ Perforin+ CD3+ cells in the same cultures (supplemental Figure 1B).
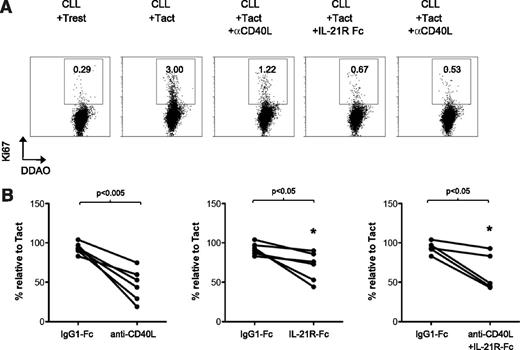
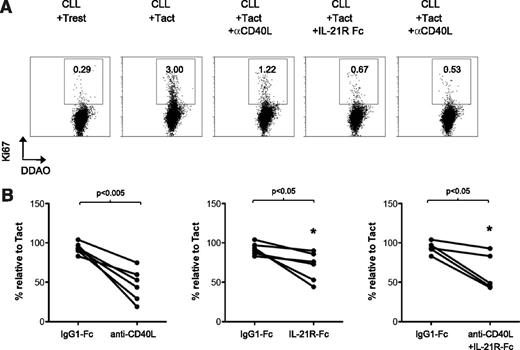
To investigate whether the Tact system could also induce proliferation in CLL cells, we assessed Ki-67 staining after 2 days of stimulation. Clearly, Tact induced a fraction of CLL cells to become positive for Ki-67 (Figure 4A). Importantly, Ki-67 staining of CLL cells was reduced in the presence of a blocking antibody for CD40L and a decoy receptor for IL-21. This blocking effect of anti-CD40L and IL-21-Fc was not always complete but appeared specific, as demonstrated by the control IgG1 Fc molecule (Figure 4A-B).
Autologous activated T cells induce proliferation of CLL cells through a CD40L- and IL-21-dependent mechanisms. (A) Purified CLL B cells were stained with DDAO and cultured for 48 hours with autologous T cells, in the absence (resting T cells, Trest) or presence of agonistic antibodies against CD3 and CD28 (Tact), or with the addition of a blocking antibody against CD40L (αCD40L) or a decoy receptor for IL-21 (IL-21R Fc). After 48 hours, proliferation was assessed by Ki-67 staining. Representative histograms of Ki-67 expression in DDAO+ gated cells are shown. (B) Results are depicted as the percentage of Ki-67+ cells after treatment with the blocking reagents, or an IgG1-Fc control molecule, in relation to the percentage of Ki-67+ cells in the cultures with Tact (100%) for 5 to 6 patients analyzed at day 5 (samples 6B, 7, 8, 10, 28, 32).
Autologous activated T cells induce proliferation of CLL cells through a CD40L- and IL-21-dependent mechanisms. (A) Purified CLL B cells were stained with DDAO and cultured for 48 hours with autologous T cells, in the absence (resting T cells, Trest) or presence of agonistic antibodies against CD3 and CD28 (Tact), or with the addition of a blocking antibody against CD40L (αCD40L) or a decoy receptor for IL-21 (IL-21R Fc). After 48 hours, proliferation was assessed by Ki-67 staining. Representative histograms of Ki-67 expression in DDAO+ gated cells are shown. (B) Results are depicted as the percentage of Ki-67+ cells after treatment with the blocking reagents, or an IgG1-Fc control molecule, in relation to the percentage of Ki-67+ cells in the cultures with Tact (100%) for 5 to 6 patients analyzed at day 5 (samples 6B, 7, 8, 10, 28, 32).
IL-21 + CD40 gene signature is induced in CLL cells by activated T cells and is also present in lymph node samples
We compared gene expression profiles of IL-21 + CD40 stimulation with Tact. From the averaged fold induction of all genes modulated by IL-21 in comparison with CD40L-stimulated cells, we compiled an “IL-21 score.” This score was 5 times higher in CLL cells after stimulation with CD40L + IL-21 (Figure 5A). The same score was calculated in the microarray dataset from CLL cells cocultured with autologous Tact, and also in this case the IL-21 score was significantly higher than in matching CD40L-stimulated cells (Figure 5B). Next, we investigated whether the expression signature as summarized in the IL-21 score was present in LN and BM samples from CLL patients. We calculated the score from 5 BM samples and 2 LN samples in comparison with their matched PB samples. In the LN samples, the values obtained (1.5 and 1.6) were higher than those found in matching BM samples. This was suggestive of IL-21 biological activity but inconclusive because of the low number of LN samples available to us (data not shown). To investigate this issue further, we interrogated an available dataset generated by Herishanu et al,36 who investigated matched PB, BM, and LN samples using the same microarray platform. The IL-21 scores generated from their public deposit are depicted in Figure 5C. Most of the LN samples in this external collection presented IL-21 scores significantly higher than those of the paired BM samples, strengthening the validity of the IL-21 score. Collectively, the data are indicative of active IL-21 signaling in CLL in vivo and suggest that the IL-21 signature is higher in the LN than in the BM of CLL patients.
IL-21 gene expression signature is increased in CLL cells cultured with autologous activated T cells and in lymph nodes from CLL patients. An IL-21 score was computed as the average of the fold change in messenger RNA expression of the 51 genes shown in Figure 3A and in supplemental Table 3. (A) IL-21 score for CD40 versus CD40 + IL-21 for samples 2, 5B, 11, and 30. (B) IL-21 score for CD40 versus Tact, for samples 2, 5B, 19, 24, and 27. (C) IL-21 score calculated from published data of Herishanu et al36 from BM and PB, in relation to the corresponding level in PB.
IL-21 gene expression signature is increased in CLL cells cultured with autologous activated T cells and in lymph nodes from CLL patients. An IL-21 score was computed as the average of the fold change in messenger RNA expression of the 51 genes shown in Figure 3A and in supplemental Table 3. (A) IL-21 score for CD40 versus CD40 + IL-21 for samples 2, 5B, 11, and 30. (B) IL-21 score for CD40 versus Tact, for samples 2, 5B, 19, 24, and 27. (C) IL-21 score calculated from published data of Herishanu et al36 from BM and PB, in relation to the corresponding level in PB.
Lymph node samples from CLL patients contain IL-21, which can be produced in vitro by Tfh cells
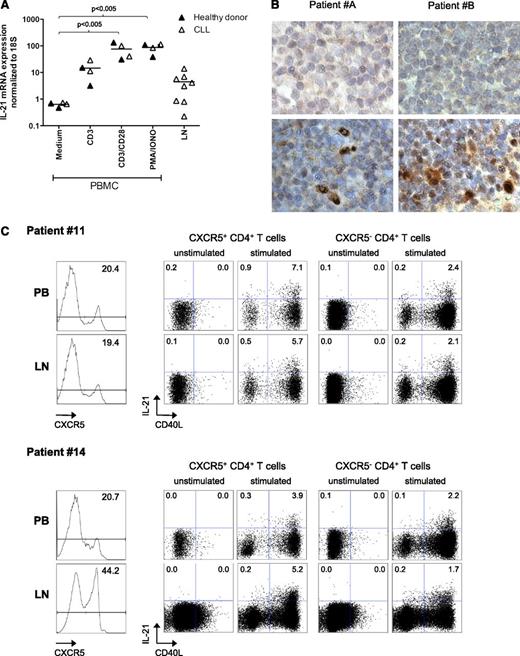
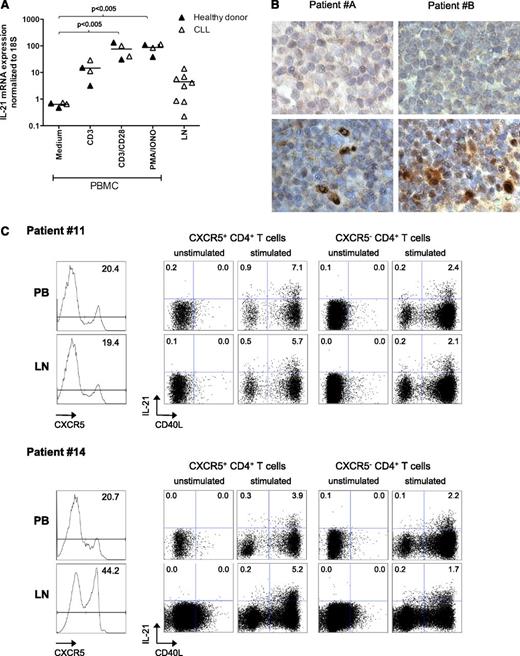
Finally, we explored whether we could directly detect IL-21 RNA and protein in LN samples from CLL patients. We measured IL-21 by quantitative reverse-transcription polymerase chain reaction (qRT-PCR) in RNA obtained from CLL or healthy PBMCs stimulated with anti-CD3 ± anti-CD28 agonistic antibodies or PMA/ionomycin. For all stimulations, we could detect similar levels of IL-21 induction in healthy and CLL samples, in comparison with the control condition. A similar analysis was performed on frozen LN samples of CLL patients, where we could also detect IL-21 mRNA, albeit at variable levels (Figure 6A). In order to confirm these results, we performed immunohistochemistry on paraffin-embedded LN samples. Staining conditions were optimized using a reactive lymph node from a patient with systemic lupus erythematosus (supplemental Figure 2) and then applied to 5 available CLL LN samples. Of these, 3 showed clear IL-21 positive cells (2 shown in Figure 6B). Together, these data strongly suggest the presence of IL-21 in at least some CLL LN tissues.
IL-21 expression in lymph nodes from CLL patients. (A) IL-21 expression was studied by qRT-PCR in RNA from PBMCs from 2 healthy donors and 2 CLL patients (samples 6A, 8), after activation with αCD3 or αCD28 antibodies or PMA + ionomycin, or in total frozen LN samples from CLL patients (samples 34 to 40). (B) IL-21 expression was analyzed in 2 paraffin-embedded CLL LN samples by IHC. Upper panels show nonspecific staining with control antibodies; lower panels show results with anti-IL-21 antibodies. Original magnification ×40, further digital magnification ×4. (C) Matched samples of PB and LN from 2 CLL patients (samples 11 and 14) were stimulated as indicated in the “Methods” section for 4 hours. They were then stained for expression of CD3, CD4, CXCR5, CD40L, and IL-21. Results depict the histograms for CXCR5 expression (unstimulated samples, left panels) and the expression of IL-21 and CD40L by CXCR5+ and CXCR5− CD3+ CD4+ cells for PB (upper) and LN (lower) samples.
IL-21 expression in lymph nodes from CLL patients. (A) IL-21 expression was studied by qRT-PCR in RNA from PBMCs from 2 healthy donors and 2 CLL patients (samples 6A, 8), after activation with αCD3 or αCD28 antibodies or PMA + ionomycin, or in total frozen LN samples from CLL patients (samples 34 to 40). (B) IL-21 expression was analyzed in 2 paraffin-embedded CLL LN samples by IHC. Upper panels show nonspecific staining with control antibodies; lower panels show results with anti-IL-21 antibodies. Original magnification ×40, further digital magnification ×4. (C) Matched samples of PB and LN from 2 CLL patients (samples 11 and 14) were stimulated as indicated in the “Methods” section for 4 hours. They were then stained for expression of CD3, CD4, CXCR5, CD40L, and IL-21. Results depict the histograms for CXCR5 expression (unstimulated samples, left panels) and the expression of IL-21 and CD40L by CXCR5+ and CXCR5− CD3+ CD4+ cells for PB (upper) and LN (lower) samples.
To address which population of CD4+ T cells from LNs from CLL patients were able to produce IL-21, we stimulated matched samples of PB and LN from 2 CLL patients with PMA and iononycin for 4 hours. Because the main producers of IL-21 are follicular helper T cells (Tfh), characterized by CXCR5 expression,37-39 we evaluated CD40L expression and IL-21 production in CXCR5+ vs CXCR5− CD4+ T cells. The PB percentage of CXCR5+ cells was comparable to those reported recently.23 Similar to what we have observed in healthy LNs in comparison with matched PB (Simone H.C. Havenith, Ester B.M. Remmerswaal, Mirza M. Idu, Karlijn A.M.I. van Donselaar-van der Pant, Nelly van der Bom, Fréderike J. Bemelman, Ester M.M. van Leeuwen, Ineke J. M. ten Berge, and René A. W. van Lier, manuscript submitted July 2013), one sample in particular presented much higher levels of CXCR5+ cells in the LN in comparison with PB (Figure 6C). Most important, for both patients and compartments, the highest production of IL-21 was found in CXCR5+CD40L-expressing cells. These results suggest that activated T cells with a Tfh phenotype are an important source of IL-21 in CLL patients.
Discussion
The mechanisms of CLL proliferation and its pharmacological targeting are of obvious clinical interest. We describe for the first time that autologous, activated T cells induce proliferation of CLL cells. The combination of CD40L and IL-21 stimulation alone is sufficient to induce robust proliferation of CLL cells. This aspect was recently also reported independently by Ahearne et al.23 The gene signature derived from combined CD40 + IL-21 stimulation could be traced in in vivo lymph node samples where CD4+ T and CLL B cells have been proposed to interact.3,14 On the basis of our combined molecular and cellular analyses, we suggest that IL-21 may play a role in antigen-independent proliferation of CLL cells at lymh node sites.
In the CD40 + IL-21 and the Tact system, the CLL cells start to proliferate after 2 to 3 days. Because an early time point of 16 hours after stimulation was chosen for RNA sampling, no drastic changes in genes expression related to cell cycle are expected yet and indeed were not observed. A previous study on gene expressions pattern induced in CLL by CD40 stimulation applied later time points (48-72 hours)40 and noted that in comparison with healthy donor B cells, CLL cells displayed reduced expression of cell cycle genes.
Several previous reports on the effect of IL-21 on CLL have highlighted apoptosis induction by IL-21 alone on freshly isolated CLL cells.26 In another set-up, CLL cells were first stimulated with CD40L before addition of IL-21.27 It has been shown for murine B cells that IL-21 can induce apoptosis if administered together with lipopolysaccharide or CpG but promotes proliferation when combined with anti-IgM or anti-CD40 agonist antibodies.25 In our experiments, sole IL-21 also induced apoptosis, but concomitant CD40-signaling clearly shifted the balance to proliferation. Our results suggest that although clinical application of IL-21 could potentially eliminate some CLL cells, it poses the risk of inducing proliferation of CLL cells in contact with activated T cells.
An important point of the present work was to find evidence of IL-21 presence/signaling in vivo. First, we used an indirect strategy, which has also been used to detect BCR signaling in LN from CLL patients.36 An IL-21/CLL signature was generated by evaluating gene expression changes induced by IL-21 in CD40L-stimulated CLL cells. This gene signature was then used to interrogate more physiological systems than was the CD40L transfectant system, using in vitro cultures of CLL with Tact and ex vivo samples from CLL lymph nodes. The IL-21 score induced by Tact was comparable to that achieved by the combination of IL-21 and CD40L-expressing cells. More important, both in samples from our cohort and in data available from a previous publication,36 we found a small but consistent increase in these scores in comparison with those found in BM samples. The low scores are to be expected because they were obtained from the total CLL B-cell population of these organs, and the amount of CLL cells potentially in contact with IL-21 could be small, in contrast to the in vitro systems. To estimate the size of this subpopulation, one approximation is to consider the population of proliferating cells as potentially influenced by the cytokine. Herishanu et al reported that Ki-67+ cells represent between 3% and 8% of the CD3− cells in the LN.36 Given these modest percentages, it seems therefore of relevance that we could in fact find significant differences in the IL-21 score in LN samples. A second method was to directly demonstrate the presence of IL-21 in LN samples by qRT-PCR and immunohistochemistry (IHC). The qRT-PCR data indicate that the levels of IL-21 in LN samples were in the range of T cells activated in vitro by αCD3 antibodies, which given the point addressed above about cell percentages, seems significant. The IHC data were not conclusive for all samples studied but were strongly suggestive of pericellular and cytoplasmic presence of Il-21 in certain areas. More important, an important source of IL-21 after in vitro activation of PB and LN were the CXCR5+ CD4+ T cells. This holds interesting implications, especially in view of the recently reported increased levels of CXCR5+ Tfh-like cells in PB from CLL patients.23 Because Tfh differentiation and maintenance has been described to be dependent on the interaction with B cells,41 it might well be that the interaction of T cells with CLL cells leads to this increase in Tfh-like cells.
It has recently become evident that high levels of proliferation of the leukemic population in CLL are correlated with worse prognosis.42 The circulating Ki-67 index in plasma significantly correlated with lymph node involvement and high values of this index were associated with shorter survival.43 The recently reported antigen-independent propensity for autonomous BCR signaling might be a crucial contribution to proliferation in CLL.11 Of note, although BCRs cloned from CLL samples generated clear autonomous Ca2+ signals, these were well below the levels observed upon BCR triggering. Because it is well known that CLL cells cannot proliferate without external stimuli in vitro, it is not likely that low-level autonomous Ca2+ fluxes are themselves sufficient to drive proliferation in vivo. Therefore, additional mechanisms, possibly involving T-cell-mediated CD40 and IL-21 signaling, might play a supplemental role.
In this work, we have shown that stimulation with Tact and in particular CD40 + IL-21 is sufficient to induce antigen-independent proliferation of CLL cells. We also found strong indications for IL-21 signaling in LN from CLL patients. This would suggest that therapies aimed at blocking IL-21 signaling, in combination with other cytotoxic drugs, could help decrease CLL burden.
The online version of this article contains a data supplement.
The publication costs of this article were defrayed in part by page charge payment. Therefore, and solely to indicate this fact, this article is hereby marked “advertisement” in accordance with 18 USC section 1734.
Acknowledgments
We thank the patients for donating blood and participating in these studies. We are grateful for the technical assistance with microarrays and data analysis from Peter G. van Sluis and Richard Volckmann from the Department of Oncogenomics at the Academisch Medisch Centrum and Chris van der Loos from the Department of Pathology for his help with immunohistochemistry. Emilie Reinen assisted with FACS analyses and IL-21 staining in PB and LN samples.
This work was supported by Dutch Cancer Foundation grant UVA 2007-3856 to J.M.T., E.E., and M.H.V.O.
Authorship
Contribution: M.F.P. designed and performed research, interpreted data, and wrote the manuscript; M.J. and J.M.T. designed and performed research and collected and interpreted data; E.B.M.R., R.T., M.H.A.v.A., G.G.v.B., and I.A.M.D. designed and performed experiments; D.M.L. collected patient samples and information; M.H.J.v.O., S.T.P., R.A.W.v.L., and A.P.K. designed and supervised experiments and interpreted data; and E.E. designed and supervised experiments, interpreted data, and wrote the manuscript.
Conflict-of-interest disclosure: The authors declare no competing financial interests.
The current affiliation for R.A.W.v.L. is Sanquin Blood Supply, Divison of Research, Plesmanlaan 125, 1066CX Amsterdam, The Netherlands.
Correspondence: Eric Eldering, Department of Experimental Immunology, Academic Medical Center, Meibergdreef 9, 1105AZ Amsterdam, The Netherlands; e-mail: e.eldering@amc.uva.nl.
References
Author notes
M.J. and J.M.T. contributed equally to this study.

