Key Points
The combination of 3 core cis-elements represents the lineage-specific regulatory function of the Gata1 gene regulatory region.
Gata1 gene expression is inactivated in HSCs by the cis-repressive activity of a 3.2-kb element in the upstream Gata1 gene regulatory region.
Abstract
GATA1 is a master regulator of hematopoietic differentiation, but Gata1 expression is inactivated in hematopoietic stem cells (HSCs). Using a bacterial artificial chromosome containing the Gata1 gene modified with green fluorescent protein (GFP) reporter, we explored the function of the 3.7-kb Gata1 upstream region (GdC region) that harbors 3 core cis-elements: Gata1 hematopoietic enhancer, double GATA-motif, and CACCC-motif. Transgenic GFP expression directed by the Gata1-BAC faithfully recapitulated the endogenous Gata1 expression pattern. However, deletion of the GdC-region eliminated reporter expression in all hematopoietic cells. To test whether the combination of the core cis-elements represents the regulatory function of the GdC-region, we replaced the region with a 659-bp minigene that linked the three cis-elements (MG-GFP). The GFP reporter expression directed by the MG-GFP BAC fully recapitulated the erythroid-megakaryocytic Gata1 expression. However, the GFP expression was aberrantly increased in the HSCs and was associated with decreases in DNA methylation and abundant GATA2 binding to the transgenic MG-GFP allele. The 3.2-kb sequences interspaced between the Gata1 hematopoietic enhancer and the double GATA-motif were able to recruit DNA methyltransferase 1, thereby exerting a cis-repressive function in the HSC-like cell line. These results indicate that the 3.2-kb interspacing sequences inactivate Gata1 by maintaining DNA-methylation in the HSCs.
Introduction
Transcription factor GATA1 recognizes GATA motifs and promotes erythro-megakaryocytic differentiation by regulating a series of target genes.1 Previous analysis of Gata1-mutant mice has demonstrated that GATA1 is required for maintenance of the hematopoietic system.2-4 GATA1 is abundantly expressed in erythro-megakaryocytic lineages, whereas Gata1 gene expression is suppressed to a low level in hematopoietic stem cells (HSCs) and progenitor cell fractions (HPCs).5-7 The forced retroviral expression of GATA1 in HSCs leads to the loss of self-renewal activity and the exclusive generation of megakaryo-erythroid progenitors (MEPs).8 Gata1 gene inactivation is therefore crucial for the maintenance of HSCs. DNA methylation is distributed across the Gata1 locus in both HSCs and HPCs, suggesting that DNA methylation may participate in Gata1 gene inactivation in the HSCs and HPCs.9 However, the precise regulatory mechanism underlying the DNA methylation in the Gata1 locus remains unknown.
Earlier studies with reporter transfection assays revealed several proximal cis-elements in the 5′-flanking region of the hematopoietic cell-specific Gata1 IE promoter.10,11 These elements include a palindromic double-GATA motif (dbG, −680 to −672 bp) and a CACCC motif (−196 to −192 bp), both of which are essential for erythroid cell-specific Gata1 expression.10,11 In addition, the Gata1 gene hematopoietic enhancer (G1HE) is indispensable for erythroid cell−specific gene expression.6,12-14 These cis-acting elements are located in the 3.7-kb 5′-region of Gata1 gene (GdC-region). In an effort to isolate the minimal cis-elements sufficient for the Gata1 expression, we found that the 659-bp GdC-minigene fragment containing core sequences of these cis-acting regions (ie, G1HE, double GATA and CACCC motifs) is sufficient to direct hematopoietic cell-specific GATA1 expression in mouse embryos.15
During erythroid differentiation, GATA1 expression is increased from the common myeloid progenitor (CMP) and it peaks at the proerythroblast (ProEB) stage.5,6 Transgenic green fluorescent protein (GFP) reporter expression under the regulatory influence of a 196-kb Gata1 bacterial artificial chromosome (BAC) faithfully recapitulates the lineage- and stage-specific expression profile of the endogenous Gata1 gene.6 Therefore, the Gata1 BAC-GFP (G1B-GFP) reporter transgenic system provides a useful platform for understanding the Gata1 gene regulatory mechanism.
Taking advantage of this BAC reporter system, we demonstrate that the 659-bp GdC-minigene fragment is capable of functionally replacing the 3.7-kb GdC-region by directing erythro-megakaryocytic Gata1 gene expression. Furthermore, we reveal that the 3.2-kb internal sequence within the GdC-region carries a cis-regulatory repressive function that inactivates Gata1 gene expression in the HSCs and HPCs fraction, which operates by maintaining the DNA-methylation status.
Methods
BAC modification and the generation of BAC transgenic mice
Experimental procedures are approved by the Institutional Animal Experiment Committee of the Tohoku University. GFP modification of the Gata1 BAC clone (RP23-443E19) and generation of BAC transgenic mice have been described previously.6 Details of the BAC modification process are described in supplemental Figure 1 and the supplemental Methods; see the Blood Web site.
Plasmid construction and reporter transfection analysis
Details of the plasmid construction and the transfection analyses are described in the supplemental Methods.
Flow cytometry analysis
Cell sorting and associated analyses were performed via use of the FACS Aria and FACS Caliber (BD Biosciences) as previously described.6
Quantitative real-time reverse-transcription polymerase chain reaction (qRT-PCR)
qRT-PCR analysis was performed using 2X SYBR Green Master Mix (Nippon Gene) and ABI PRISM 7300 sequence detector system (Applied Biosystems) as previously described.6 All primer sequences are described in supplemental Table 1.
Cell culture
An embryonic stem cell-derived HPC line (A6 cells) and a murine erythroleukemia cell line (MEL) were used. The A6 cells were immunoreactivity-positive for HSC or progenitor markers, but the cells were negative for differentiated hematopoietic cell markers.16
Chromatin immunoprecipitation
Chromatin immunoprecipitation (ChIP) analysis was performed using c-Kit−positive progenitors, Ter119-positive erythroblasts, and A6 and MEL cells as previously described.17 Details of the ChIP analysis are described in the supplemental Methods.
Methylated DNA immunoprecipitation
Methylated DNA immunoprecipitation (MeDIP) analysis was performed with c-Kit−positive progenitors, Ter119-positive erythroblasts, and A6 and MEL cells as previously described.18 Details of the MeDIP analysis are described in the supplemental Methods.
Bisulfite sequence
Bisulfite treatment and sample recovery were performed with the MethylEasy Xceed Rapid DNA Bisulphite Modification Kit, according to manufacturer’s instructions (Human Genetic Signatures). Primer pairs used for nested PCR amplification of the bisulfite-treated DNA are listed in supplemental Table 2.
Results
GdC-region is essential for Gata1 gene expression in the hematopoietic system
To address how the GdC region contributes to Gata1 gene expression, we assessed the necessity of the 3.7-kb GdC region in the context of the G1B-GFP transgene (Figure 1A). For this purpose, we deleted the GdC region from the G1B-GFP transgene but left the 192-bp sequence 5′ to the IE promoter intact (Figure 1A; supplemental Figure 1), then generated three lines of BAC transgenic mice (ΔGdC-GFP line 32; 2 copies, line 561; 2 copies, line 995; 3 copies; supplemental Figure 2).
The GdC region is required for Gata1 gene activation in the hematopoietic system. (A) Structure of the intact Gata1 BAC, endogenous Gata1 locus, and a series of modified BAC reporters. The 3 regulatory elements are shown as black (G1HE), gray (dbG), and white rectangles (CACCC). The horizontal arrows depict the 3.7-kb GdC-region and the 659-bp minigene. The number of GFP-positive transgenic lines among the total transgenic lines (GFP/Tg) is indicated. (B) GFP histograms of whole bone marrow cells from G1B-GFP mouse (line 392; 2 copies) showed 25.4% of GFP-positive cells. GFP-positive cell population is significantly diminished (0.3%) in the ΔGdC-GFP mice (line 32; 2 copies), whereas the GFP-positive cell population is restored to a normal level (23.6%) in the MG-GFP mice (line 19; 2 copies). (C) Fluorescence images of E14.5 whole embryos. ΔGdC-GFP embryos rarely show GFP fluorescence, whereas the GFP fluorescence is recovered in the MG-GFP embryos (line 19; 2 copies), as observed in the G1B-GFP embryo (line 392; 2 copies).
The GdC region is required for Gata1 gene activation in the hematopoietic system. (A) Structure of the intact Gata1 BAC, endogenous Gata1 locus, and a series of modified BAC reporters. The 3 regulatory elements are shown as black (G1HE), gray (dbG), and white rectangles (CACCC). The horizontal arrows depict the 3.7-kb GdC-region and the 659-bp minigene. The number of GFP-positive transgenic lines among the total transgenic lines (GFP/Tg) is indicated. (B) GFP histograms of whole bone marrow cells from G1B-GFP mouse (line 392; 2 copies) showed 25.4% of GFP-positive cells. GFP-positive cell population is significantly diminished (0.3%) in the ΔGdC-GFP mice (line 32; 2 copies), whereas the GFP-positive cell population is restored to a normal level (23.6%) in the MG-GFP mice (line 19; 2 copies). (C) Fluorescence images of E14.5 whole embryos. ΔGdC-GFP embryos rarely show GFP fluorescence, whereas the GFP fluorescence is recovered in the MG-GFP embryos (line 19; 2 copies), as observed in the G1B-GFP embryo (line 392; 2 copies).
Flow cytometry analysis revealed that all four lines of control G1B-GFP transgenic mice had a high percentage of GFP-positive populations in the whole bone marrow cells (25.4% in line 392; 2 copies; Figure 1B).6 In contrast, all 3 ΔGdC-GFP mouse lines failed to express GFP fluorescence, indicating that the GdC-region is required for Gata1 expression in the hematopoietic system.
To test whether the GdC-region could be replaced by the GdC-minigene, the ΔGdC-GFP transgene was further modified with the insertion of the 659-bp GdC-minigene fragment 5′ adjacent to the IE-promoter region (MG-GFP; Figure 1A). We generated 3 lines of BAC transgenic mice bearing this construct (line 19, 20, and 33; all the 3 lines carry 2 copies; supplemental Figures 2-3). The insertion of the GdC-minigene fragment virtually restored the GFP expression to a normal level in whole bone marrow (Figure 1B), indicating that the 659-bp GdC-minigene contains the important cis-regulatory activation functions of the 3.7-kb GdC region. Because all 3 lines of MG-GFP mice exhibited similar pattern of GFP expression, we showed data from the lines 19 and/or 20 as representatives in the subsequent analyses. E14.5 G1B-GFP embryos showed abundant GFP expression in the fetal-liver hematopoietic cells, whereas GFP expression was completely abolished in the embryos of all 3 ΔGdC-GFP transgenic lines (Figure 1C). The GFP fluorescence level in the fetal-liver hematopoietic cells of the MG-GFP embryos was comparable with that of the G1B-GFP embryos. These results demonstrate that the insertion of the GdC-minigene into the ΔGdC-GFP transgene can reconstitute Gata1 gene regulatory activity in the majority of hematopoietic cells.
The GdC-minigene retains the enhancer activity of erythroid-megakaryocytic lineages
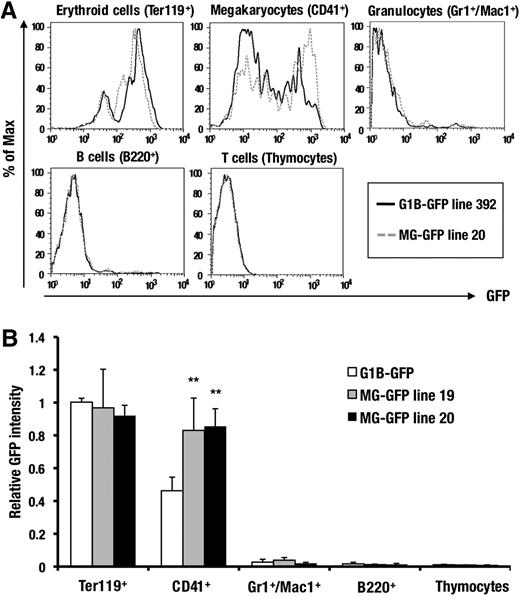
To determine whether MG-GFP can faithfully recapitulate the hematopoietic lineage-specific expression of GATA1, we examined the GFP fluorescence in each hematopoietic cell lineage. The control G1B-GFP mice showed GFP expression in most of the Ter119-positive erythroblasts and CD41-positive megakaryocytes, whereas the GFP-reporter expression was barely detected in the other lineages, reflecting the endogenous GATA1 expression (Figure 2A). MG-GFP mice displayed a similar GFP expression profile. The intensity of GFP in the MG-GFP mice was comparable with that of G1B-GFP control mice in the erythroid cells but was slightly greater than that of control in the megakaryocytic lineage cells (Figure 2A-B), indicating that the GdC-minigene in the Gata1-BAC backbone is responsible for the hematopoietic lineage-specific expression of Gata1 BAC transgene.
The combination of G1HE, dbG, and CACCC is sufficient for the lineage-specific enhancer activity of the GdC region. (A) A comparison of the GFP histogram of the lineage-committed hematopoietic cells from the bone marrow of the G1B-GFP (line 392; black) and MG-GFP (line 20; gray) transgenic mice. The Ter119-positive erythroblasts, CD41-positive megakaryocytes, Gr1/Mac1-double positive granulocytes, and B220-positive B cells are derived from adult bone marrow. The CD4/8-double positive T cells are derived from the thymus. (B) A comparison of the relative GFP mean intensity of the lineage-committed hematopoietic cells between the MG-GFP line 19 (n = 6), line 20 (n = 5), and G1B-GFP line 392 (n = 8), with an equal transgene copy number (2 copies). Data are presented as the mean ± SD. The statistical significance of differences between G1B-GFP and MG-GFP transgenic mice are indicated (**P < .01; Student unpaired t test).
The combination of G1HE, dbG, and CACCC is sufficient for the lineage-specific enhancer activity of the GdC region. (A) A comparison of the GFP histogram of the lineage-committed hematopoietic cells from the bone marrow of the G1B-GFP (line 392; black) and MG-GFP (line 20; gray) transgenic mice. The Ter119-positive erythroblasts, CD41-positive megakaryocytes, Gr1/Mac1-double positive granulocytes, and B220-positive B cells are derived from adult bone marrow. The CD4/8-double positive T cells are derived from the thymus. (B) A comparison of the relative GFP mean intensity of the lineage-committed hematopoietic cells between the MG-GFP line 19 (n = 6), line 20 (n = 5), and G1B-GFP line 392 (n = 8), with an equal transgene copy number (2 copies). Data are presented as the mean ± SD. The statistical significance of differences between G1B-GFP and MG-GFP transgenic mice are indicated (**P < .01; Student unpaired t test).
Interspacing sequences between the cis-elements are essential for Gata1 gene inactivation in HSCs
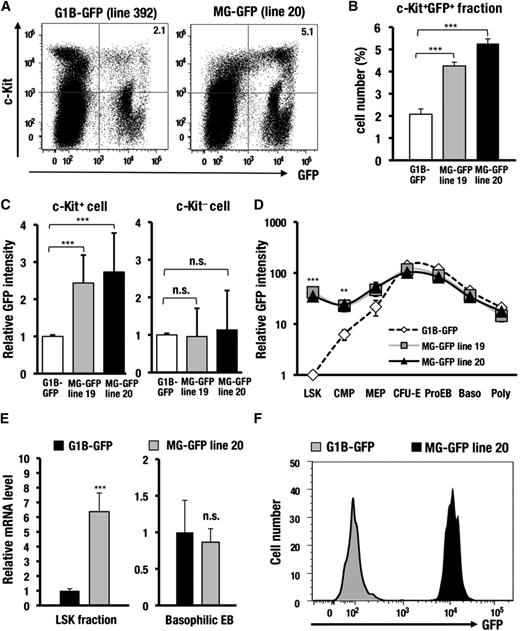
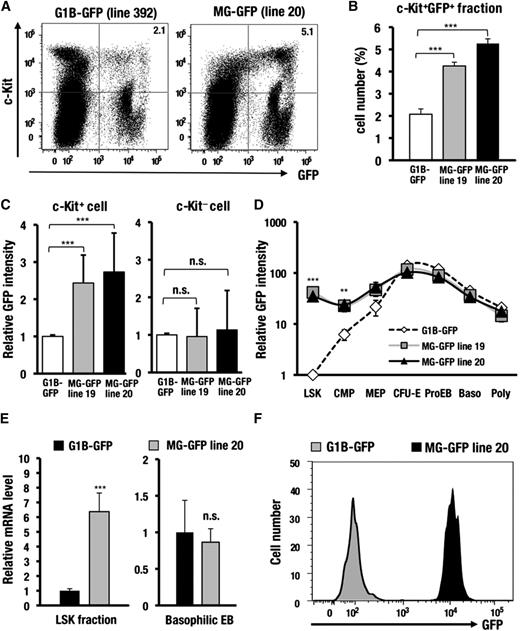
We next examined the stage-specificity of GFP expression during hematopoietic cell differentiation. Notably, the c-Kit−positive progenitors from the MG-GFP bone marrow cells showed a significant increase in the GFP-positive population compared with the G1B-GFP control mice (2.1∼2.7-fold; Figure 3A-B; supplemental Figure 4). Mean GFP fluorescence intensity also was increased in the MG-GFP mice compared with the G1B-GFP control mice (2.4∼2.6-fold; Figure 3C). In contrast, the GFP expression profile was not affected in the c-Kit−negative differentiated hematopoietic cells in the MG-GFP mice (Figure 3C).
The interspacing sequences between the 3 cis-elements in the GdC-region are required for the inactivation of Gata1 gene expression in HSCs. (A) GFP and c-Kit expression profiles in the bone marrow cells of the G1B-GFP (line 392) and MG-GFP (line 20) mice. (B) Percentages of the GFP-positive fraction within the c-Kit−positive progenitors in the MG-GFP line 19 (n = 5), line 20 (n = 4), and G1B-GFP line 392 (n = 9) transgenic mice. (C) The relative mean GFP intensity in the c-Kit−positive or c-Kit−negative fraction of the MG-GFP line 19 (n = 8), line 20 (n = 8), and G1B-GFP line 392 (n = 10) transgenic mice. (D) The relative GFP intensity during erythroid cell differentiation in the MG-GFP lines 19 (n = 4), line 20 (n = 4), and in the G1B-GFP line 392 (n = 6) transgenic mice. The X-axis indicates each stage of erythroid cell differentiation. LSK: Lin−Sca1+c-Kit+, fraction-containing HSCs, CMPs, MEPs, colony-forming unit-erythroid (CFU-E) stage cells, ProEB, basophilic erythroblast (Baso), and polychromatic erythroblast (Poly). (E) GFP mRNA expression analyzed by qRT-PCR in the LSK fraction (n = 9) or basophilic EB fraction (n = 6). The qRT-PCR results are normalized according to the glyceraldehydes-3-phosphate dehydrogenase level. (F) GFP histogram of the LSKS (Lin−Sca1+c-Kit+CD150+CD48−) fraction. The depicted histogram is from a representative experiment that was repeated more than 3 times. Data are presented as the mean ± SD. The statistical significance of differences is indicated (***P < .001; **P < .01; n.s., not significant; Student unpaired t test).
The interspacing sequences between the 3 cis-elements in the GdC-region are required for the inactivation of Gata1 gene expression in HSCs. (A) GFP and c-Kit expression profiles in the bone marrow cells of the G1B-GFP (line 392) and MG-GFP (line 20) mice. (B) Percentages of the GFP-positive fraction within the c-Kit−positive progenitors in the MG-GFP line 19 (n = 5), line 20 (n = 4), and G1B-GFP line 392 (n = 9) transgenic mice. (C) The relative mean GFP intensity in the c-Kit−positive or c-Kit−negative fraction of the MG-GFP line 19 (n = 8), line 20 (n = 8), and G1B-GFP line 392 (n = 10) transgenic mice. (D) The relative GFP intensity during erythroid cell differentiation in the MG-GFP lines 19 (n = 4), line 20 (n = 4), and in the G1B-GFP line 392 (n = 6) transgenic mice. The X-axis indicates each stage of erythroid cell differentiation. LSK: Lin−Sca1+c-Kit+, fraction-containing HSCs, CMPs, MEPs, colony-forming unit-erythroid (CFU-E) stage cells, ProEB, basophilic erythroblast (Baso), and polychromatic erythroblast (Poly). (E) GFP mRNA expression analyzed by qRT-PCR in the LSK fraction (n = 9) or basophilic EB fraction (n = 6). The qRT-PCR results are normalized according to the glyceraldehydes-3-phosphate dehydrogenase level. (F) GFP histogram of the LSKS (Lin−Sca1+c-Kit+CD150+CD48−) fraction. The depicted histogram is from a representative experiment that was repeated more than 3 times. Data are presented as the mean ± SD. The statistical significance of differences is indicated (***P < .001; **P < .01; n.s., not significant; Student unpaired t test).
To clarify which hematopoietic progenitor fraction was responsible for the aberrant GFP expression, we separated the whole bone marrow cells into HSCs (LSK; Lin−Sca1+c-Kit+) and HPCs, including CMPs, megakaryo-erythroid progenitors (MEPs), colony-forming unit-erythroid stage cells, as well as each stage of erythroblast.7,19,20 Surprisingly, the MG-GFP mice showed 34.7-fold brighter GFP fluorescence in the LSK fraction compared with the G1B-GFP control mice (Figure 3D). The intensity of GFP fluorescence was also increased in the CMP (3.9-fold) and MEP (2.4-fold) fractions of the MG-GFP mice (Figure 3D). GFP mRNA abundance in the LSK fraction of the MG-GFP mice was increased 6.4-fold relative to that of the G1B-GFP mice (Figure 3E). Closer analysis revealed that majority of long-term (LT)-HSC-enriched fraction, ie, LSK CD34-negative or LSKS (Lin−Sca1+c-Kit+CD150+ CD48−), in the MG-GFP mice expressed a high level of GFP, whereas the LT-HSC-fractions in the control G1B-GFP mice barely expressed GFP fluorescence (Figure 3F; supplemental Figure 4). By contrast, in the differentiated Ter119+/CD71+ erythroblasts, both MG-GFP and G1B-GFP mice comparably produced GFP fluorescence and transcript (Figure 3D-E). These results demonstrate that the interspacing sequences between the 3 cis-elements, which are deleted in the MG-GFP allele, are endowed with a crucial function for Gata1 gene inactivation in HSCs.
DNA hypomethylation in the MG-GFP allele of HSCs
We surmised that the interspacing sequences exert a potential cis-repressive function that inactivates Gata1 gene expression in HSCs or HPCs and that the deletion of these sequences abrogated the negative regulation, leading to the aberrant GFP expression in the MG-GFP mice. Expression of many types of lineage-affiliated genes is epigenetically inactivated in HSCs or HPCs to maintain their multipotency.21-23 In addition, the 5′ IE-promoter region of Gata1 gene has been found to be highly methylated in HSCs and HPCs.9 Therefore, one plausible explanation for the observed aberrant GFP expression is a decrease in the DNA methylation of the Gata1 enhancer region of the transgenic MG-GFP allele.
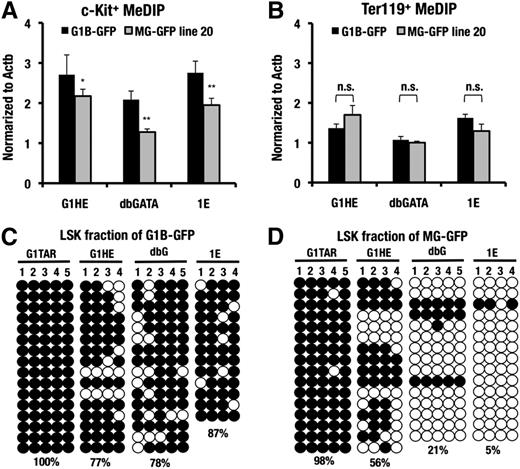
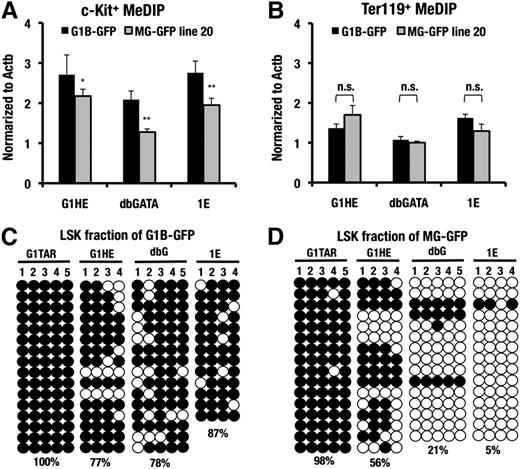
To explore this possibility, we first conducted MeDIP analysis at the G1HE, dbG, and IE exons of the MG-GFP and G1B-GFP transgenic mice harboring an equal copy number (2 copies). The 3 regulatory regions of the Gata1 locus were highly methylated in the c-Kit−positive progenitors of the control G1B-GFP mice (Figure 4A). However, the MG-GFP transgenic allele showed a decreased level of DNA methylation in these sites of the c-Kit-positive progenitors. Of note, the DNA methylation level was comparable between the G1B-GFP and MG-GFP transgenic alleles in the Ter119-positive erythroblasts (Figure 4B), consistent with the comparable GFP fluorescence levels (Figure 3D-E).
DNA hypomethylation around the minigene locus of HSCs. (A-B) MeDIP assay of the G1HE, dbG, and IE promoter regions in the sorted c-Kit−positive progenitor cells and the Ter119-positive erythroblasts from the G1B-GFP line 392 and the MG-GFP line 20 transgenic mice. The data are normalized to the DNA methylation level at the Actb locus. A representative dataset from these experiments, which were repeated 3 times, is shown. The statistical significance of differences is indicated (**P < .01; *P < .05; n.s., not significant; Student unpaired t test). (C-D). Bisulfite sequencing analysis of the G1TAR, G1HE, dbG, and IE promoter regions in the sorted LSK fraction of the G1B-GFP line 392 and the MG-GFP line 20 transgenic mice, respectively. The numbers indicate each CpG motif in the each regulatory region. Both methylated (filled circles) and unmethylated (open circles) CpG motifs are depicted. The DNA methylation ratio of the each locus is denoted by the percentage.
DNA hypomethylation around the minigene locus of HSCs. (A-B) MeDIP assay of the G1HE, dbG, and IE promoter regions in the sorted c-Kit−positive progenitor cells and the Ter119-positive erythroblasts from the G1B-GFP line 392 and the MG-GFP line 20 transgenic mice. The data are normalized to the DNA methylation level at the Actb locus. A representative dataset from these experiments, which were repeated 3 times, is shown. The statistical significance of differences is indicated (**P < .01; *P < .05; n.s., not significant; Student unpaired t test). (C-D). Bisulfite sequencing analysis of the G1TAR, G1HE, dbG, and IE promoter regions in the sorted LSK fraction of the G1B-GFP line 392 and the MG-GFP line 20 transgenic mice, respectively. The numbers indicate each CpG motif in the each regulatory region. Both methylated (filled circles) and unmethylated (open circles) CpG motifs are depicted. The DNA methylation ratio of the each locus is denoted by the percentage.
Bisulfite sequencing analysis of the three regulatory regions of the LSK fraction supported these data. The G1HE, dbG, and IE regions were highly methylated in the control G1B-GFP transgenic mice (Figure 4C). In contrast, the methylation level of these regions was decreased in the MG-GFP transgenic allele (Figure 4D). These results indicate the tight correlation between the GFP-reporter expression and the DNA methylation status of the three regulatory regions. Additional bisulfite sequencing analyses in the testis-specific Gata1 regulatory region at the 4.0-kb upstream region (G1TAR)24 revealed that G1TAR was highly methylated both in G1B-GFP and MG-GFP mice. This result indicates that the G1TAR is constitutively methylated regardless of the presence or absence of the interspacing sequences in the LSK fraction (Figure 4C-D).
Recruitment of DNA methyltransferase 1 (Dnmt1) to the Gata1 locus
Dnmt1 is essential for maintenance of DNA methylation status and abundantly expressed in HSCs.25 Dnmt1 hypomorphic mutant mice exhibit a decrease in the HSC population, and this decrease is associated with the aberrant expression of myeloerythroid regulators, including GATA1.26 Hence, we next addressed Dnmt1 recruitment to the Gata1 locus by exploiting A6 and MEL cells. A6 cells are an embryonic stem cell-derived HSC-like cell line.16 A6 cells express a series of authentic HSC markers, including c-Kit, CD34, Sca1, and GATA2, whereas the expression of the lineage-affiliated genes, such as GATA1 and PU.1, is largely inactivated (Figure 5C; supplemental Figure 5).16
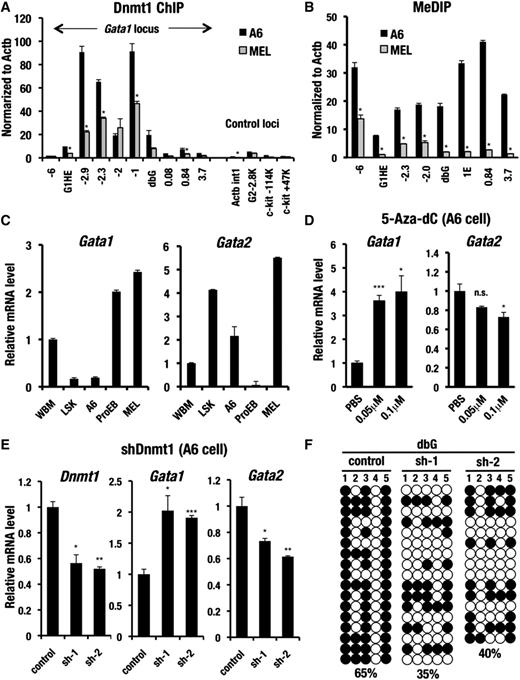
Dnmt1 directly binds to the Gata1 locus and promotes Gata1 gene inactivation in A6 cells. (A) Dnmt1 ChIP assay with A6 and MEL cells. The PCR amplifications of the c-Kit, Gata2, and first intron of Actb (Actb int1) genomic regions were used as negative controls. The data are normalized to the level of DNA methylation at the Actb promoter locus. (B) MeDIP assay with A6 and MEL cells. The data are normalized to the level of DNA methylation at the Actb promoter locus. (C) Gata1 and Gata2 mRNA levels analyzed by qRT-PCR in whole bone marrow cells (WBM), the bone marrow LSK fraction, the A6 cells, and the bone marrow ProEB and MEL cells. The results of the qRT-PCR are normalized to glyceraldehydes-3-phosphate dehydrogenase level. (D) Gata1 and Gata2 mRNA levels in the A6 cells determined by qRT-PCR 96 hours after treatment with PBS and 0.05 or 0.1 μM of 5-Aza-dC. (E) Relative mRNA level of Dnmt1, Gata1, and Gata2 in the A6 cells transfected with shRNA targeting Dnmt1 (sh-1 or sh-2) or control shRNA. Results of the qRT-PCR are normalized to GAPDH level. (F) Effect of Dnmt1 knockdown on DNA methylation at the Gata1 dbG region. Bisulfite sequencing is performed using A6 cells transfected with shRNA targeting Dnmt1 (sh-1 or sh-2) or control shRNA. Both methylated (filled circles) and unmethylated (open circles) CpG motifs are depicted. The DNA methylation ratio of the each locus is denoted by the percentage. Data are presented as the mean ± SD with P values from the Student unpaired t test; ***P < .001; **P < .01; *P < .05; n.s., not significant).
Dnmt1 directly binds to the Gata1 locus and promotes Gata1 gene inactivation in A6 cells. (A) Dnmt1 ChIP assay with A6 and MEL cells. The PCR amplifications of the c-Kit, Gata2, and first intron of Actb (Actb int1) genomic regions were used as negative controls. The data are normalized to the level of DNA methylation at the Actb promoter locus. (B) MeDIP assay with A6 and MEL cells. The data are normalized to the level of DNA methylation at the Actb promoter locus. (C) Gata1 and Gata2 mRNA levels analyzed by qRT-PCR in whole bone marrow cells (WBM), the bone marrow LSK fraction, the A6 cells, and the bone marrow ProEB and MEL cells. The results of the qRT-PCR are normalized to glyceraldehydes-3-phosphate dehydrogenase level. (D) Gata1 and Gata2 mRNA levels in the A6 cells determined by qRT-PCR 96 hours after treatment with PBS and 0.05 or 0.1 μM of 5-Aza-dC. (E) Relative mRNA level of Dnmt1, Gata1, and Gata2 in the A6 cells transfected with shRNA targeting Dnmt1 (sh-1 or sh-2) or control shRNA. Results of the qRT-PCR are normalized to GAPDH level. (F) Effect of Dnmt1 knockdown on DNA methylation at the Gata1 dbG region. Bisulfite sequencing is performed using A6 cells transfected with shRNA targeting Dnmt1 (sh-1 or sh-2) or control shRNA. Both methylated (filled circles) and unmethylated (open circles) CpG motifs are depicted. The DNA methylation ratio of the each locus is denoted by the percentage. Data are presented as the mean ± SD with P values from the Student unpaired t test; ***P < .001; **P < .01; *P < .05; n.s., not significant).
A6 and MEL cell lines expressed a comparable level of Dnmt1 protein (supplemental Figure 5). However, ChIP analyses revealed that Dnmt1 was highly accumulated in the vicinity of Gata1 locus in A6 cells, whereas MEL cells exhibited a low level of Dnmt1 binding in the Gata1 locus (Figure 5A). The most dramatic Dnmt1 accumulation occurred around the interspacing sequences between the G1HE and the double GATA sites in A6 cells. Consistent with this Dnmt1 binding pattern, MeDIP analyses demonstrated that the Gata1 locus was extensively methylated in the A6 cells, whereas MEL cells showed a low level of methylation (Figure 5B). Indeed, GATA1 transcript level was diminished in the A6 cells as well as LSK fraction, whereas GATA1 expression in the MEL cells reached a high level, as did the ProEB fraction (Figure 5C).
To confirm a functional contribution of Dnmt1 to Gata1 gene inactivation, we treated the A6 cells with 5-aza-2′-deoxycytidine (5-Aza-dC), a potent inhibitor of Dnmt1. Upon 5-Aza-dC treatment, Gata1 expression was increased up to 4-fold, whereas Gata2 expression was decreased by 28% (Figure 5D). Consistent with this increase of Gata1 expression, the methylation level of G1HE and dbG regions was decreased in the 5-Aza-dC−treated A6 cells (supplemental Figure 6). Meanwhile, Gata1 expression level was not substantially changed in the 5-Aza-dC−treated MEL cells (supplemental Figure 7A).
We also conducted shRNA-mediated stable Dnmt1 knockdown by using A6 cells, which led to a maximally 48% decrease of Dnmt1 mRNA expression (Figure 5E). In the shDnmt1 A6 cells Gata1 mRNA expression was increased 1.9-fold, whereas Gata2 mRNA expression was diminished by 37%. This increase in Gata1 mRNA expression was associated with the decreased DNA methylation in the G1HE and dbG regions of Gata1 locus (Figure 5F; data not shown). Meanwhile, Gata1 mRNA expression was not significantly changed in the shDnmt1 MEL cells (63% knockdown of Dnmt1 mRNA level; supplemental Figure 7B). Because the Gata1 gene was highly expressed and was associated with DNA hypomethylation in MEL cells, Dnmt1 knockdown might not be linked to the increase of Gata1 expression any more. The low level of Dnmt1 binding to Gata1 locus in the MEL cells shows good agreement with this notion (Figure 5A).
We therefore surmise that Gata1 gene expression is inactivated by DNA methylation in the HSCs and HPCs, in which the methylation status of Gata1 gene is maintained through the recruitment of Dnmt1 to the interspacing sequences between the G1HE and double GATA sites. A novel type of cis-regulatory sequence has been proposed that is responsible for maintenance of DNA methylation status in suppressed gene loci. This type of sequence has been referred to as a methylation-determining region (MDR).27 Because the 3.2-kb sequence between G1HE and dbG appears to be crucial for maintaining the DNA methylation status in the Gata1 locus of the HSCs and HPCs, we have designated this 3.2-kb sequence as the Gata1 methylation-determining region (G1MDR).
G1MDR sequences suppress the Gata2-reporter gene expression in A6 cells
Because aberrant GFP expression was observed mainly in the HSCs and HPCs of the MG-GFP mice, we hypothesized that the G1MDR exerts a cis-silencing activity predominantly in the HSCs and HPCs. To address this issue, we used the Gata2-GFP construct harboring autoregulatory GATA-binding sites at 77, 2.8, and 1.8 kb upstream of Gata2 IS promoter (see the supplemental Methods). All of these GATA-binding sites are important for Gata2 gene expression in the HSCs and HPCs (Figure 6A).1
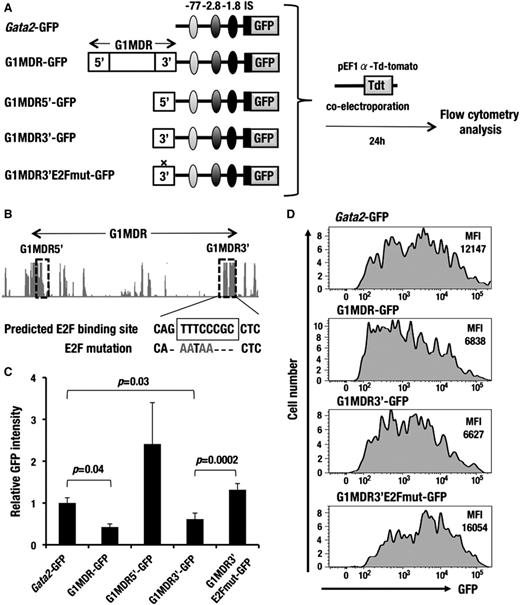
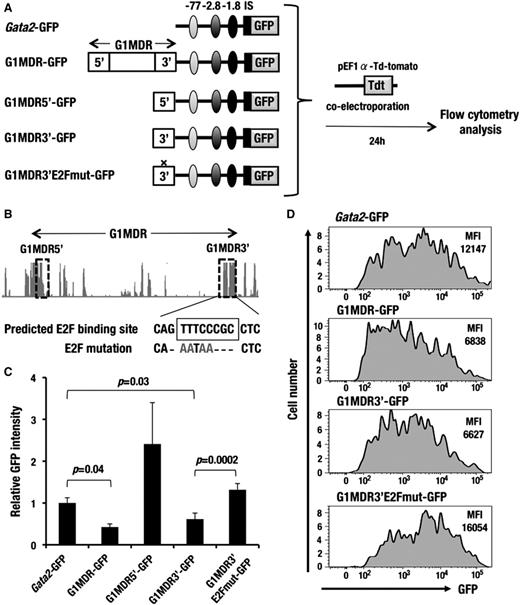
G1MDR sequences between G1HE and dbG exert a repressive function in A6 cells. (A) A schematic diagram depicting the assay system used to test the silencer activity of the 3.2-kb sequence between G1HE and dbG (G1MDR). Gata2-GFP, G1MDR-GFP, G1MDR5′-GFP, G1MDR3′-GFP, or G1MDR3′E2Fmut-GFP construct was introduced into A6 cells along with the tdTomato-expression reporter vector (red fluorescence reporter) by electroporation. Resulting GFP expression in the tdTomato-positive cells was analyzed by flow cytometry 24 hours after electroporation. Autoregulatory GATA-binding sites located 77 kb (light gray), 2.8 kb (dark gray), and 1.8 kb (black) upstream of the Gata2 gene are linked in the reporter constructs. IS depicts the hematopoietic cell-specific Gata2 promoter. (B) Genomic sequence conservation among mammalian species around G1MDR is derived from UCSC genome browser (http://genome.ucsc.edu/). The horizontal arrow denotes G1MDR. The dotted rectangles indicate the G1MDR5′ and G1MDR3′ regions. Conserved E2F binding sequences in the G1MDR3′ region is predicted in TRANSFAC database (https://portal.biobase-international.com). (C) Relative mean GFP intensity in the A6 cells introduced with Gata2-GFP, G1MDR-GFP, G1MDR5′-GFP, G1MDR3′-GFP, and G1MDR3′E2Fmut-GFP. Data are presented as the mean ± SD from 3 independent experiments with P values from a Student unpaired t test. (D) GFP histogram of the A6 cells introduced with the Gata2-GFP, G1MDR-GFP, G1MDR3′-GFP, and G1MDR3′E2Fmut-GFP. The mean fluorescence intensities (MFI) of GFP are analyzed by flow cytometry.
G1MDR sequences between G1HE and dbG exert a repressive function in A6 cells. (A) A schematic diagram depicting the assay system used to test the silencer activity of the 3.2-kb sequence between G1HE and dbG (G1MDR). Gata2-GFP, G1MDR-GFP, G1MDR5′-GFP, G1MDR3′-GFP, or G1MDR3′E2Fmut-GFP construct was introduced into A6 cells along with the tdTomato-expression reporter vector (red fluorescence reporter) by electroporation. Resulting GFP expression in the tdTomato-positive cells was analyzed by flow cytometry 24 hours after electroporation. Autoregulatory GATA-binding sites located 77 kb (light gray), 2.8 kb (dark gray), and 1.8 kb (black) upstream of the Gata2 gene are linked in the reporter constructs. IS depicts the hematopoietic cell-specific Gata2 promoter. (B) Genomic sequence conservation among mammalian species around G1MDR is derived from UCSC genome browser (http://genome.ucsc.edu/). The horizontal arrow denotes G1MDR. The dotted rectangles indicate the G1MDR5′ and G1MDR3′ regions. Conserved E2F binding sequences in the G1MDR3′ region is predicted in TRANSFAC database (https://portal.biobase-international.com). (C) Relative mean GFP intensity in the A6 cells introduced with Gata2-GFP, G1MDR-GFP, G1MDR5′-GFP, G1MDR3′-GFP, and G1MDR3′E2Fmut-GFP. Data are presented as the mean ± SD from 3 independent experiments with P values from a Student unpaired t test. (D) GFP histogram of the A6 cells introduced with the Gata2-GFP, G1MDR-GFP, G1MDR3′-GFP, and G1MDR3′E2Fmut-GFP. The mean fluorescence intensities (MFI) of GFP are analyzed by flow cytometry.
A6 cells were transiently transfected with either the Gata2-GFP or Gata2-GFP linked to the G1MDR (G1MDR-GFP; Figure 6A). To normalize the transfection efficiency, the A6 cells were simultaneously introduced with an expression vector for the orange-red fluorescent protein (tdTomato). At 24 hours after the transfection, we found that mean GFP fluorescence intensity in the tdTomato-positive cells was significantly decreased in the G1MDR-GFP−transfected A6 cells compared with the Gata2-GFP transfected A6 cells (Figure 6C-D). In contrast, we did not observe any similar cis-silencing activity of the G1MDR sequences in the MEL cells (supplemental Figure 7D-E). These results indicate that the 3.2-kb G1MDR sequences suppress the Gata2-GFP reporter expression predominantly in the HSCs and HPCs.
To further dissect specific regulatory sequences, we searched for interspecies similarity in the G1MDR fragment and found 2 evolutionary conserved regions at the 5′ and 3′ end of the G1MDR fragment (referred to as G1MDR5′ and G1MDR3′, hereafter; Figure 6B). We connected these 2 subfragments to the Gata2-GFP reporter and tested their cis-regulatory activity in A6 cells. Notably, we observed that the G1MDR3′ fragment exerted a similar level of cis-silencing activity as the 3.2-kb full-length G1MDR fragment showed (Figure 6C-D). In contrast, the G1MDR5′ fragment showed a positive cis-regulatory activity, although such an activity was not detected in the full-length G1MDR fragment (Figure 6C).
Because the G1MDR3′ sequences contain a conserved binding site for E2F transcription factor, we next tested consequences of substituted mutation of this E2F binding site in the A6 cell assay system (Figure 6B). The nucleotides substitution in the E2F-binding sequences markedly abolished the cis-silencing activity of the G1MDR3′ fragment (Figure 6C-D). Collectively, these observations suggest that the conserved E2F-binding site at the 3′ end of G1MDR is responsible for silencing of Gata1 gene in the HSCs and HPCs.
Repression of the GATA2-dependent enhancer activity of the GdC minigene by DNA methylation
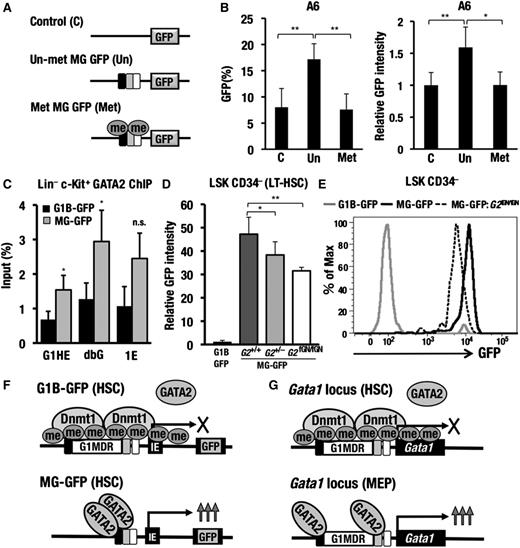
GATA2 positively regulates the early stages of Gata1 gene activation in hematopoietic progenitors.1,28,29 However, GATA1 expression is largely inactivated in the HSCs, despite the abundant expression of GATA2. Considering that the Gata1 locus is highly methylated in the LSK fraction, we surmised that the DNA methylation suppresses the GATA2-dependent enhancer activity of the Gata1 locus in the HSCs. To address this, we conducted a reporter assay by transfecting in vitro methylated or unmethylated GdC minigene into the A6 cells (Figure 7A). Preintroduced CpG methylation on the GdC minigene significantly diminished the GFP-reporter expression when normalized with the cotransfected tdTomato-fluorescence (Figure 7B). This result underscores the contribution of DNA methylation on the GdC-minigene to elimination of the GATA2-mediated enhancer activity.
DNA hypomethylation at the Gata1 locus leads to GATA2-mediated aberrant Gata1 gene activation. (A) The in vitro methylated 659-bp minigene fragment ligated to the GFP expression cassette. Methylated and unmethylated vectors were electroporated into A6 cells along with the tdTomato expression vector. (B) GFP expression in the tdTomato-positive cells analyzed by flow cytometry. The data are presented as the mean ± SD from 3 independent experiments. (C) The GATA2 ChIP assay with the c-Kit−positive bone marrow progenitors. A representative dataset from the experiments, which were repeated 3 times, is shown. (D) The relative GFP intensity in the LSK CD34-negative (LT-HSC) fraction of the G1B-GFP (n = 5), MG-GFP (n = 7), MG-GFP::Gata2+/− (n = 9) and MG-GFP::Gata2fGN/fGN (n = 3) mice. The data are presented as the mean ± SD. The statistical significance is indicated (**P < .01; *P < .05; n.s., not significant; Student unpaired t test). (E) A GFP histogram of the LSK CD34-negative fraction. Gray line, G1B-GFP (line 392); black line, MG-GFP (line 20); dotted line, MG-GFP::Gata2fGN/fGN (line 20). (F) Dnmt1 recruited to G1MDR sequences confers Gata1 gene inactivation by maintaining the CpG-methylation of the Gata1 gene enhancer sequences in the HSCs (upper diagram). The DNA hypomethylation in the MG-GFP transgenic allele increases GATA2-binding, thereby promoting abundant GFP expression in the HSCs (lower diagram). (G) A proposed model for the initiation of erythropoiesis through proper temporary-specific Gata1 gene regulation elicited by the GdC-region. In HSCs, the Gata1 gene is protected from GATA2-mediated Gata1 gene activation through DNA methylation, which in turn maintains the prematurity of the HSCs (upper diagram). When DNA methylation decreases, GATA2 transactivates the Gata1 gene expression to initiate erythropoiesis in the MEPs (lower diagram).
DNA hypomethylation at the Gata1 locus leads to GATA2-mediated aberrant Gata1 gene activation. (A) The in vitro methylated 659-bp minigene fragment ligated to the GFP expression cassette. Methylated and unmethylated vectors were electroporated into A6 cells along with the tdTomato expression vector. (B) GFP expression in the tdTomato-positive cells analyzed by flow cytometry. The data are presented as the mean ± SD from 3 independent experiments. (C) The GATA2 ChIP assay with the c-Kit−positive bone marrow progenitors. A representative dataset from the experiments, which were repeated 3 times, is shown. (D) The relative GFP intensity in the LSK CD34-negative (LT-HSC) fraction of the G1B-GFP (n = 5), MG-GFP (n = 7), MG-GFP::Gata2+/− (n = 9) and MG-GFP::Gata2fGN/fGN (n = 3) mice. The data are presented as the mean ± SD. The statistical significance is indicated (**P < .01; *P < .05; n.s., not significant; Student unpaired t test). (E) A GFP histogram of the LSK CD34-negative fraction. Gray line, G1B-GFP (line 392); black line, MG-GFP (line 20); dotted line, MG-GFP::Gata2fGN/fGN (line 20). (F) Dnmt1 recruited to G1MDR sequences confers Gata1 gene inactivation by maintaining the CpG-methylation of the Gata1 gene enhancer sequences in the HSCs (upper diagram). The DNA hypomethylation in the MG-GFP transgenic allele increases GATA2-binding, thereby promoting abundant GFP expression in the HSCs (lower diagram). (G) A proposed model for the initiation of erythropoiesis through proper temporary-specific Gata1 gene regulation elicited by the GdC-region. In HSCs, the Gata1 gene is protected from GATA2-mediated Gata1 gene activation through DNA methylation, which in turn maintains the prematurity of the HSCs (upper diagram). When DNA methylation decreases, GATA2 transactivates the Gata1 gene expression to initiate erythropoiesis in the MEPs (lower diagram).
To determine whether the methylation of Gata1 regulatory sequences decreases the GATA2 binding in the hematopoietic progenitors, we examined the GATA2 occupancy in the G1B-GFP and MG-GFP transgenic alleles of the c-Kit−positive progenitors by ChIP assay. We observed a 2∼3-fold increase in binding of GATA2 around the G1HE, dbG and IE exons of the MG-GFP allele compared with the intact G1B-GFP allele (Figure 7C). GATA2 activates its target gene expression by incorporating active chromatin configurations.30 Consistent with the increased GATA2-occupancy, greater levels of H3K4me2, H3K4me3, and H4 acetylation were found at the Gata1 locus of the MG-GFP transgenic allele than that of the intact G1B-GFP allele in the c-Kit−positive progenitors (supplemental Figure 8). In contrast, the accumulation of these positive histone markers was similar between the MG-GFP transgenic allele and the intact G1B-GFP allele in the Ter119-positive erythroblasts. Overall, these results indicate that the GdC-minigene fragment induces a hypomethylation in the Gata1 locus, which facilitates GATA2 binding and thus produces an active chromatin configuration in the c-Kit−positive HPCs.
Given the increased binding of GATA2 to the MG-GFP transgenic allele, we addressed whether the expression level of the MG-GFP transgene depended on the expression level of GATA2 in the c-Kit−positive progenitor cells. To this end, Gata2+/– mice were crossed with the MG-GFP mice, and bone marrows of the resulting Gata2+/–::MG-GFP compound mutant mice were subjected to flow cytometry analysis. In the Gata2 heterozygous background, the highly increased GFP fluorescence of the LT-HSC fraction of the MG-GFP mice was attenuated to 81% of the Gata2 wild-type background level (Figure 7D). To further demonstrate the GATA2-dependency, we used Gata2fGN/fGN hypomorphic mutant mice, in which GATA2 expression is systemically suppressed to 20% of that in the wild-type mice.31 Of note, the MG-directed GFP expression was even more significantly suppressed to approximately 67% in the LT-HSC fraction of the Gata2fGN/fGN::MG-GFP mice (Figure 7D-E). Collectively, these results indicate that the decreased DNA methylation of the MG-GFP transgenic allele induces the GATA2-mediated aberrant Gata1 gene promoter activation in HSCs (Figure 7F).
Discussion
In this study, we demonstrate that the 3.7-kb GdC region is indispensable for Gata1 expression and that the 659-bp GdC-minigene retains enhancer activity that is sufficient for hematopoietic lineage-specific Gata1 expression. Surprisingly, inserting the GdC-minigene hyperactivated the GFP expression in the c-Kit−positive fraction of MG-GFP mice. DNA methylation was reduced concomitantly in the MG-GFP allele, suggesting that the interspacing sequence between three cis-elements suppresses aberrant Gata1 gene expression in the progenitors by facilitating DNA methylation in Gata1 locus. These results indicate that Gata1 gene expression is under the positive or negative regulatory influences of the GdC region and that the interspacing regions between the 3 activating motifs exert a critical contribution to the latter’s activity.
Given that the MG-GFP−directed GFP expression is highly activated in the HSCs and HPCs fraction, we explored the mechanism underlying the Gata1 gene repression in these fractions. Mice transplanted with HSCs, in which GATA1 is forcibly expressed, are found to have an aberrant expansion of their MEP and red blood cell pool, underscoring the importance of Gata1 gene repression in HSCs.8,32 Our present results demonstrate that Gata1 locus is highly methylated in the HSC fraction and that Dnmt1 accumulates in the Gata1 locus of A6 cells. Methylation level of the Gata1 locus is substantially decreased at the MG-GFP allele, which is associated with an increase in Gata1 promoter activity. These results indicate that the Dnmt1-mediated methylation of Gata1 locus is essential for protection of HSCs from dysregulated differentiation and that the G1MDR sequences within the GdC-region are responsible for this epigenetic regulation.25
Currently, the most conclusive proof of cis-regulatory activity relies on targeted deletion of the element from endogenous locus. It is of interest to test whether targeted deletion of G1MDR from the Gata1 locus affects the gene expression. Meanwhile, it has been shown that G1BAC-GFP reporter transgenic mouse lines faithfully recapitulate the endogenous Gata1 expression and this was reproducible in our study.6 We also have analyzed multiple transgenic mouse lines for each construct and obtained consistent results. Therefore, although there still remains possibility that the GFP reporter expression may be under certain position effect variegation, it seems reasonable to conclude that our G1BAC-based analyses accurately reflect the cis-element activity and this BAC-reporter transgenic mouse analysis nicely complements the germ line targeting analysis.
In G1MDR3′, we found an evolutionary conserved E2F binding site crucial for cis-repressive activity of G1MDR. Because Dnmt1 forms a complex with Rb, E2F1, and HDAC1 and represses transcription from E2F-responsive promoters,33 we surmise that E2F1 binds to G1MDR, recruits Dnmt1-containing repressive complex, and suppresses the Gata1 expression. By contrast, G1MDR5′ exerts a positive cis-regulatory activity, but full-length G1MDR does not show such an activity. G1MDR5′ contains a conserved binding site for the Krüppel-like transcription factor ZBP89, an upstream regulator of Gata1 expression in the fetal liver erythroid cells.34 Therefore, we surmise that the ZBP89-mediated enhancer activity of G1MDR5′ may be attenuated by the repressive activity of G1MDR3′ in the A6 cells.
Gata1 gene expression is not activated in HSCs, despite abundant GATA2 expression in the HSCs.35,36 We found that in the MG-GFP mice, the aberrant GFP-reporter expression in the HSCs and HPCs was associated with an increased binding of GATA2 to the Gata1 locus. We believe that hypomethylation of the Gata1 gene regulatory region leads to the increased GATA2 binding in the HSCs and HPCs. Because several CpG motifs are located in close proximity to the autoregulatory GATA motifs in the G1HE and dbG sites, methyl-CpG-binding proteins, such as MeCP2, might repress the binding of GATA factors to the GATA sites in the HSCs. Consistent with this hypothesis, the in vitro methylation of the GdC minigene decreases the enhancer activity in the A6 cells, which express GATA2 abundantly. Moreover, the aberrant GFP expression observed in the MG-GFP mice depends on the abundance of GATA2. As summarized in Figure 7G, the GATA2-mediated Gata1 gene activation in the HSCs is repressed through DNA methylation of the Gata1 gene regulatory sequences. When hematopoietic differentiation is initiated, a decrease in the level of DNA methylation facilitates GATA2 binding and induces Gata1 gene expression.
It is globally assumed that leukemic stem cells are maintained by a mechanism similar to that for the maintenance of normal HSCs.37 Indeed, the Gata1 expression in several myeloid leukemia cell lines is suppressed by DNA methylation, while exogenous GATA1 transduction into these cells leads to growth inhibition.26,38 Altered DNA methylation are a hallmark of leukemic cells.39 Hence, DNA methyltransferase inhibitors have been used as therapeutics against hematologic neoplasia. According to our study, the de-repression of Gata1 gene expression by the administration of DNA methyltransferase inhibitors may shed light on the molecular basis of this type of leukemia chemotherapy.
The online version of this article contains a data supplement.
There is an Inside Blood commentary on this article in this issue.
The publication costs of this article were defrayed in part by page charge payment. Therefore, and solely to indicate this fact, this article is hereby marked “advertisement” in accordance with 18 USC section 1734.
Acknowledgments
We thank Dr Hozumi Motohashi and Ms Makiko Hayashi for their helpful discussion and assistance.
This study was supported in part by the Grants-in-Aids for Scientific Research for the Scientific Research on Priority Areas (to M.Y.), by Scientific Research (to T.M. and M.Y.), by Exploratory Research (to M.Y.) from the Ministry of Education, Science, Sports and Culture, Naito foundation (to M.Y.), and by the Takeda Foundation (to T.M. and M.Y.). This study was also supported by the Global-COE program to conquest disease through network medicine. We also thank the Biomedical Research Core of Tohoku University Graduate School of Medicine for its technical support.
Authorship
Contribution: J.T. performed experiments and contributed to the project design and manuscript preparation; T.M., M.S., and L.Y. performed the experiments; T.M., K.O., and M.Y. contributed to the project design and supervised the study; J.T., T.M., and M.Y. wrote the manuscript; and all authors contributed to the integration and discussion of the results.
Conflict-of-interest disclosure: The authors declare no competing financial interests.
Correspondence: Masayuki Yamamoto or Takashi Moriguchi, Department of Medical Biochemistry, Tohoku University Graduate School of Medicine, 2-1 Seiryo-machi, Aoba-ku, Sendai 980-8575, Japan; e-mail: masiyamamoto@med.tohoku.ac.jp or moriguch@med.tohoku.ac.jp.


