Key Points
Human blood BDCA-1+ DCs have precursor potential.
TSLP can be implicated in LC ontogenesis during inflammation.
Abstract
The ontogeny of human Langerhans cells (LCs) remains poorly characterized, in particular the nature of LC precursors and the factors that may drive LC differentiation. Here we report that thymic stromal lymphopoietin (TSLP), a keratinocyte-derived cytokine involved in epithelial inflammation, cooperates with transforming growth factor (TGF)-β for the generation of LCs. We show that primary human blood BDCA-1+, but not BDCA-3+, dendritic cells (DCs) stimulated with TSLP and TGF-β harbor a typical CD1a+Langerin+ LC phenotype. Electron microscopy established the presence of Birbeck granules, an intracellular organelle specific to LCs. LC differentiation was not observed from tonsil BDCA-1+ and BDCA-3+ subsets. TSLP + TGF-β LCs had a mature phenotype with high surface levels of CD80, CD86, and CD40. They induced a potent CD4+ T-helper (Th) cell expansion and differentiation into Th2 cells with increased production of tumor necrosis factor-α and interleukin-6 compared with CD34-derived LCs. Our findings establish a novel LC differentiation pathway from BDCA-1+ blood DCs with potential implications in epithelial inflammation. Therapeutic targeting of TSLP may interfere with tissue LC repopulation from circulating precursors.
Introduction
Langerhans cells (LCs) of the epidermis are the main antigen-presenting cells in stratified epithelia and play a major role in maintaining homeostasis,1,2 inducing a protective immune response to invading pathogens,3 and promoting and sustaining chronic inflammation.4,5 Given the importance of epithelia as a natural interface with the environment, it is critical to maintain a pool of LCs in a regulated manner at steady state and allow for the recruitment and/or de novo differentiation of LCs during inflammation. In the mouse, it was shown that LCs homeostasis at steady state could be achieved through the differentiation of local proliferating precursors.6 During inflammation, LCs were shown both to proliferate in situ7 and to differentiate from circulating monocytes8 in a process depending on macrophage-colony-stimulating factor (M-CSF)9,10 and transforming growth factor (TGF)-β.11,12
In the human, LC ontogeny, as well as the link between LCs and other dendritic cell (DC) subsets, has remained controversial. Human LCs were shown to be of hematopoietic origin.13,14 In vitro studies have shown that CD1a+ LC-like cells could be differentiated from CD34+ hematopoietic progenitors.15 Monocytes, as well as blood CD1a+CD11c+ cells, were also described as a possible source of LCs when cultured with granulocyte macrophage–colony-stimulating factor (GM-CSF), interleukin (IL)-4, and TGF-β.16,17 In particular, blood CD1a+CD11c+ cells were shown to express high CD1c (BDCA-1) levels and to rapidly acquire a LC phenotype.17 After transplantation, LCs of donor origin have been observed in the skin of the host for up to 10 years,18 suggesting the presence of a local precursor that remains to be identified. However, the pathways leading to LC differentiation during inflammation are still poorly defined, both in terms of differentiation factors and of possible LC precursor cells. In particular, it is not known whether blood CD1a-negative DCs may serve as LC precursors and acquire a bona fide LC phenotype. The recent identification of the BDCA-1+ and BDCA-3+ subsets of human DCs19 raises additional questions on their ability to further differentiate into another DC subset.
Thymic stromal lymphopoietin (TSLP) is an epithelial cell-derived cytokine playing a critical role in inflammation, in particular allergy,20 by strongly activating blood and resident tissue DCs.21 The TSLP receptor is expressed mainly by DCs and is constituted by 2 chains: TSLPR and IL-7α. The high affinity binding of TSLP to its receptor activates the Janus kinase-signal transducer and activator of transcription and the nuclear factor-κB pathways and directs DCs to activate a T-helper (Th)2 response.22,23 Through a systematic transcriptomic analysis of TSLP-activated DCs, we unexpectedly identified markers that have been associated with a skin-homing potential and with a LC phenotype. Addition of transforming growth factor (TGF)-β synergized with TSLP, leading to the differentiation of bona fide Birbeck granule-positive LCs.
Material and methods
Samples and cell isolation
Buffy coats were obtained from healthy adult blood donors at the Saint Louis hospital site of the Etablissement Français du Sang. Peripheral blood mononuclear cells were isolated by Ficoll density gradient centrifugation (Ficoll-Paque; GE Healthcare). Total DC fractions were enriched using a Pan-DC Enrichment kit according to the manufacturer’s instructions (EasySep; Stem Cell). Total DCs (Lineage−CD11c+CD4+) and DC subsets (Lineage−CD11c+CD4+BDCA-1+ or Lineage−CD11c+CD4+BDCA-3+) were purified to 99% by fluorescence-activated cell sorter (FACS) sorting (ARIA II BD). Blood CD34+ cells and CD14+ monocytes were isolated from peripheral blood mononuclear cells by positive selection using anti–CD34-coated and anti–CD14-coated magnetic beads and magnetic columns according to the manufacturer’s instructions (Miltenyi). Tonsils from healthy patients undergoing tonsillectomy were obtained from Hôpital Necker (Paris, France) following the hospital ethical guidelines. Tonsils were cut into small fragments and digested with 0.8 mg/mL collagenase IV (Worthington) and 25 μg/mL DNase (Roche) for 15 minutes at 37°C in CO2-independent medium (Gibco). After incubation, the supernatant was recovered, and the digestion was repeated 2 or 3 times. The remaining tissue was filtered on a 40-µm cell strainer (BD) and washed in phosphate-buffered saline. Following Ficoll density gradient centrifugation, the DC fraction was enriched by magnetic depletion of cells expressing CD3, CD15, CD19, CD56, CD14, and CD235a (eBioscience) according to the manufacturer’s instructions (Miltenyi Biotec). Tonsillar DC subsets (Lineage−CD11c+CD4+BDCA-1+ or Lineage−CD11c+CD4+BDCA-3+) were purified to 99% by FACS sorting (ARIA II BD).
Flow cytometry
Cells were stained with fluorescein isothiocyanate (FITC) anti-CD3 (BD), FITC anti-CD14 (BD) or Qdot605 anti-CD14 (Invitrogen), FITC anti-CD16 (BD), FITC anti-CD19 (Miltenyi), PECy5 anti-CD11c (BD), APC or VioGreen anti-CD4 (Miltenyi), APC eFluor 780 anti-HLA-DR (eBioscience), PerCP eFluor 710 anti-BDCA-1 (eBioscience), APC, PE, or VioBlue anti-BDCA-3 (Miltenyi), PE anti-CD207/Langerin (Immunotech) or FITC anti-CD207/Langerin (Miltenyi), PECy5 or FITC anti-CD1a (BD), FITC anti-IL7Rα (eBioscience), APC anti-TSLPR (BioLegend), FITC anti-CD80 (BD) or AlexaFluor 700 anti-CD80 (ExBio), FITC anti-CD83, (BD), FITC anti-CD86 (BD), FITC anti-CD40 (BD), PECy5 anti-CD206 (BioLegend), PECy7 anti-CD11b (Biolegend), AlexaFluor 647 anti-CCR2 (BioLegend), APC anti-CCR6 (BD), FITC anti-CCR7 (BD), PECy7 anti-CXCR4 (BioLegend), PE anti-FcεRI (eBioscience), FITC anti-CD64 (BD), APC anti-ECadherin (R&D), PECy7 anti-EPCAM (BioLegend), and biotinilated anti-CD209 (Miltenyi), followed by PECy7 streptavidin (eBioscience) staining. All the stainings were cell surface stainings.
Nonspecific binding and cell adhesion were blocked using phosphate-buffered saline supplemented with 1% human serum (BioWest) and 2 mM EDTA (Gibco). Cells were stained for 15 minutes at 4°C with different combinations of specific antibodies or their isotype-matched control antibodies. 4′,6 Diamidino-2-phenylindole (Sigma-Aldrich) was added before acquisition in a LSRII or Fortessa (BD) analyzer. Data were analyzed with FlowJo software (Tree Star).
Cell culture
Myeloid DC subsets from human blood and tonsils were seeded at 1 × 10⁶/mL in flat-bottom 96-well plates cultured in RPMI containing 10% heat inactivated fetal calf serum (BioWest), 1% pyruvate (Gibco), and 1% penicillin-streptomycin (Gibco). Cells were cultured for the indicated time in the absence or presence of 50 ng/mL (equivalent to 1000 U/mL) TSLP (R&D Systems) and 10 ng/mL (equivalent to 20 U/mL) of TGF-β (Prepotech). The CD1a+CD207+ LCs were sorted on a FACS instrument (ARIA II BD). lipopolysaccharide (LPS) at 100 ng/mL (Invivogen) or tumor necrosis factor (TNF)-α at 10 ng/mL (Prepotech), IL-1β at 10 ng/mL (Prepotech), IL-6 at 1000 U/mL (Prepotech) and prostaglandin E2 at 1 μg/mL (Sigma-Aldrich), as a Jonuleit cocktail,24 were used when indicated.
Peripheral blood CD34+ cells were cultured for 9 to 10 days in Yssel medium supplemented with 10% heat inactivated fetal calf serum, penicillin-streptomycin, 50 ng/mL GM-CSF (Miltenyi), 100 ng/mL Fms-like tyrosin kinase 3 (Flt3) ligand (R&D Systems), and 10 ng/mL TNF-α (R&D Systems). Culture media and cytokines were refreshed on day 5 of culture, and 10 ng/mL of TGF-β was added for the last 4 days of culture. Blood CD14+ monocytes were cultured for 6 days in RPMI supplemented with 10% heat inactivated fetal calf serum, 1% pyruvate (Gibco), 1% nonessential amino acids (Gibco), 1% penicillin-streptomycin (Gibco), 250 ng/mL GM-CSF (Miltenyi), 100 ng/mL IL-4 (Miltenyi), and 10 ng/mL TGF-β (R&D Systems). Culture media and cytokines were refreshed on days 2 and 4 of culture. CD14+CD1a−, CD14−CD1a+CD207−, and CD14−CD1a+CD207+ cells were isolated by cell sorting on a FACS instrument (ARIA II BD).
Electron microscopy
After 1 and 3 days of culture with TSLP and TGF-β, the BDCA-1+ DCs that differentiated into CD1a+CD207+ LCs were sorted and seeded in Acian blue-coated coverslips (Sigma) for 1 hour. Cells were fixed in 2% glutaraldehyde in 0.1 M phosphate buffer, pH 7.4, for 1 hour, postfixed for 1 hour with 2% buffered osmium tetroxide, dehydrated in a graded series of ethanol solution, and embedded in epoxy resin. Images were acquired with a digital camera (Keen View; SIS) mounted on a Tecnai 12 transmission electron microscope (FEI Company) operated at 80 kV.
CD4 Th cell differentiation
Naive CD4 T cells (CD4+CD45RA+CD25−CD45RO−) were isolated from blood buffy coats after Ficoll density gradient centrifugation (Ficoll-Paque GE Healthcare), enrichment (CD4 T cell Isolation kit; Miltenyi Biotec), and further FACS sorting purification. Purity was >98%. Naive CD4 T cells were cultured with allogeneic BDCA-1+- or CD34+-derived antigen-presenting cells at a 5:1 ratio in XVIVO 15 medium (Lonza). After 6 days of coculture, T cells were counted, reseeded at 1 × 10⁶/mL in flat-bottom 96-well plates, and restimulated for 24 hours with anti-CD3/CD28 microbeads (Dynal). Cell culture supernatants were collected, and cytokine measurement was performed by multiplex bead assay (Milliplex MAP Human TH17 Magnetic Bead Panel; Millipore) on a Bio-Plex-200 reader (Biorad).
Gene expression profiling
Total RNA was extracted from DCs, directly after sorting (ex vivo) or after 6 hours culture with and without TSLP (50 ng/mL; R&D Systems) and TNF-α (2.5 ng/mL; R&D Systems), using the RNeasy micro kit (Qiagen). Samples were then double amplified and labeled according to the protocol recommended by Affymetrix for hybridization to Human Genome U133 Plus 2.0 arrays. The microarray data are available in the Gene Expression Omnibus database under accession number GSE59237. Data were normalized using the GC-Robust Multi-array Average algorithm, and expression levels were centered and reduced. Probes with no annotation were removed from analysis. Genes with small profile ranges (in the low 50% of the global distribution) were filtered out using the MatLab function generangefilter.
Statistical analysis
Wilcoxon paired test and paired Student t test were performed using Prism (GraphPad Software) at a significance level of 5%. The principal component analysis (PCA) of T-cell profiles was performed using the FactoMineR package25 of the R software (version 2.15.0). The 2 first components of the PCA resume ∼80% of the total inertia. The barycenters were computed from the set of observations in each condition and projected into the PCA plot. In addition, 95% confidence ellipses were drawn around the barycenters.
Results
TSLP induces a skin-like transcriptional signature in human blood DCs
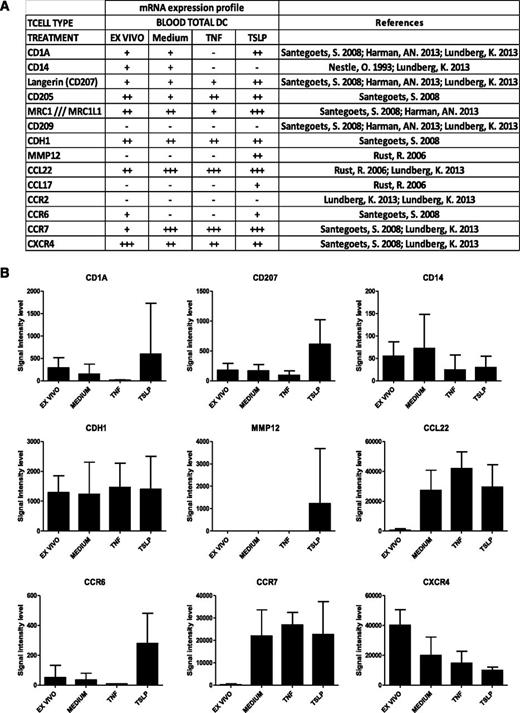
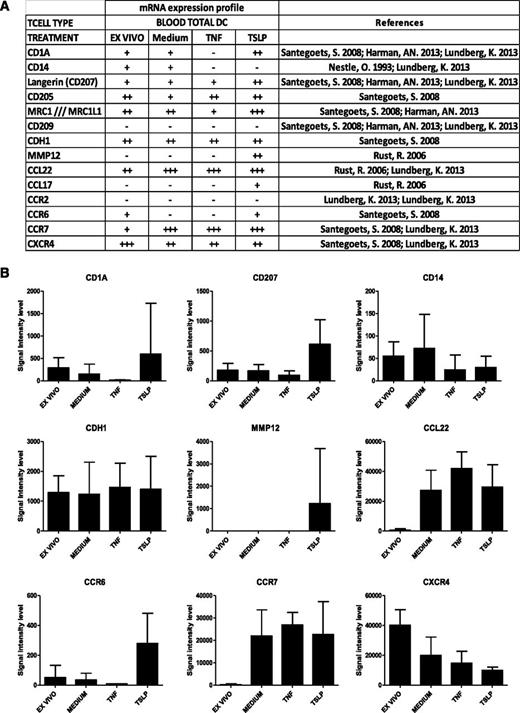
To get a detailed insight into molecular changes induced by TSLP in human total blood DCs, we performed a transcriptomic analysis of TSLP-activated blood DCs compared with freshly purified and medium- and TNF-activated DCs after 6 hours of culture (Figure 1). Affymetrix U133 plus 2.0 chips were used for transcriptomic analysis of 5 independent donors. Among TSLP up-regulated genes, we identified molecules associated with skin homing (CCR6), LC phenotype (CD1a and CD207 [Langerin]), and LC function (MMP12 and CCL17), as determined by a literature-based survey (Figure 1A). CD205 was also described on LCs26 and up-regulated by TSLP (Figure 1A). Conversely, genes not expressed in LCs were not found among TSLP-induced genes, for example, CD209 (DC-Sign) and CD14 (Figure 1B). Although the observed differences did not reach statistical significance, overall, they revealed a LC-like signature suggesting that TSLP may be involved in LC differentiation of blood DCs. This prompted us to address this question at the protein level using purified blood DC subsets.
Gene expression profile of TSLP-treated blood DCs. (A) Gene transcripts expression on purified total blood DCs directly after sorting (ex vivo) or after a 6-hour treatment with medium alone or supplemented with TSLP or TNF-α. Genome-wide expression was determined by Affymetrix chips Human Genome U133 Plus 2.0 microarray analysis. Signal intensity levels: −, ≤50; +, 50 to 500; ++, 500 to 5000; +++, ≥5000. (B) Data represent signal intensity levels for the corresponding gene transcripts under the different conditions (ex vivo: n = 5, medium; TNF-α, n = 3; TSLP, n = 4). Expression of LC-specific molecules CD1a, CD207, MMP12, and CCR6 showed a trend for TSLP-induced up-regulation and specificity but did not reach statistical significance using a Mann-Whitney nonparametric test.
Gene expression profile of TSLP-treated blood DCs. (A) Gene transcripts expression on purified total blood DCs directly after sorting (ex vivo) or after a 6-hour treatment with medium alone or supplemented with TSLP or TNF-α. Genome-wide expression was determined by Affymetrix chips Human Genome U133 Plus 2.0 microarray analysis. Signal intensity levels: −, ≤50; +, 50 to 500; ++, 500 to 5000; +++, ≥5000. (B) Data represent signal intensity levels for the corresponding gene transcripts under the different conditions (ex vivo: n = 5, medium; TNF-α, n = 3; TSLP, n = 4). Expression of LC-specific molecules CD1a, CD207, MMP12, and CCR6 showed a trend for TSLP-induced up-regulation and specificity but did not reach statistical significance using a Mann-Whitney nonparametric test.
TSLP and TGF-β synergize for the differentiation of Langerhans cells from blood BDCA-1+ DCs
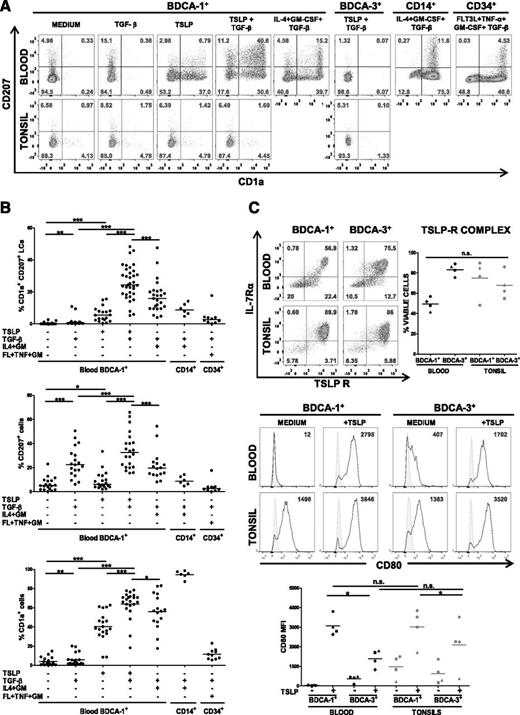
LCs are defined by their coexpression of CD1a and CD207. First, we used flow cytometry to assess the expression of CD1a and CD207 on TSLP-activated blood DCs after sorting of the BDCA-1+ and BDCA-3+ subsets. We found a strong and consistent induction of CD1a by TSLP in the BDCA-1+ subset, matching our microarray data, but not in BDCA-3+ DCs (data not shown). However, CD207 was induced inconsistently and at low levels (median, 6.2%; range, 2.1-33.5%; Figure 2A-B). Because of the importance of TFG-β in skin homeostasis, and its established role in the differentiation of LCs,12 we hypothesized that it may potentiate the effects of TSLP. Although TGF-β alone induced significant amounts of CD207 after 24 hours on BDCA-1+ DCs, it did not promote CD1a expression, which indicates a partial LC phenotype (Figure 2A). Importantly, the combination of TSLP and TGF-β resulted in a synergistic effect on BDCA-1+ DCs with differentiation of a large proportion (25.9 ± 10.5%) of CD1a+CD207+ cells (Figure 2B), a phenotype typical of LCs. However, BDCA-3+ DCs remained refractory to LC differentiation even with the TSLP + TGF-β combination (Figure 2A). DC viability in the presence of TSLP was in the range of 90% after 24-hour culture and was not modified by the presence of TGF-β (data not shown).
TSLP and TGF-β induce the differentiation of blood BDCA-1+ DCs into LCs. (A) Representative flow cytometry density dot plots of CD207 and CD1a surface expression by human blood and tonsillar BDCA-1+ and BDCA-3+ DCs after 24-hour treatment with and without TSLP and TGF-β. Blood CD14+ monocyte-derived LCs after treatment with GM-CSF, IL-4, and TGF-β and CD34+ hematopoietic progenitor-derived LCs after treatment with Flt3-L, TNF-α, GM-CSF, and TGF-β are shown as positive controls of the staining. Quadrants were adjusted to the matching correspondent isotype controls. Numbers represent the percentage of viable cells. (B) Quantification of CD207+, CD1a+, and CD1a+CD207+ cells for all the conditions. Data are presented as percentage of viable cells. Blood CD14+ monocytes were treated with IL-4, GM-CSF (IL4+GM), and TGF-β; CD34+ hematopoietic progenitors were treated with Flt3-L, TNF-α, GM-CSF (FL+TNF+GM), and TGF-β. Each dot represents an independent experiment. *P ≤ .05; **P ≤ .005; ***P ≤ .0005, Wilcoxon nonparametric paired test. Bars represent medians. (C) (Upper) Representative flow cytometry density plots of TSLP receptor and IL-7 receptor α chains by human blood and tonsillar BDCA-1+ and BDCA-3+ DCs. Quadrants were adjusted to the matching correspondent isotype controls. Numbers represent the percentage of viable cells. (Right) Percentage of viable cells expressing both chains of TSLP receptor. Each symbol corresponds to 1 donor. (Lower) Representative histograms of CD80 expression by human blood and tonsillar BDCA-1+ and BDCA-3+ DCs after 24-hour culture with and without TSLP. Plain histograms represent the matching correspondent isotype controls and numbers represent specific median fluorescence intensities (MFIs). Below, quantification of MFIs for CD80 for 4 independent donors. Paired Student t test was used: *P ≤ .05; **P ≤ .005.
TSLP and TGF-β induce the differentiation of blood BDCA-1+ DCs into LCs. (A) Representative flow cytometry density dot plots of CD207 and CD1a surface expression by human blood and tonsillar BDCA-1+ and BDCA-3+ DCs after 24-hour treatment with and without TSLP and TGF-β. Blood CD14+ monocyte-derived LCs after treatment with GM-CSF, IL-4, and TGF-β and CD34+ hematopoietic progenitor-derived LCs after treatment with Flt3-L, TNF-α, GM-CSF, and TGF-β are shown as positive controls of the staining. Quadrants were adjusted to the matching correspondent isotype controls. Numbers represent the percentage of viable cells. (B) Quantification of CD207+, CD1a+, and CD1a+CD207+ cells for all the conditions. Data are presented as percentage of viable cells. Blood CD14+ monocytes were treated with IL-4, GM-CSF (IL4+GM), and TGF-β; CD34+ hematopoietic progenitors were treated with Flt3-L, TNF-α, GM-CSF (FL+TNF+GM), and TGF-β. Each dot represents an independent experiment. *P ≤ .05; **P ≤ .005; ***P ≤ .0005, Wilcoxon nonparametric paired test. Bars represent medians. (C) (Upper) Representative flow cytometry density plots of TSLP receptor and IL-7 receptor α chains by human blood and tonsillar BDCA-1+ and BDCA-3+ DCs. Quadrants were adjusted to the matching correspondent isotype controls. Numbers represent the percentage of viable cells. (Right) Percentage of viable cells expressing both chains of TSLP receptor. Each symbol corresponds to 1 donor. (Lower) Representative histograms of CD80 expression by human blood and tonsillar BDCA-1+ and BDCA-3+ DCs after 24-hour culture with and without TSLP. Plain histograms represent the matching correspondent isotype controls and numbers represent specific median fluorescence intensities (MFIs). Below, quantification of MFIs for CD80 for 4 independent donors. Paired Student t test was used: *P ≤ .05; **P ≤ .005.
Human LCs can be differentiated in vitro by 2 standard methods. They can be induced from CD34+ hematopoietic progenitors in the presence of Flt3 ligand, TNF-α, GM-CSF, and TGF-β (CD34-LCs)2,27 or from CD14+ monocytes in the presence of IL-4, GM-CSF, and TGF-β (CD14-LCs).16 LC differentiation was induced in 76.5% (13 of 17) of normal blood CD34+ cell donors and 75% (6 of 8) of normal blood CD14+ monocyte donors. When using TSLP and TGF-β on BDCA-1+ DCs, LC differentiation efficiency was 75% (47 of 63 blood donors). However, the proportions of CD1a+CD207+ LCs obtained from CD34+ and CD14+ cells were low, with averages of 3.9 ± 5% and 9.2 ± 3.5%, respectively (Figure 2B), compared with blood BDCA-1–derived CD1a+CD207+ LCs under TSLP and TGF-β (25.9 ± 10.5% Figure 2B). In parallel to TSLP and TGF-β treatment, we stimulated blood BDCA-1 DCs for 24 hours with the CD14-LC differentiation cocktail (IL-4, GM-CSF, and TGF-β), obtaining an average of 17.0 ± 10.1% of CD1a+CD207+ LCs. These results show that TSLP and TGF-β induce an effective LC differentiation from blood BDCA-1+ DCs and that BDCA-1+ DCs were more potent LC precursors compared with CD34 progenitors and CD14 monocytes.
Our data show that human blood BDCA-1+ DCs retain a potential to differentiate into another DC subset. To address the differentiation potential of secondary lymphoid tissue DCs, we repeated these experiments using BDCA-1+ and BDCA-3+ subsets purified from human tonsils. Neither of these subsets was able to differentiate into LCs with TSLP and TGF-β (Figure 2A), suggesting that DCs from blood and tonsils do not have the same differentiation potential.
Because tonsil DCs, as well as blood BDCA-3+ DCs, did not differentiate into LCs in response to TSLP, we questioned whether they were able to respond to TSLP. By flow cytometry, BDCA-1+ and BDCA-3+ subsets from both blood and tonsil expressed the 2 chains of the TSLP receptor complex: IL-7R-α and TSLPR (Figure 2C). Accordingly, all subsets responded to TSLP activation, as assessed by surface CD80 expression (Figure 2C).
TSLP- and TGF-β–induced LCs express Birbeck granules
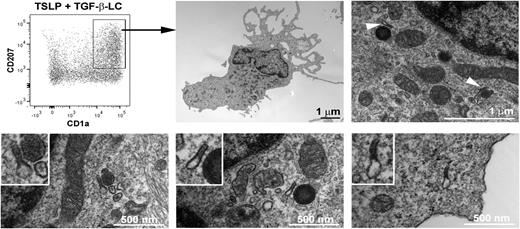
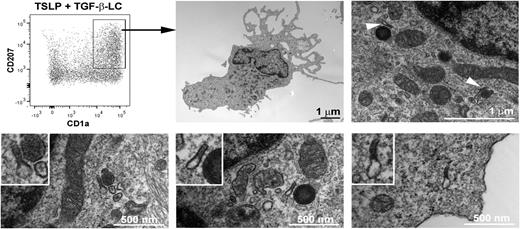
Although CD1a and CD207 are typical of a LC phenotype, Birbeck granules are the most specific and distinctive feature of human LCs.28 We assessed by electron microscopy the presence of Birbeck granules on the CD1a+CD207+ population differentiated from blood BDCA-1+ DCs after 1 and 3 days of stimulation with TSLP and TGF-β (Figure 3). On the sorted CD1a+CD207+ cells, at day 1, we could not observe any structure reminiscent of the double-membrane rod-shaped cytoplasmic organelles typical of Birbeck granules, even with a combination of TSLP and TGF-β (data not shown), although we could not exclude a low number of these structures that could have been missed by careful examination. Nevertheless, typical Birbeck granules appeared by day 3 in the sorted DCs cytoplasm (Figure 3; supplemental Figure 3, available on the Blood Web site), suggesting a minimum amount of time required for organelle formation. The mean width of the Birbeck granules was 33 nm, which corresponds to what has been observed on freshly isolated human LCs.29 The CD1a and CD207 single-positive, as well as double-negative, cells were consistently negative for Birbeck granules (data not shown).
Birbeck granules on blood BDCA-1+ DCs treated with TSLP and TGF-β. After 3 days of culture with TSLP and TGF-β, blood BDCA-1+-derived LCs were sorted according to the expression of CD1a and CD207. Electron microscopy pictures show the presence of LC characteristic Birbeck granules in the cytoplasm (arrows). The Birbeck granules shown in the lower pictures correspond to different independent cells. The experiment was performed for 6 independent blood donors and found Birbeck granules in the CD1a+CD207+ cell population for all tested donors.
Birbeck granules on blood BDCA-1+ DCs treated with TSLP and TGF-β. After 3 days of culture with TSLP and TGF-β, blood BDCA-1+-derived LCs were sorted according to the expression of CD1a and CD207. Electron microscopy pictures show the presence of LC characteristic Birbeck granules in the cytoplasm (arrows). The Birbeck granules shown in the lower pictures correspond to different independent cells. The experiment was performed for 6 independent blood donors and found Birbeck granules in the CD1a+CD207+ cell population for all tested donors.
TSLP- and TGF-β–induced LCs bear a mature phenotype and skin-homing receptors
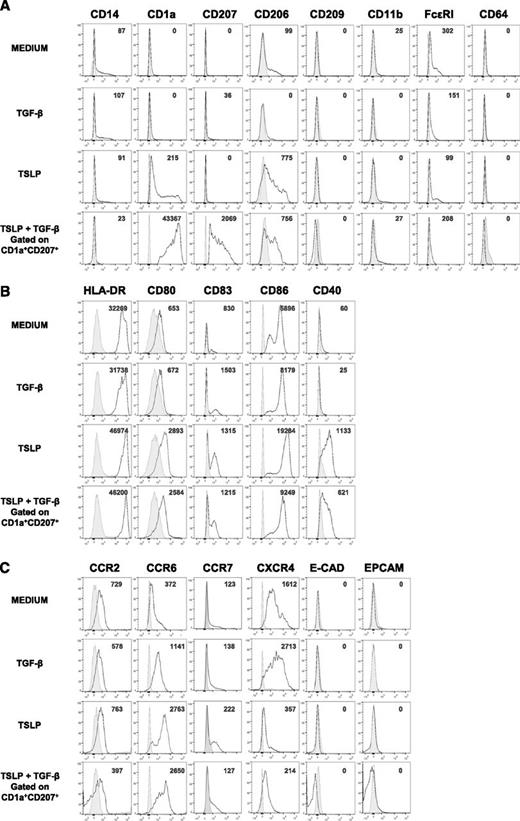
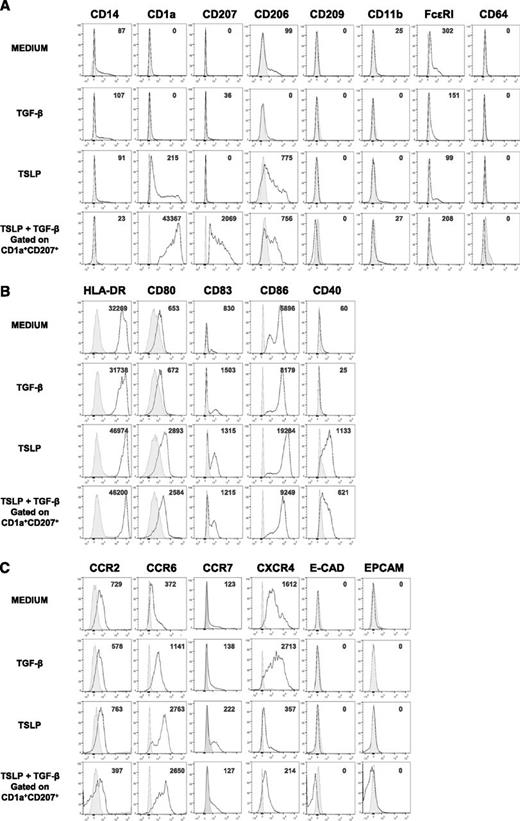
To determine the phenotype of TSLP- and TGF-β–induced LCs (TSLP + TGF-β LCs), we assessed the expression of surface markers characteristic of DC lineage, maturation state, and homing receptors. TSLP + TGF-β LCs expressed higher levels of CD1a and CD207 compared with blood BDCA-1+ DCs treated with optimal doses of either TSLP or TGF-β alone, confirming the synergistic effect of these cytokines on LC generation (Figure 4A). We found low levels of FcεRI expression as previously reported in skin-isolated LCs26 and CD206 (mannose receptor 1) previously reported to be expressed by DCs and macrophages from human inflammatory fluids.30 Other markers of inflammatory DCs such as CD14 and CD11b were absent in TSLP + TGF-β LCs (Figure 4A). In comparison with TSLP + TGF β-induced LCs, CD34+-derived LCs expressed CD11b and higher levels of CD206 (supplemental Figures 1 and 2).
TSLP + TGF-β LC expression of macrophage and DC subset markers, maturation markers, and skin-homing receptors. Representative histograms of the expression of (A) macrophage and DC subset molecules, (B) activation markers, and (C) skin-homing receptors by sorted human blood BDCA-1+ cells after a 24-hour culture with or without TSLP or TGF-β. Data on BDCA-1+ DCs treated with both TSLP and TGF-β correspond to the CD1a+ CD207+ cells. Plain histograms represent the matching corresponding isotype controls, and numbers represent specific MFIs; n = 4 to 11.
TSLP + TGF-β LC expression of macrophage and DC subset markers, maturation markers, and skin-homing receptors. Representative histograms of the expression of (A) macrophage and DC subset molecules, (B) activation markers, and (C) skin-homing receptors by sorted human blood BDCA-1+ cells after a 24-hour culture with or without TSLP or TGF-β. Data on BDCA-1+ DCs treated with both TSLP and TGF-β correspond to the CD1a+ CD207+ cells. Plain histograms represent the matching corresponding isotype controls, and numbers represent specific MFIs; n = 4 to 11.
It has been shown that TSLP strongly activates total human blood DCs inducing the expression of HLA-DR, CD80, CD86, and CD40.20 Accordingly, TSLP + TGF-β LCs expressed high levels of HLA-DR and CD80 (Figure 4B). Nevertheless they expressed significantly lower amounts of CD86 and CD40 compared with TSLP-treated BDCA-1+ DCs, consistent with a down-regulation of these markers by TGF-β. TSLP + TGF-β LCs were found to express lower levels of CD83, CD86, and CD40 in comparison with CD34+ LCs but higher levels of HLA-DR and CD80 (supplemental Figures 1 and 2).
It has been suggested that, under inflammatory conditions, LC precursors reach the dermis through the expression of the chemokine receptor CCR2. In a second step, they up-regulate CCR6, which allows them to reach the epidermis,6 where E-cadherin mediates their binding to keratinocytes.31 Activated LCs down-regulate E-cadherin and reach the lymph nodes through the sequential involvement of CXCR432 and CCR7.33 We found that TSLP + TGF-β LCs expressed lower levels of CCR2 compared with medium or TGF-β– or TSLP-treated BDCA-1+ DCs, but higher levels of CCR6 (Figure 4C). Neither E-cadherin nor the epithelial cell adhesion molecule Epcam, characterizing LCs, were found to be expressed in any of the conditions. TSLP + TGF-β LCs expressed lower levels of CCR7 and CXCR4 compared with medium and TGF-β–treated BDCA-1+ cells (Figure 4C). These results show that TSLP + TGF-β-LCs are activated and express a skin-homing phenotype.
Induction of Th differentiation by TSLP + TGF-β–induced LCs
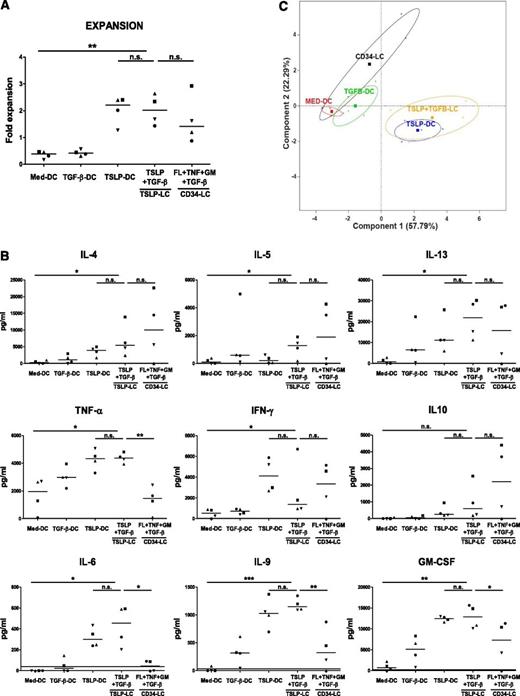
A major function of LCs is to induce naive CD4+ T-cell activation and differentiation into Th effectors. TSLP + TGF-β LCs induced a two- to threefold expansion of naive CD4+ T cells after 6 days of coculture, which was slightly higher than CD34 LCs (Figure 5A).
TSLP + TGF-β LCs induce a Th2 profile on naive CD4+ T cells. BDCA-1+ DCs subsets were stimulated with or without TSLP and TGF-β for 24 hours. CD34+ cells were stimulated with Flt3-L, TNF-α, GM-CSF, and TGF-β. CD34+- derived LCs and BDCA-1+–derived LCs were sorted according to CD1a and CD207 expression and cultured with allogeneic naive CD4+ T cells for 6 days before T-cell restimulation. Symbols represent cells purified from the same donor. (A) T-cell expansion was assessed by calculating the ratio of the number of T cells at the end of the culture divided by the number of T cells plated at the start of the culture. **P ≤ .005, paired Student t test. Bars represent medians. (B) Data represent cytokine concentration at the end of the culture measured by multiplex bead array. *P ≤ .05; **P ≤ .005, paired Student t test. Bars represent medians. (C) PCA showing the resemblance of the naive T-cell profiles (secretion of 13 cytokines) induced under different conditions. Components 1 and 2 were selected as the axes explaining most of the data variance. The crosses represent individual donors (n = 4). The squares represent the barycenters. Confidence ellipses at 95% are depicted in each condition.
TSLP + TGF-β LCs induce a Th2 profile on naive CD4+ T cells. BDCA-1+ DCs subsets were stimulated with or without TSLP and TGF-β for 24 hours. CD34+ cells were stimulated with Flt3-L, TNF-α, GM-CSF, and TGF-β. CD34+- derived LCs and BDCA-1+–derived LCs were sorted according to CD1a and CD207 expression and cultured with allogeneic naive CD4+ T cells for 6 days before T-cell restimulation. Symbols represent cells purified from the same donor. (A) T-cell expansion was assessed by calculating the ratio of the number of T cells at the end of the culture divided by the number of T cells plated at the start of the culture. **P ≤ .005, paired Student t test. Bars represent medians. (B) Data represent cytokine concentration at the end of the culture measured by multiplex bead array. *P ≤ .05; **P ≤ .005, paired Student t test. Bars represent medians. (C) PCA showing the resemblance of the naive T-cell profiles (secretion of 13 cytokines) induced under different conditions. Components 1 and 2 were selected as the axes explaining most of the data variance. The crosses represent individual donors (n = 4). The squares represent the barycenters. Confidence ellipses at 95% are depicted in each condition.
Primary and CD34-derived skin LCs were shown to induce Th2 differentiation.2 In our study, TSLP + TGF-β LCs also preferentially induced CD4+ Th cells to produce IL-4, IL-5, and IL-13, at levels similar to, or higher than, CD34-derived LCs (Figure 5B). However, TSLP + TGF-β LCs induced Th cells producing higher levels of TNF-α and IL-6 compared with CD34 LCs (Figure 5B). Interestingly, we found that TSLP + TGF-β LCs, similar to TSLP-DCs that did not differentiate into LCs, induced high levels of IL-9 production by Th cells, which were not observed with CD34-derived LCs (Figure 5B).
To get a global integrated view of Th cytokine profiles generated with different DCs, we used PCA, a multivariate approach that reduces the dimensionality of the data by extracting the smallest number of components that account for most of the variation in our data. It appeared that the CD34 LC-induced Th profile was closer to medium DCs and TGF-β DCs (Figure 5C). TSLP + TGF-β LCs were more similar to TSLP DCs than to TGF-β DCs (Figure 5C). Importantly, TSLP + TGF-β LCs were distinct from CD34 LCs at the global Th cytokine profile level.
In a second set of experiments, TSLP + TGF-β LCs were compared with LPS DCs and DCs activated with a cytokine cocktail (TNF/IL-6/IL-1-β/prostaglandin E2; Jonuleit cocktail), as well as cultured skin LCs. PCA revealed that all LC and LC-like conditions were grouped together and were different from LPS- and Jonuleit cocktail-activated DCs, confirming that TSLP + TGF-β LCs were closer to primary LCs than to other mature DCs (supplemental Figure 4). At the individual Th cytokine level, differences were mostly due to lower Th2 cytokines and lower IL-9 production by LPS- and Jonuleit cocktail-activated DCs compared with LC and LC-like DC populations (supplemental Figure 4).
Altogether, our results show that BDCA-1+ DCs stimulated by TSLP and TGF-β differentiate to exhibit classical LC phenotypic and functional characteristics.
Discussion
It is commonly accepted that, at steady state, circulating blood DCs maintain the pool of tissue dendritic cells.34 In mice, the tissue dendritic cell subsets have been shown to derive from blood circulating pre-DCs.35,36 In humans, the blood population equivalent to murine pre-DCs has not been identified. Human blood CD34+ cells and CD14+ monocytes can give rise to LCs,15,16,37,38 but their role in human inflammatory conditions remains unknown. Our results demonstrate that blood BDCA-1+ DCs retain a precursor capacity and represent an LC progenitor with potential implication in inflammatory conditions.
As opposed to blood BDCA-1+ DCs, blood BDCA-3+ DCs and tonsillar DCs do not give rise to LCs in our culture conditions. This might reflect a differential response of human DC subsets to TSLP and TGF-β stimuli and/or the fact that human DC subsets have different functional specializations as has been proposed by others.36,39 Moreover, the fact that not all the blood BDCA-1+ DC population is able to differentiate into LCs suggests a higher degree of functional heterogeneity within this subpopulation. Nevertheless, an alternative explanation for the tonsillar DCs failure to develop into LCs is that tissue DCs may be more terminally differentiated than blood DCs. Indeed, it has been shown that, although in blood a small proportion of DCs still proliferates, this is not the case in lymph nodes and tonsils.40 Further experiments would be required to investigate whether the tonsillar tissue environment regulates the precursor capacity of DCs.
In steady-state conditions, LCs develop from a local precursor that is independent from circulating progenitors.18,41 Under inflammatory conditions, different murine models show different results and show that LCs can have a dual origin, both from local proliferation and from blood progenitors.7,8,16,37,42 Although blood CD34+ progenitors have high proliferative capacity43 and CD14+ monocytes are abundant in human blood, in our hands, blood BDCA-1+ DCs differentiated into LCs with better yields than the former precursors, not only with TSLP and TGF-β but also with the CD14+ LC cytokine cocktail. Blood BDCA-1+ DCs stimulated only with TSLP already gave rise to low numbers of CD1a+CD207+ cells. Although this could suggest a role for an autocrine TGF-β signal requirement for LC generation,11 these results were not modified by blocking TGF-β (data not shown). In any case, extrinsic TGF-β stimulation was required to get optimal LC yields. Blood BDCA-1+ DC differentiation into LCs was observed as early as 24 hours, making this population a more direct precursor of LCs than other blood progenitors. Under inflammatory conditions, blood precursors might be differentially implicated in LC generation depending on time and cytokine availability as human blood unstimulated CD34+ and CD14+ cells do not express the TSLP receptor complex (data not shown).
We found that TSLP + TGF-β LCs had a mature phenotype and expressed a pattern of molecules suggesting skin homing. CCR2 was found to be expressed by blood BDCA-1+ DCs and CCR6 was highly up-regulated by TSLP treatment, which might suggest a sequential involvement of these receptors in the recruitment of TSLP + TGF-β LCs to the dermis and then the epidermis as previously suggested in the case of other blood LC precursors.33,44 TSLP + TGF-β LCs induced a Th2 differentiation of naive T cells, indicating that our system recapitulates important features of primary LCs,2 TSLP-treated DCs,20 and TSLP-treated LCs.45,46 However, in contrast to primary LCs, TSLP + TGF-β LCs did not express Epcam or E-cadherin, and consistent with LCs generated under inflammatory conditions, they induced Th cells producing higher levels of TNF-α and IL-6 compared with CD34 LCs. TSLP + TGF-β LCs were more similar to TSLP DCs than to TGF-β DCs, suggesting a dominance of the inflammatory environment as represented by TSLP. Importantly, TSLP + TGF-β LCs were distinct from CD34 LCs at the global Th cytokine profile level, confirming that these 2 subsets have different functional features and may be involved in different types of physiopathological conditions.
Interestingly, TSLP + TGF-β LCs induced IL-9 production by CD4+ T cells. This cytokine has been attributed to a subset of Th2 cells that develops into Th9 cells under TGF-β influence47 and has been associated to TSLP-linked allergic disorders.48 Intracellular cytokine assessment would be required to evaluate the presence of Th9 cells after TSLP-BDCA-1+ DC and TSLP + TGF-β LCs stimulation.
In conclusion, we provide definitive evidence that blood BDCA-1+ DCs differentiate into LCs in the presence of TSLP and TGF-β. This defines a novel LC differentiation pathway in the human. Our study provides a direct link between the epithelial inflammatory microenvironment and LC differentiation, bringing new insight into LC generation from blood precursors during inflammation. Future studies may determine whether other inflammatory mediators may also harbor an LC differentiation capacity. Dissecting DC subset diversity at steady state and inflammation may facilitate the therapeutic manipulation of the immune response and its tailoring to specific types of inflammation.
The online version of this article contains a data supplement.
There is an Inside Blood Commentary on this article in this issue.
The publication costs of this article were defrayed in part by page charge payment. Therefore, and solely to indicate this fact, this article is hereby marked “advertisement” in accordance with 18 USC section 1734.
Acknowledgments
The authors thank Zosia Maciorowski, Annick Viguier, and Sophie Grondin of the Curie Cytometry platform; David Gentien and the staff members of the Curie Affymetrix platform; the Etablissement Français du sang and Necker Hospital for providing samples; INSERM U932, especially Elodie Segura and Aymeric Silvin, for protocols and fruitful discussions; and Dr C. Caux, Dr N. Manel, and Dr C. Hivroz for critical reading of the manuscript.
This work was supported by the DCBIOL Labex (ANR-10-IDEX-0001-02 PSL/-11-LABX-0043), the Fondation pour la Recherche Médicale, the Agence Nationale de la Recherche, and the European Research Council grants. C.M.-C. was supported by the French Ministry of Research and the International Curie Institute program.
Authorship
Contribution: C.M.-C. designed and performed research; M.G. and M. Jouve performed experiments; R.Z. developed the transcriptomic profiles; M. Jeanmougin analyzed data; V.S. supervised the research; and C.M.-C. and V.S. wrote the manuscript.
Conflict-of-interest disclosure: The authors declare no competing financial interests.
Correspondence: Vassili Soumelis, 26 Rue d’Ulm, Paris F-75248, France; e-mail: vassili.soumelis@curie.fr.

