Key Points
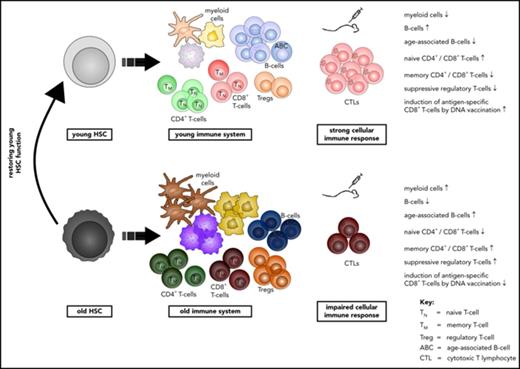
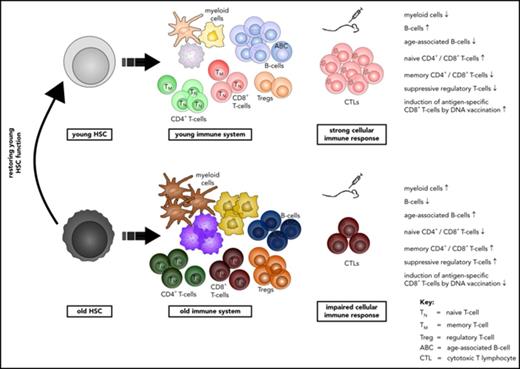
Phenotypic and functional changes in T and B cells of old mice are primarily driven by aging of HSCs.
CASIN-treated aged HSCs reconstitute an immune system with a function similar to that in young animals.
Abstract
Aging-associated remodeling of the immune system impairs its functional integrity and contributes to increased morbidity and mortality in the elderly. Aging of hematopoietic stem cells (HSCs), from which all cells of the adaptive immune system ultimately originate, might play a crucial role in the remodeling of the aged immune system. We recently reported that aging of HSCs is, in part, driven by elevated activity of the small RhoGTPase Cdc42 and that aged HSCs can be rejuvenated in vitro by inhibition of the elevated Cdc42 activity in aged HSCs with the pharmacological compound CASIN. To study the quality of immune systems stemming selectively from young or aged HSCs, we established a HSC transplantation model in T- and B-cell-deficient young RAG1−/− hosts. We report that both phenotypic and functional changes in the immune system on aging are primarily a consequence of changes in the function of HSCs on aging and, to a large extent, independent of the thymus, as young and aged HSCs reconstituted distinct T- and B-cell subsets in RAG1−/− hosts that mirrored young and aged immune systems. Importantly, aged HSCs treated with CASIN reestablished an immune system similar to that of young animals, and thus capable of mounting a strong immune response to vaccination. Our studies further imply that epigenetic signatures already imprinted in aged HSCs determine the transcriptional profile and function of HSC-derived T and B cells.
Introduction
Aging is associated with a variety of changes in the immune system, summarized as aging-associated immune remodeling and dysfunction (AAIR). Although the immune system in the elderly seems to be at least partially competent to respond to newly encountered antigens, age-related alterations impair its functional integrity, resulting in an increased susceptibility to infections and decreased responsiveness to vaccines.1,2 AAIR is thus thought to be a major cause of the increased morbidity and mortality in the elderly.3
Almost all constituents of the human and murine immune system are affected in the elderly. T cells present with prominent changes, primarily including a decrease in the number of naive T cells that are competent to respond to new antigens.4 For T cells, the involution of the thymus has been seen as a critical factor contributing to reduced lymphopoiesis on aging, as the involution precedes T-cell-related immune incompetence.5 However, novel emerging data suggest that the reduced production of lymphocytes in both aged mice and humans might also depend on cell intrinsic changes in hematopoietic stem cells (HSCs) from which lymphocytes are ultimately derived.6-8 Aged HSCs show an altered differentiation capacity: they are skewed toward the myeloid lineage, resulting in an overall reduced production of lymphoid precursors.9 Although the role of thymic involution for AAIR has been described in detail,5,10,11 there is only limited information available on the extent to which aged HSCs contribute to AAIR.
We recently demonstrated that an increase in the activity of the small RhoGTPase cell division control protein 42 (Cdc42) in aged HSCs is causative for their aging.12,13 Cdc42 cycles between an inactive, GDP-bound and an active, GTP-bound form. A shift from canonical to noncanonical Wnt signaling resulting from elevated expression of Wnt5a in old HSCs results in elevated Cdc42 activity in these HSCs.13 The elevated activity of Cdc42 is causative for a loss in HSCs polarity for several proteins (eg, tubulin and Cdc42 itself). Pharmacological inhibition of the elevated Cdc42 activity in aged HSCs to the level found in young ones with the Cdc42 activity-specific inhibitor CASIN reverts these age-associated phenotypes, and in serial transplantation experiments, CASIN-treated aged HSCs function similar to young HSCs.12 CASIN reduces Cdc42 activity by interfering with the GTP loading exchange reaction in a dose-dependent and reversible manner.14 We thus hypothesized that CASIN-treated aged HSCs might reconstitute an immune system that is similar to that found in young mice.
In this study, we demonstrate that HSCs from young or aged mice regenerate distinct adaptive immune systems on transplantation into RAG1−/− mice that resemble the altered T- and B-cell systems of young and aged mice. CASIN-treated aged HSCs reconstitute a functional immune system in RAG1−/− hosts that was similar to the one found in recipients of young HSCs, as indicated by reestablishing a CD8+ T-cell response to DNA vaccination, as well as gene expression profiles in HSC-derived T and B cells.
Materials and methods
Mice
Female young (2-3 months) B6.129S7-Rag1tm1Mom/J (RAG1−/−), young (2-3 months) and aged (>20 months) B6.SJL-PtprcaPepcb/BoyJ (B6.SJL), and young (2-3 months) C57BL/6J mice were used. Mice were kept under standard pathogen-free conditions in the animal facility of Ulm University.
Cell sorting
HSCs were sorted as lin−Sca-1+c-kit+CD34−Flk-2− cells from the bone marrow of young and aged mice, using a BD FACS Aria II or a BD FACS Aria III (BD Bioscience).12
Noncompetitive HSC transplantation
Sorted HSCs were cultured for 16 hours, where indicated, with 5 μM CASIN (Xcessbio).12 Six hundred HSCs were transplanted into sublethally (6.5 Gy) irradiated RAG1−/− mice. Characterization of the recipients’ immune system was performed 12 weeks posttransplantation except where otherwise specified.
Flow cytometry
For characterization of the immune systems, peripheral blood and spleen immunostaining was performed according to standard protocols, using the antibodies listed in supplemental Table 1, available on the Blood Web site.
DNA immunization
Mice were immunized with 100 μg pCI/C vector DNA intramuscularly (tibialis anterior muscles).15 At 12 to 13 days postvaccination, Kb/C93-100-specific CD8+ T-cell frequencies in spleen and liver were determined using Kb/C93-100-loaded H2Kb dimers.15
More detailed and additional materials and methods can be found in the supplemental Material.
The RNA Seq raw data of the study are available in the Gene Expression Omnibus repository (accession no. GSE107007).
Results
Reconstitution of RAG1−/− mice with HSCs recapitulates reduced lymphoid contribution of aged HSCs
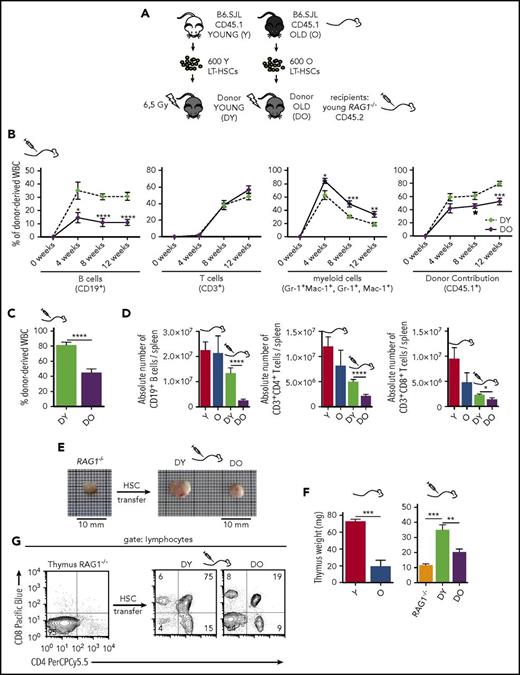
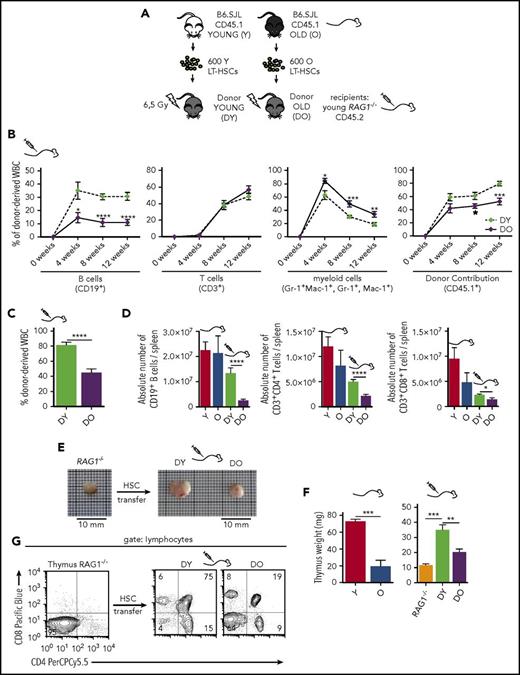
We initially set out to investigate the role of aging of HSCs for AAIR. The outcome of standard HSC transplantation into immune-competent recipients is difficult to interpret because of interference of radiation-resistant cells from the recipient that might confound results16 (supplemental Figure 1A-B). To overcome this limitation, 600 HSCs (Lin−Sca-1+c-kit+CD34−Flk-2-; supplemental Figure 1C) from the bone marrow of young and old CD45.1+ B6.SJL mice were transplanted into sublethally irradiated T- and B-cell-deficient young CD45.2+ RAG1−/− mice (Figure 1A). In this setting, young and aged donor HSCs are exposed to a young microenvironment, and the development of HSC-derived T cells proceeds in the presence of a young thymus.
Transplantation of DY and DO HSCs in RAG1−/−recipients. (A) Schematic representation of the experimental setup: 600 HSCs were isolated from young (Y) and old (O) B6.SJL (CD45.1) mice and subsequently transplanted into irradiated young RAG1−/− (CD45.2) recipients. (B) Contribution of DY and DO HSCs (CD45.1) to white blood cells was analyzed in peripheral blood every 4 weeks up to 12 weeks (DY, DO, n = 15). (C) 12 weeks posttransplantation, recipient mice were scarified and donor contribution to total white blood cells in spleen was analyzed (DY, n = 16; DO, n = 19). (D) Absolute number of donor-derived splenic CD19+ B cells, CD3+CD4+ and CD3+CD8+ T cells in recipient animals and nontransplanted young and aged B6.SJL mice (Y, n = 8; O, n = 7; DY, n = 16; DO, n = 19). (E) Representative gross anatomy of thymi taken from a nontransplanted RAG1−/− mouse and RAG1−/− recipients transplanted with DY or DO HSCs. (F) Weight of thymus glands isolated from nontransplanted young and aged B6.SJL mice, RAG1−/− mice, and RAG1−/− recipients transplanted with DY and DO HSCs (Y, n = 4; O, RAG1−/−, n = 3; DY, n = 5; DO, n = 8). (G) Representative thymic profile of nontransplanted RAG1−/− mice and RAG1−/− hosts of DY and DO HSCs. Total thymic cells from transplanted and nontransplanted animals were analyzed for CD4 and CD8 expression, using flow cytometry. CD4+, CD8+, and CD4+CD8+ T cells were gated as mononucleated cells within the lymphocyte population. *P < .05; **P < .01; ***P < .001; and ****P < .0001. (B) Two-tailed unpaired Student's t-test, mean ± SEM. (C-D) Two-tailed unpaired Student's t-test, mean + SEM. (D) Only means of nontransplanted young vs aged mice and recipients of DY vs DO HSCs were compared statistically. (F) Two-tailed unpaired Students's t-test, one-way ANOVA, mean + SEM.
Transplantation of DY and DO HSCs in RAG1−/−recipients. (A) Schematic representation of the experimental setup: 600 HSCs were isolated from young (Y) and old (O) B6.SJL (CD45.1) mice and subsequently transplanted into irradiated young RAG1−/− (CD45.2) recipients. (B) Contribution of DY and DO HSCs (CD45.1) to white blood cells was analyzed in peripheral blood every 4 weeks up to 12 weeks (DY, DO, n = 15). (C) 12 weeks posttransplantation, recipient mice were scarified and donor contribution to total white blood cells in spleen was analyzed (DY, n = 16; DO, n = 19). (D) Absolute number of donor-derived splenic CD19+ B cells, CD3+CD4+ and CD3+CD8+ T cells in recipient animals and nontransplanted young and aged B6.SJL mice (Y, n = 8; O, n = 7; DY, n = 16; DO, n = 19). (E) Representative gross anatomy of thymi taken from a nontransplanted RAG1−/− mouse and RAG1−/− recipients transplanted with DY or DO HSCs. (F) Weight of thymus glands isolated from nontransplanted young and aged B6.SJL mice, RAG1−/− mice, and RAG1−/− recipients transplanted with DY and DO HSCs (Y, n = 4; O, RAG1−/−, n = 3; DY, n = 5; DO, n = 8). (G) Representative thymic profile of nontransplanted RAG1−/− mice and RAG1−/− hosts of DY and DO HSCs. Total thymic cells from transplanted and nontransplanted animals were analyzed for CD4 and CD8 expression, using flow cytometry. CD4+, CD8+, and CD4+CD8+ T cells were gated as mononucleated cells within the lymphocyte population. *P < .05; **P < .01; ***P < .001; and ****P < .0001. (B) Two-tailed unpaired Student's t-test, mean ± SEM. (C-D) Two-tailed unpaired Student's t-test, mean + SEM. (D) Only means of nontransplanted young vs aged mice and recipients of DY vs DO HSCs were compared statistically. (F) Two-tailed unpaired Students's t-test, one-way ANOVA, mean + SEM.
Twelve weeks posttransplantation, recipients of aged (DO) HSCs showed fewer donor-derived B cells but more myeloid cells in peripheral blood compared with recipients of young (DY) HSCs (Figure 1B). Overall reconstitution with DO HSCs resulted in fewer donor-derived cells in the spleen than with DY HSCs (Figure 1C). Furthermore, absolute numbers of B, CD4+, and CD8+ T cells in recipients of DO HSCs were decreased compared with recipients of DY HSCs (Figure 1D).
Transplantation of aged HSCs resulted in fewer naive T cells
The development of mature single positive naive T cells depends on a functional thymus.5,10,11 In recipients of DY HSCs, thymus weight was significantly increased compared with in nontransplanted RAG1−/− mice, and these thymi contained high numbers of distinct T-cell progenitors including double-negative, double-positive, and single-positive CD4+ and CD8+ T cells (Figure 1E-G). In contrast, in recipients of DO HSCs, there was only a slight increase in thymus weight, and the numbers of double-positive T-cell progenitors were reduced (Figure 1E-G). These findings demonstrated that the “dormant” thymus in RAG1−/− mice at least partially resumed its appropriate function after adoptive transfer of DY and DO HSCs.
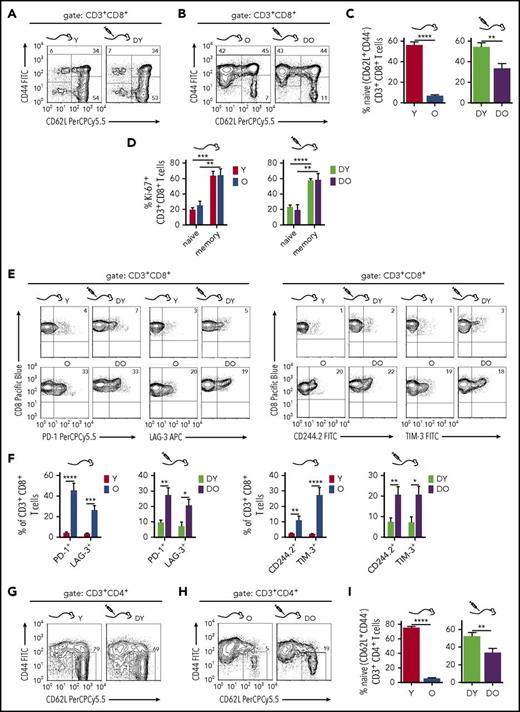
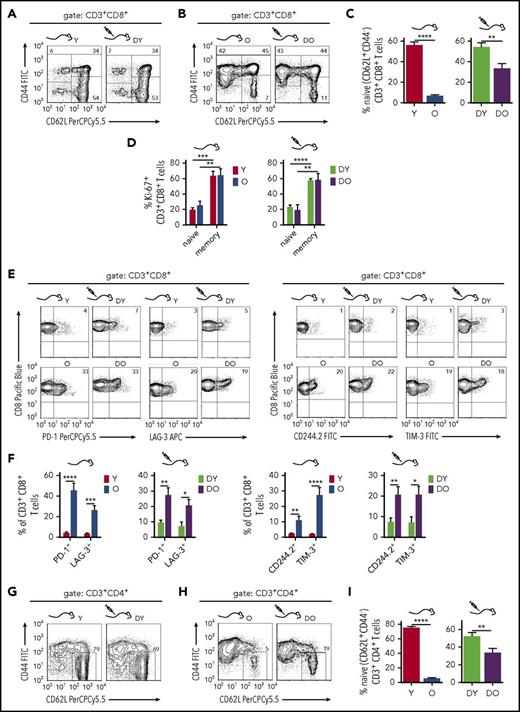
One hallmark of AAIR in mice (and man) is a reduced frequency of naive (CD44−CD62L+) T cells.17 The CD8+ T-cell pool in the spleen of young B6.SJL mice contained 50% to 70% naive CD8+ T cells while their frequency decreased to 3% to 10% in old mice (Figure 2A-C). Concurrently, the frequency of CD44+ memory CD8+ T cells increased on aging, filling about 90% of the CD8+ T-cell pool in aged mice but only 30% to 50% in young mice (Figure 2A-B). The frequencies of naive and memory CD8+ T-cell subsets in recipients of DY or DO HSCs resembled the CD8+ T-cell pools of young and old mice, respectively (Figure 2A-C). A similar distribution of CD8+ T-cell subsets evolved in RAG1−/− mice transplanted with C57BL/6-derived (CD45.2+) DY HSCs (supplemental Figure 2), validating that this phenotype is independent of the congenic CD45.1 interval in B6.SJL animals.18 Aged B6.SJL mice and recipients of DO HSCs showed a higher frequency of CD44+CD62L− effector memory CD8+ T cells compared with young mice and recipients of DY HSCs (Figure 2A-B). The higher frequencies of memory T cells in aged mice and DO HSC recipients might imply a higher proliferative activity of these T cells.19 However, in comparison with naive CD8+ T cells, the CD44+ memory CD8+ T-cell pool in young and old mice and in recipients of DY and DO HSCs showed elevated frequencies of cells that express the proliferation marker Ki-67 (Figure 2D). The higher number of memory CD8+ T cells in aged mice might thus not be a direct consequence of a different cell cycle activity on aging. Finally, the frequency of CD8+ T cells that express inhibitory receptors usually associated with exhaustion, such as PD-1, CD244.2, LAG-3, or TIM-3,20,21 was higher in old mice and in recipients of DO HSCs when compared with young mice and recipients of DY HSCs (Figure 2E-F).
Phenotypic characterization of splenic CD8+and CD4+T cells in RAG1−/−recipients. (A-B) To identify naive and memory CD8+ T cells, splenocytes were stained for CD3, CD8, CD62L, and CD44 expression. Shown are representative flow cytometry profiles of naive (CD44−CD62L+), central memory (CM; CD44+CD62L+), and effector memory (EM; CD44+CD62L−) T cells within the CD3+CD8+ T cells from young and aged nontransplanted mice and RAG1−/− recipients of DY and DO HSCs. (C) Quantification of naive CD3+CD8+ T cells within the total CD3+CD8+ population (Y, n = 8; O, n = 7; DY, n = 16; DO, n = 19). (D) Proliferation of CD3+CD8+ T cells isolated from young and old animals and RAG1−/− recipients of DY and DO HSCs was analyzed by expression of the nuclear protein Ki-67. Percentage of naive (CD44−) and memory (CD44+) CD3+CD8+ T cells, which are Ki-67+, are depicted (Y, O, n = 4; DY, n = 5; DO, n = 9). (E) CD3+CD8+ T cells isolated from nontransplanted young and old B6.SJL mice and RAG1−/− hosts transplanted with DY or DO HSCs were stained for the exhaustion marker PD-1, CD244.2, TIM-3, and LAG-3. Representative flow cytometric profiles of individual stains are depicted. (F) Percentages of the different inhibitory receptors within CD3+CD8+ T cells are shown (Y, n = 8; O, n = 7; DY, n = 16; DO, n = 19). (G-H) Splenic naive CD4+ T cells from recipients of DY and DO HSCs and nontransplanted young and aged mice were identified as CD44−CD62L+ cells within the CD3+CD4+ T-cell population. Representative dot plot profiles of the flow cytometric analysis are depicted. (I) Quantification of naive CD3+CD4+ T cells within the total CD3+CD4+ population (Y, n = 8; O, n = 7; DY, n = 16; DO, n = 19). *P < .05; **P < .01; ***P < .001; ****P < .0001 2-tailed unpaired Student's t-test, mean + SEM.
Phenotypic characterization of splenic CD8+and CD4+T cells in RAG1−/−recipients. (A-B) To identify naive and memory CD8+ T cells, splenocytes were stained for CD3, CD8, CD62L, and CD44 expression. Shown are representative flow cytometry profiles of naive (CD44−CD62L+), central memory (CM; CD44+CD62L+), and effector memory (EM; CD44+CD62L−) T cells within the CD3+CD8+ T cells from young and aged nontransplanted mice and RAG1−/− recipients of DY and DO HSCs. (C) Quantification of naive CD3+CD8+ T cells within the total CD3+CD8+ population (Y, n = 8; O, n = 7; DY, n = 16; DO, n = 19). (D) Proliferation of CD3+CD8+ T cells isolated from young and old animals and RAG1−/− recipients of DY and DO HSCs was analyzed by expression of the nuclear protein Ki-67. Percentage of naive (CD44−) and memory (CD44+) CD3+CD8+ T cells, which are Ki-67+, are depicted (Y, O, n = 4; DY, n = 5; DO, n = 9). (E) CD3+CD8+ T cells isolated from nontransplanted young and old B6.SJL mice and RAG1−/− hosts transplanted with DY or DO HSCs were stained for the exhaustion marker PD-1, CD244.2, TIM-3, and LAG-3. Representative flow cytometric profiles of individual stains are depicted. (F) Percentages of the different inhibitory receptors within CD3+CD8+ T cells are shown (Y, n = 8; O, n = 7; DY, n = 16; DO, n = 19). (G-H) Splenic naive CD4+ T cells from recipients of DY and DO HSCs and nontransplanted young and aged mice were identified as CD44−CD62L+ cells within the CD3+CD4+ T-cell population. Representative dot plot profiles of the flow cytometric analysis are depicted. (I) Quantification of naive CD3+CD4+ T cells within the total CD3+CD4+ population (Y, n = 8; O, n = 7; DY, n = 16; DO, n = 19). *P < .05; **P < .01; ***P < .001; ****P < .0001 2-tailed unpaired Student's t-test, mean + SEM.
The CD4+ T-cell pool in young mice contained about 70% naive CD44−CD4+ T cells, which declined to less than 10% in aged mice, whereas the frequency of memory CD44+CD4+ T cells was elevated in aged animals (Figure 2G-I). Similar to the reconstitution of CD8+ T cells by HSCs, the frequencies of naive and memory CD4+ T-cell subsets in recipients of DY and DO HSCs resembled the CD4+ T-cell pools of young and aged mice, respectively (Figure 2A-B,G-H). The frequencies of naive CD4+ T cells were significantly higher in recipients of DY HSCs compared with recipients of DO HSCs (Figure 2G-I). Young and aged HSCs thus directly contribute to the generation of distinct naive and memory CD8+ and CD4+ T-cell subsets in transplanted hosts that are also found in young and old mice.
Aged HSCs confer an increase in the frequency of regulatory T cells
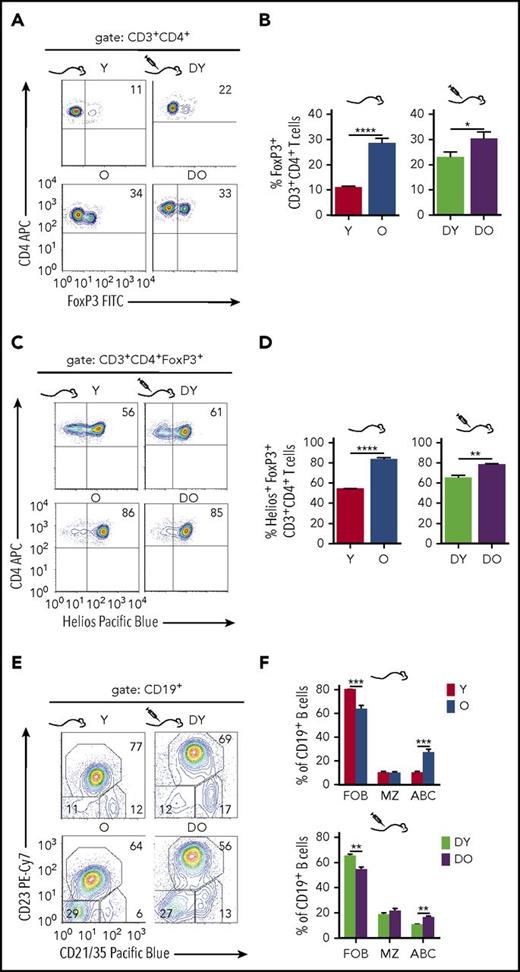
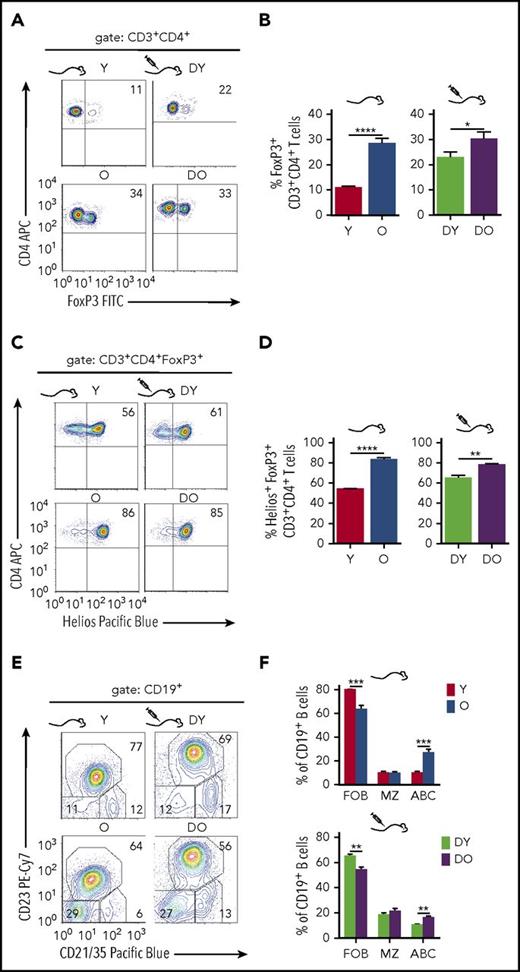
Regulatory Foxp3+CD4+ T cells (Tregs) are critical for the regulation of adaptive immune responses.22 In line with previous reports,23 aged mice showed a higher frequency of Tregs. The CD4+ T-cell pool in the spleen of young mice contained about 10% to 15% Tregs, whereas their frequency increased up to 35% in old mice (Figure 3A-B). Higher frequencies of Tregs were also found in recipients of DO HSCs compared with recipients of DY HSCs, whereas the difference was less pronounced but still significant (Figure 3A-B). Moreover, the frequency of Tregs that coexpress the transcription factor Helios24 was higher in aged mice and recipients of DO HSCs (Figure 3C-D). Helios expression is prominent but not exclusive in thymus-derived Tregs, and Helios+Foxp3+ Tregs are known to exhibit superior suppressive activities compared with Helios−Foxp3+ Tregs.25 Aged HSCs also contribute to the increase in the frequency of distinct Tregs in old animals.
Regulatory T- and B-cell subsets in HSC transplanted RAG1−/−mice. To identify regulatory T cells, splenocytes were stained for surface expression of CD3 and CD4 as well as intracellular FoxP3 expression. Representative graphs of individual stains for FoxP3 as well as quantification of FoxP3+ cells within the CD3+CD4+ population are shown in (A) and (B), respectively (Y, n = 8; O, n = 7; DY, n = 15; DO, n = 17). Regulatory T cells coexpressing the Ikaros zinc finger transcription factor Helios were identified within the FoxP3+ population. (C) Representative dot plot profiles of the underlying flow cytometric analysis and (D) quantification of Helios+ regulatory T cells within the FoxP3+ population (Y, n = 5; O, n = 5; DY, n = 4; DO, n = 7). For characterization of splenic B cells, CD19+ cells from young and old nontransplanted B6.SJL mice and RAG1−/− recipients of DY and DO HSCs were stained for follicular B cells (FOB; CD21/35+CD23+), marginal zone B cells (MZ; CD21/35highCD23−), and age-associated B cells (ABC; CD21/35−CD23−). Shown are representative graphs of individual stains (E) and quantification of these B-cell populations within the total CD19+ population (Y, n = 8; O, n = 7; DY, n = 13; DO, n = 16) (F). *P < .05; **P < .01; ***P < .001; ****P < .0001, 2-tailed unpaired Student's t-test, mean + SEM.
Regulatory T- and B-cell subsets in HSC transplanted RAG1−/−mice. To identify regulatory T cells, splenocytes were stained for surface expression of CD3 and CD4 as well as intracellular FoxP3 expression. Representative graphs of individual stains for FoxP3 as well as quantification of FoxP3+ cells within the CD3+CD4+ population are shown in (A) and (B), respectively (Y, n = 8; O, n = 7; DY, n = 15; DO, n = 17). Regulatory T cells coexpressing the Ikaros zinc finger transcription factor Helios were identified within the FoxP3+ population. (C) Representative dot plot profiles of the underlying flow cytometric analysis and (D) quantification of Helios+ regulatory T cells within the FoxP3+ population (Y, n = 5; O, n = 5; DY, n = 4; DO, n = 7). For characterization of splenic B cells, CD19+ cells from young and old nontransplanted B6.SJL mice and RAG1−/− recipients of DY and DO HSCs were stained for follicular B cells (FOB; CD21/35+CD23+), marginal zone B cells (MZ; CD21/35highCD23−), and age-associated B cells (ABC; CD21/35−CD23−). Shown are representative graphs of individual stains (E) and quantification of these B-cell populations within the total CD19+ population (Y, n = 8; O, n = 7; DY, n = 13; DO, n = 16) (F). *P < .05; **P < .01; ***P < .001; ****P < .0001, 2-tailed unpaired Student's t-test, mean + SEM.
Increased frequency of age-associated B cells in recipients of DO HSCs
Age-associated B cells (ABCs)26 are characterized by a lack of both CD21/35 and CD23 expression and represent an exhausted B-cell subset.27 The percentage of ABCs in the CD19+ B-cell pool was higher in the spleen of old compared with young mice (Figure 3E-F).26 The frequency of CD21/35+CD23+ follicular B cells was lower in old animals, whereas the frequency of CD21/35hiCD23− marginal zone B cells did not differ between young and old animals (Figure 3E-F). Similarly, compared with DY HSC recipients, transplants of DO HSCs presented with a higher frequency of ABCs, a lower frequency of follicular B cells, and no difference in marginal zone B cells (Figure 3E-F). Mice transplanted with HSCs thus showed a reconstitution of B-cell subsets resembling those found in young and old mice (Figure 3E-F). Therefore, aged HSCs also contribute to the age-associated changes in CD19+ B-cell subsets.
The immune systems in aged mice and recipients of DO HSCs show a reduced DNA vaccination response
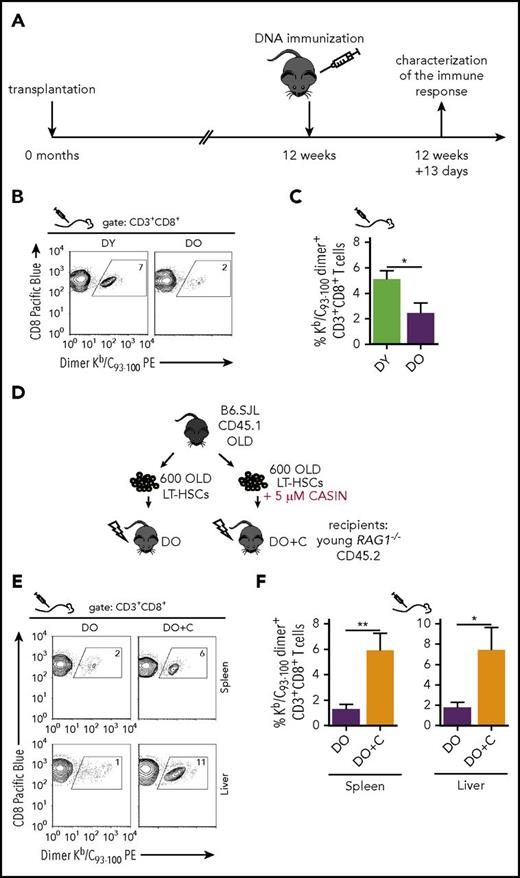
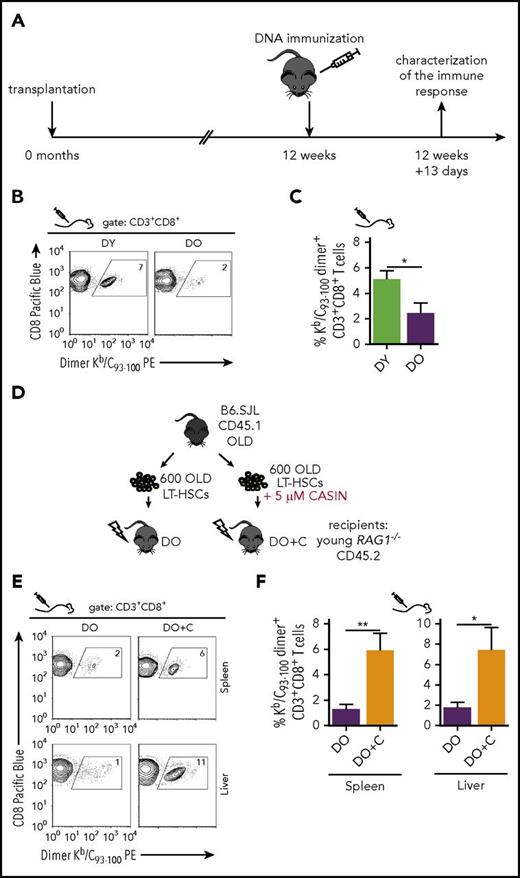
To examine the function of the immune systems, vaccination experiments were performed. DNA-based vaccination is an attractive technique to elicit antigen-specific CD8+ T-cell responses in mice because they allow direct antigen expression and MHC class I-restricted epitope presentation by in vivo transfected APCs.28-30 A hepatitis B virus Core antigen-expressing pCI/C vector induced core-specific CD8+ T cells in young and aged mice, but the frequency of de novo primed Kb/C93-100 dimer+ CD8+ T cells15 was significantly lower in aged mice (supplemental Figure 3). Similarly, compared with recipients of DY HSCs, a significantly lower frequency of Kb/C93-100 dimer+ CD8+ T cells was found in vaccinated recipients of DO HSCs (Figure 4A-C). These data support a novel concept in which primarily the age of HSCs determines the magnitude of the CD8+ T-cell response to vaccination.
Priming CD8+T-cell responses in HSC-transplanted RAG1−/−hosts by DNA vaccination. (A) Schematic representation of the experimental set-up: 12 weeks after transplantation, recipient mice were immunized with pCI/C DNA encoding the hepatitis B virus Core antigen. Thirteen days after immunization, splenic Kb/C93-100 dimer+ CD8+ T-cell frequencies were determined by flow cytometry. Representative graphs of individual stains as well as quantification of the KbC93-100 dimer staining are shown in (B) and (C), respectively (DY, n = 9; DO, n = 8). (D) Schematic representation of the experimental set-up. HSCs were isolated from old B6.SJL mice and cultured for 16 hours ± 5 µM CASIN. Subsequently, 600 HSCs were transplanted in subleathally irradiated young RAG1−/− mice. Twelve weeks after transplantation, recipient mice were immunized with the mammalian expression vector pCI/C. Thirteen days after immunization, transplanted mice were sacrificed and the percentage of Kb/C93-100 dimer+ cells was determined within the CD3+CD8+ population by flow cytometry. Quantification as well as representative graphs of the Kb/C93-100 dimer staining for spleen (DO, n = 11; DO+C, n = 9) and liver (DO, n = 8; DO+C, n = 6) are shown in (E) and (F), respectively. *P < .05; **P < .01, 2-tailed unpaired Student's t-test, mean + SEM.
Priming CD8+T-cell responses in HSC-transplanted RAG1−/−hosts by DNA vaccination. (A) Schematic representation of the experimental set-up: 12 weeks after transplantation, recipient mice were immunized with pCI/C DNA encoding the hepatitis B virus Core antigen. Thirteen days after immunization, splenic Kb/C93-100 dimer+ CD8+ T-cell frequencies were determined by flow cytometry. Representative graphs of individual stains as well as quantification of the KbC93-100 dimer staining are shown in (B) and (C), respectively (DY, n = 9; DO, n = 8). (D) Schematic representation of the experimental set-up. HSCs were isolated from old B6.SJL mice and cultured for 16 hours ± 5 µM CASIN. Subsequently, 600 HSCs were transplanted in subleathally irradiated young RAG1−/− mice. Twelve weeks after transplantation, recipient mice were immunized with the mammalian expression vector pCI/C. Thirteen days after immunization, transplanted mice were sacrificed and the percentage of Kb/C93-100 dimer+ cells was determined within the CD3+CD8+ population by flow cytometry. Quantification as well as representative graphs of the Kb/C93-100 dimer staining for spleen (DO, n = 11; DO+C, n = 9) and liver (DO, n = 8; DO+C, n = 6) are shown in (E) and (F), respectively. *P < .05; **P < .01, 2-tailed unpaired Student's t-test, mean + SEM.
CASIN-treated aged HSCs restore an efficient CD8+ T-cell response to DNA vaccination
We previously reported that the elevated activity of the small RhoGTPase Cdc42 is causative for aging of HSCs. Ex vivo treatment of aged HSCs with the Cdc42 inhibitor CASIN reverts the aging-associated phenotypes of HSCs.12 CASIN is thus thought to rejuvenate aged HSCs.12 As a consequence, we hypothesized that the functional decline of the old immune system in recipients of DO HSCs (Figure 4B-C) might be attenuated by CASIN-treatment of aged HSCs.
We transplanted untreated aged HSCs (DO) or CASIN-treated aged HSCs (DO+C) into RAG1−/− mice (Figure 4D), followed by a single injection of the pCI/C vector at 12 weeks posttransplantation. Compared with recipients of DO HSCs, the frequencies of Kb/C93-100-specific dimer+ CD8+ T cells were significantly higher in spleen and liver of recipients of DO+C HSCs (Figure 4E-F). The frequencies of Kb/C93-100-specific CD8+ T cells in vaccinated recipients of DO+C and DY HSCs were very similar (Figure 4C,F). DO+C HSCs thus generate an immune system capable of mounting a strong CD8+ T-cell response to DNA vaccination. Recipients of DO and DO+C HSCs showed similar frequencies of donor-derived white blood cells in the spleen and a slight increase in the frequencies of B cells (supplemental Figure 4A-B). However, we observed a significant increase in the frequency of naive CD8+ T cells and a strong trend toward a higher frequency of CD4+ T cells in recipients of DO+C HSCs when compared with recipients of DO HSCs (supplemental Figure 4C-D). These elevated frequencies of T-cell subsets in DO+C recipients might explain, at least partially, the ability to mount the elevated frequency of Kb/C93-100-specific CD8+ T cells in these mice.
DY and DO+C HSCs generate comparable gene expression profiles in T and B cells
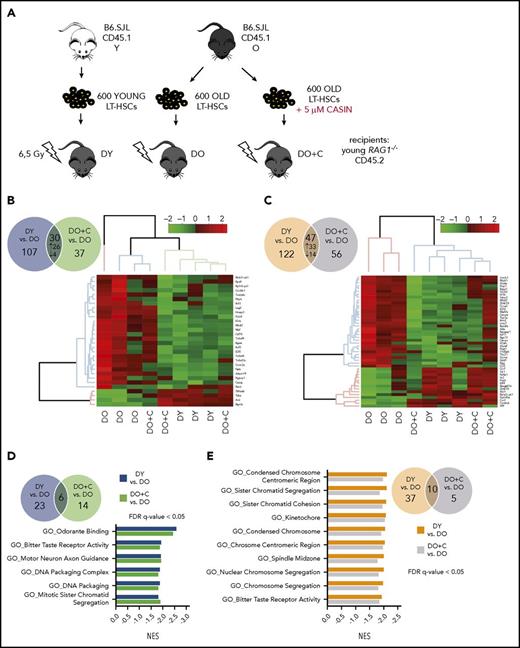
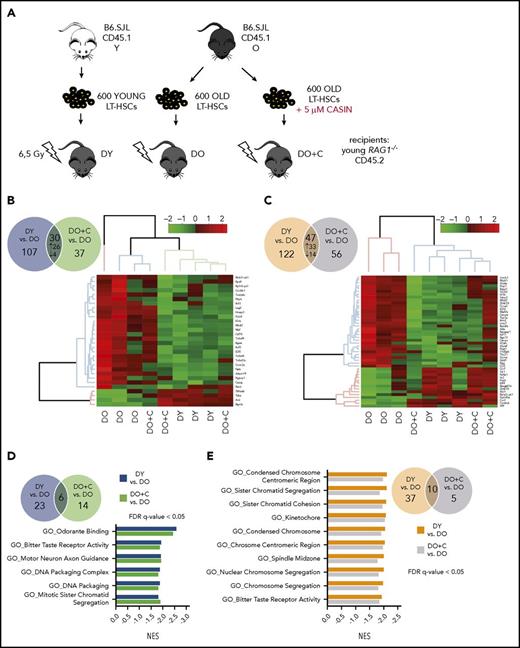
To obtain information on the extent to which CASIN treatment of aged HSCs affects the gene expression profile of daughter B and T cells, RNAseq analyses were performed on naive CD4+ T cells and CD19+ B cells isolated from DO, DO+C, or DY HSC recipients (Figure 5). In RNAseq analysis, we identified 137 significantly differentially expressed protein-coding genes by comparing CD4+ T cells isolated from recipients of DY to DO HSCs. Similarly, comparison of CD4+ T cells isolated from recipients of DO+C and DO HSCs revealed 67 significantly differentially expressed genes. Thirty genes were in common between the 2 analyses, where 26 genes were up- and 4 were downregulated (Figure 5B; supplemental Table 2). Unsupervised clustering-based heat map of these differentially expressed genes showed that DO+C HSC recipients primarily clustered with DY HSC recipients, with only 1 of the 3 samples falling into the DO HSCs cluster (Figure 5B). In the analysis of CD19+ B cells, we identified 169 and 103 protein-coding genes significantly differentially expressed by comparing cells isolated from recipients of DY to DO HSCs and DO+C to DO HSCs (Figure 5C). Forty-seven of these genes were in common between the 2 comparisons and showed the same direction of change in expression (33 genes upregulated, 14 genes downregulated; Figure 5C; supplemental Table 3). Unsupervised hierarchical clustering of these genes revealed that B cells isolated from recipients of DY and DO+C HSCs clustered together, whereas those from DO HSCs formed a separate cluster (Figure 5C).
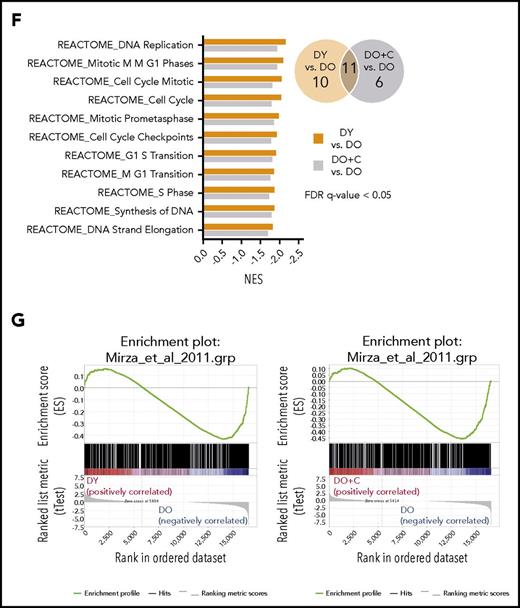
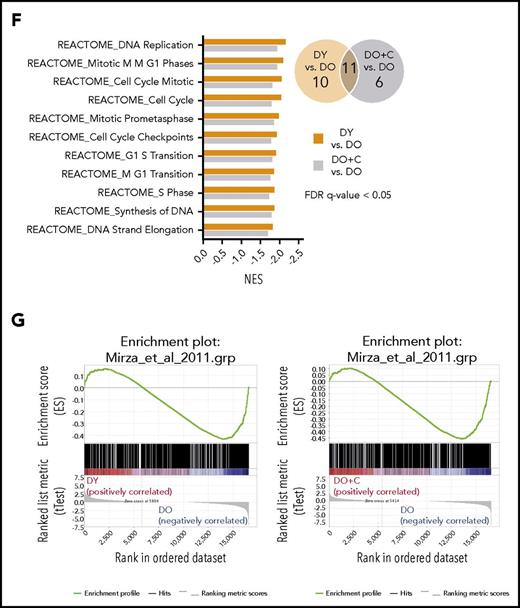
Gene expression profiles of naive CD4+T cells and CD19+B cells isolated from HSC-transplanted RAG1−/−mice. (A) Schematic representation of the experimental setup: HSCs were isolated from young and old B6.SJL (CD45.1) mice and cultured for 16 hours ± 5 µM CASIN. 600 HSCs were transplanted into sublethally irradiated young RAG1−/− (CD45.2) recipients. Twelve weeks after transplantation, naive CD4+ T and CD19+ B cells were isolated and RNA sequencing was performed (B) Venn diagram of significantly differentially expressed genes in naive CD4+ T cells between DY vs DO (blue circle) and DO+C vs DO (green circle). The heat map shows unsupervised clustering of the genes expressed differentially in the same direction between the 2 groups. (C) Venn diagram of significantly differentially expressed genes in CD19+ B cells between DY vs DO (orange circle) and DO+C vs DO (violet circle). Genes, differentially expressed in the same direction between the 2 groups, are depicted as heat map (unsupervised clustering). (D) Venn diagram shows GSEA of significantly enriched GO gene sets differentially expressed in naive CD4+ T cells between DY vs DO (blue circle) and DO+C vs DO (green circle). Normalized enrichment scores (NES) of GO categories differentially expressed in the same direction between the 2 groups are depicted. (E-F) Venn diagrams show GSEA of significantly enriched GO and REACTOME gene sets, respectively, differentially expressed in CD19+ B cells between DY vs DO (orange circle) and DO+C vs DO (violet circle). NES of GO and REACTOM categories differentially expressed in the same direction between the 2 groups are depicted. (G) GSEA enrichment plots of correlation between gene sets previously identified by Mirza et al.33 to be differentially expressed in naive CD4+ T cells from nontransplanted young and aged mice and differentially expressed genes between DY and DO HSC recipients as well as DO+C and DO recipients. DY, DO and DO+C, n = 3. (D-F) FDR q-value < 0.05; (G) FDR q-value < 0.25.
Gene expression profiles of naive CD4+T cells and CD19+B cells isolated from HSC-transplanted RAG1−/−mice. (A) Schematic representation of the experimental setup: HSCs were isolated from young and old B6.SJL (CD45.1) mice and cultured for 16 hours ± 5 µM CASIN. 600 HSCs were transplanted into sublethally irradiated young RAG1−/− (CD45.2) recipients. Twelve weeks after transplantation, naive CD4+ T and CD19+ B cells were isolated and RNA sequencing was performed (B) Venn diagram of significantly differentially expressed genes in naive CD4+ T cells between DY vs DO (blue circle) and DO+C vs DO (green circle). The heat map shows unsupervised clustering of the genes expressed differentially in the same direction between the 2 groups. (C) Venn diagram of significantly differentially expressed genes in CD19+ B cells between DY vs DO (orange circle) and DO+C vs DO (violet circle). Genes, differentially expressed in the same direction between the 2 groups, are depicted as heat map (unsupervised clustering). (D) Venn diagram shows GSEA of significantly enriched GO gene sets differentially expressed in naive CD4+ T cells between DY vs DO (blue circle) and DO+C vs DO (green circle). Normalized enrichment scores (NES) of GO categories differentially expressed in the same direction between the 2 groups are depicted. (E-F) Venn diagrams show GSEA of significantly enriched GO and REACTOME gene sets, respectively, differentially expressed in CD19+ B cells between DY vs DO (orange circle) and DO+C vs DO (violet circle). NES of GO and REACTOM categories differentially expressed in the same direction between the 2 groups are depicted. (G) GSEA enrichment plots of correlation between gene sets previously identified by Mirza et al.33 to be differentially expressed in naive CD4+ T cells from nontransplanted young and aged mice and differentially expressed genes between DY and DO HSC recipients as well as DO+C and DO recipients. DY, DO and DO+C, n = 3. (D-F) FDR q-value < 0.05; (G) FDR q-value < 0.25.
Most prominent in the upregulated gene expression profile of naive CD4+ T cells from DO HSC recipients were genes implicated in Treg functions (itgae, ikzf2, folr4, lag3) and inflammation (penk, adam19, coro2a)31 (Figure 5B). In CD19+ B cells from DO HSC recipients, we found altered expression of genes associated with cellular senescence (abl1, irs2, rrm2, s100a8), the cytokine/chemokine network (ccl5, scimp), cell proliferation (mki67, racgap1, top2a), cell migration (ccr7, cmtm6, cnr2), and B-cell receptor signaling (fosb). Furthermore, the expression of the transcription factor t-bet, a key attribute of ABCs,32 was upregulated in CD19+ B cells from DO HSC recipients (Figure 5C).
To identify pathways and biological processes altered in recipients of DY, DO+C, and DO HSCs, we performed gene set enrichment analysis (GSEA). Gene ontology (GO) analysis revealed significant enrichment (false discovery rate [FDR] q value < 0.05) of 29 and 20 gene sets in naive CD4+ T cells isolated from recipients of DY and DO+C HSCs when compared with recipients of DO HSCs (Figure 5D). We identified 6 overlapping gene sets downregulated in recipients of DY and DO+C HSCs compared with recipients of DO HSCs (Figure 5D). Chromatin organization (GO_DNA Packaging Complex and GO_DNA Packaging) and mitosis (GO_Mitotic Sister Chromatid Segregation) were among the significantly deregulated gene sets, implying that naive CD4+ T cells isolated from recipients of DO HSCs might show an altered chromatin or mitotic transition structure as compared with T cells isolated from recipients of DY and DO+C HSCs. Importantly, CASIN-treatment of aged HSCs (DO+C) resulted in a gene expression profile for chromatin structure in naive CD4+ T cells similar to the profile found in CD4+ T cells of DY HSC recipients.
GSEA of CD19+ B cells revealed 47 (DY vs DO HSC recipients) and 15 (DO+C vs DO HSC recipients) significantly deregulated GO gene sets (Figure 5E). In a similar analysis, 21 and 17 REACTOME gene sets were significantly enriched in DY vs DO HSC recipients and DO+C vs DO HSC recipient comparisons (Figure 5F). Ten of the GO terms and 11 of the REACTOME gene sets were enriched (FDR q value < 0.05) in both DY vs DO HSC recipients and DO+C vs DO HSC recipients comparisons (Figure 5E-F). Interestingly, all the overlapping gene sets were upregulated in CD19+ B cells isolated from recipients of DO HSCs. Of significance, 9 of the 10 GO gene sets and all of the 11 REACTOME gene sets were related to cell cycle, proliferation, and mitosis (Figure 5E-F), indicating that B cells developing from DO HSCs might contain an enhanced proliferation activity. In contrast, DO+C HSCs generated B cells characterized by a proliferation profile similar to that seen in B cells repopulated from DY HSCs, indicating that CASIN-treatment of aged HSCs restored a young B-cell compartment.
We also performed GSEA on genes previously identified by Mirza et al.33 to be differentially expressed between naive CD4+ T cells from young and aged mice. Our analysis showed an enrichment of those genes to differentially expressed genes (P value < .05 and FDR < 0.25) between DY and DO HSC recipients (Figure 5G; supplemental Figure 5). This demonstrates that naive CD4+ T cells isolated from young mice and recipients of DY HSCs are very similar. When comparing the differentially expressed genes between young and aged naive CD4+ T cells of Mirza et al and differentially expressed genes between naive CD4+ T cells from DO+C and DO HSC recipients, we could observe the same enrichment. This supports that the transcriptional profile of naive CD4+ T cells in DO+C HSC recipients mimics that of CD4+ T cells in DY HSC recipients, and even more important, that naive CD4+ T cells in DO+C HSC recipients present with a transcription profile very similar to CD4+ T cells from young mice.
Discussion
Our data support that AAIR (both phenotypic and functional) is driven to a large extent by aging of HSCs. As a consequence, rejuvenated DO+C HSCs restore an immune system capable of mounting a strong vaccination response, which is similar to that of recipients of DY HSCs. Changes in the number of specific types of immune cells (eg, CD8+ T cells) developing in recipients of DO+C HSCs, most likely in combination with an improved function of these cells, might be a crucial driving force for attenuating AAIR and mounting a strong vaccination response. In this study, we primed CD8+ T-cell responses by DNA-based immunization. After a single injection of antigen-expressing vector DNA, CD8+ T-cell responses peaked at 11 to 13 days postinjection.15 Thus, this vaccine allows the determination of de novo primed CD8+ T cells in nontransplanted mice and recipients of HSCs under standardized conditions. DNA-based vaccination is also of clinical interest and is tested in various clinical trials.30
Using young RAG1−/− mice as hosts, we are able avoid confounding effects from cells that resist irradiation in transplantation models that use immunocompetent recipients.16 In RAG1−/− recipients, all distinct types of T and B cells are offspring of transplanted donor HSCs in an environment initially devoid of lymphoid cells. Transplantation into RAG1−/− mice is thus an attractive tool to directly compare DY, DO, and DO+C HSCs with respect to lymphoid contribution and function. RAG1−/− mice reconstituted with DO or DY HSCs showed an immunization response that was almost identical to that in young and aged mice. However, the immune systems established from transplanted HSCs in the complete absence of host T and B cells might not be fully identical to immune systems established by the normal developmental route and might limit the ultimate extent of the generalization of our findings. Furthermore, mice are housed under specific pathogen-free conditions, and the murine immune system, although regarded as a valued model also for AAIR in humans, is still distinct from the human immune system.34 Therefore, some of our findings might be, with limitations, also relevant for humans.
We report here that aged HSCs provide lower numbers of naive T cells to the periphery. These findings show that aged HSCs present with intrinsic defects that, at least in part, cause AAIR and suggest either that aged HSCs are impaired in the production of T-cell progenitors or that T-cell progenitors derived from aged HSCs are impaired in thymus homing and/or interactions with the thymic stroma,5,35 even in an environment conducive for proper maturation of T cells in a young thymus. Aging-associated changes in T-lymphopoiesis have been linked to thymic involution.5 Our data demonstrate that aging of HSCs is able to cause changes in T-lymphopoiesis, and in transplantation experiments, aged HSCs mimic at least in part aged T-lymphopoiesis. In combination with published reports on the role of the thymus for AAIR, the data therefore support a role for both HSC intrinsic as well as extrinsic processes that contribute to AAIR.
To the same extent as the frequency of naive T cells declines in aged mice, memory T-cell subsets accumulate.17,36 The memory T-cell pool in aged mice is thought to arise from naive CD8+ T cells in response to self-peptide/MHC ligands and signaling through various cytokines (eg, interleukin 7, interleukin 15).17 Memory-phenotype CD8+ T cells are found before birth in humans and in unimmunized mice housed under germ-free or even antigen-free conditions, indicating that the bulk of memory T cells in mice, and possibly to some extent also in humans, is distinct from other types of antigen-specific memory T cells.17,37 We showed that unimmunized aged mice and recipients of DO HSCs, but not young mice and recipients of DY HSCs, contained a high number of effector memory CD8+ T cells. The thymus-independent generation of this T-cell subset may be directly linked to the reduced numbers of naive T cells in recipients of DO HSCs, and thus indirectly conferred by aged HSCs.
Distinct interventional approaches similar to, in our example, the inhibition of the elevated Cdc42 activity in old HSCs with CASIN12 have been reported to attenuate aging of HSCs.38-40 As DO+C HSCs restore an immune system capable of mounting a strong vaccination response similar to that primed in recipients of DY HSCs, our data further provide rationale for testing CASIN in vivo in aged animals. Clinical relevance for a role of inhibition of Cdc42 activity upon aging is implied by the fact that also in humans Cdc42 activity in blood cells positively correlates with aging, whereas gene expression association studies revealed a correlation between elevated Cdc42 expression in hematopoietic cells and morbidity.41,42
Most interestingly, the transcriptional profile of T and B cells reconstituted from DY and DO HSCs mimicked that of T and B cells in young and aged animals. The profile of T and B cells derived from DO+C HSCs was more like the profile of young T and B cells. The differentially expressed genes and pathways identified in our analyses are thus likely to be causatively linked to AAIR in T and B cells. The data also imply that expression profiles down to terminally differentiated T and B cells are already decided in HSCs themselves and are, at least partially, regulated by changes in the activity Cdc42. As HSCs do not express T- and B-cell genes, the mechanisms therefore will need to be based on yet-to-be-identified epigenetic mechanisms that do not directly regulate transcription. Previous publications already implied a role of epigenetic dysfunction as a contributor to HSC aging.43 We previously showed that CASIN treatment of aged HSCs restored the apolar distribution of the epigenetic marker histone 4 acetylated on lysine 16 (H4K16) in the nucleus of aged HSCs back to the polar distribution found in young HSCs, and also restored the level of H4K16 to the higher level seen in young HSCs. Such changes of the epigenetic make-up in HSCs might thus direct phenotypic and functional changes in immune cells on HSC differentiation that include a multitude of other types and levels of epigenetic mechanisms awaiting further investigation. In conclusion, we present an attractive strategy to attenuate or even revert AAIR by CASIN-mediated rejuvenation of aged HSCs.
The online version of this article contains a data supplement.
The publication costs of this article were defrayed in part by page charge payment. Therefore, and solely to indicate this fact, this article is hereby marked “advertisement” in accordance with 18 USC section 1734.
Acknowledgments
The authors thank the Core Facility fluorescence-activated cell sorting at Ulm University for cell sorting support, the DNA Sequencing and Genotyping Core at Cincinnati Children’s Hospital Medical Center (CCHMC) for assistance with RNA sequencing, and the Tierforschungszentrum of the University of Ulm, as well as the Comprehensive Mouse and Cancer Core at CCHMC, for support with animal experiments. Furthermore, the authors thank Nadine Schweizer and Kalpana Nattamai for excellent technical assistance.
This work was supported by grants from the Bundesministerium für Bildung und Forschung (systems biology analysis of impaired stem cell function and regeneration during aging [SyStaR]) (H.G. and M.D.) and from the Deutsche Forschungsgemeinschaft Graduiertenkolleg (GRK) 1789 Cellular and Molecular Mechanisms in Aging (H.G. and R.S.). The laboratory of H.G. was further supported by National Institutes of Health grants HL076604, DK077762, AG040118, and DK104814; the Deutsche Forschungsgemeinschaft (GRK 2254 HEIST and SFBs 1074, 1149, and 1275); and the Excellence-Initiative of the Baden-Württemberg Foundation. The laboratory of R.S. was further supported by grants from the Deutsche Forschungsgemeinschaft (GRK 2254 HEIST; SCHI505/6-1) and the Böhringer Ingelheim Ulm University Bio Center. H.L. is a PhD candidate at Ulm University. This work is submitted in partial fulfilment of the requirement for the PhD.
Authorship
Contribution: H.L., M.D., H.G., and R.S. designed and interpreted experiments and wrote the manuscript; H.L. analyzed and performed experiments; K.E. and V.S. performed experiments; M.M. performed biocomputational analyses; and Y.L. provided reagents.
Conflict-of-interest disclosure: The authors declare no competing financial interests.
Correspondence: Hartmut Geiger, Institute of Molecular Medicine Stem Cell and Aging, Ulm University, Meyerhofstrasse, 89081 Ulm, Germany; e-mail: hartmut.geiger@uni-ulm.de; and Reinhold Schirmbeck, Department of Internal Medicine I, University Hospital Ulm, Albert-Einstein-Allee 23, 89081 Ulm, Germany; e-mail: reinhold.schirmbeck@uni-ulm.de.
References
Author notes
H.G. and R.S. share senior authorship.

