Key Points
A prosurvival transcriptional feedback loop via p300 enables acute tolerance to BET inhibition.
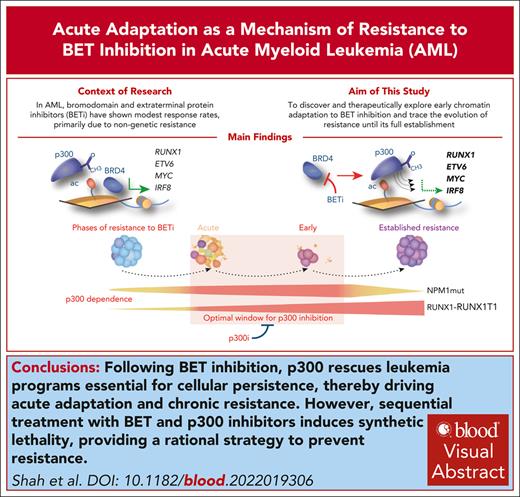
BET followed by p300 inhibition improves cytotoxicity in AML and is optimally deployed during early stages of resistance to BET inhibitors.
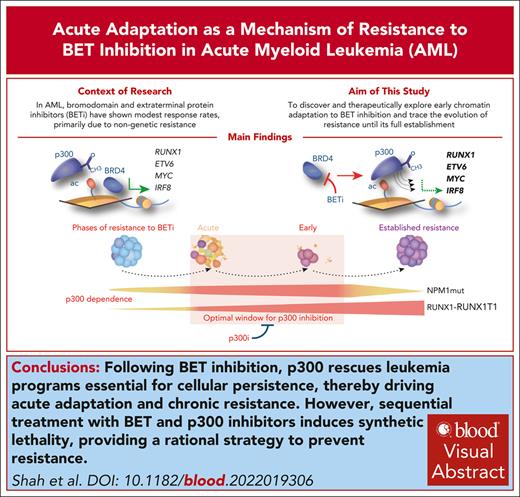
Visual Abstract
Initial clinical trials with drugs targeting epigenetic modulators, such as bromodomain and extraterminal protein (BET) inhibitors, demonstrate modest results in acute myeloid leukemia (AML). A major reason for this involves an increased transcriptional plasticity within AML, which allows the cells to escape therapeutic pressure. In this study, we investigated the immediate epigenetic and transcriptional responses after BET inhibition and demonstrated that BET inhibitor–mediated release of bromodomain-containing protein 4 from chromatin is accompanied by acute compensatory feedback that attenuates downregulation or even increases the expression of specific transcriptional modules. This adaptation is marked at key AML maintenance genes and is mediated by p300, suggesting a rational therapeutic opportunity to improve outcomes by combining BET and p300 inhibition. p300 activity is required during all steps of resistance adaptation; however, the specific transcriptional programs that p300 regulates to induce resistance to BET inhibition differ, in part, between AML subtypes. As a consequence, in some AMLs, the requirement for p300 is highest during the earlier stages of resistance to BET inhibition, when p300 regulates transitional transcriptional patterns that allow leukemia-homeostatic adjustments. In other AMLs, p300 shapes a linear resistance to BET inhibition and remains critical throughout all stages of the evolution of resistance. Altogether, our study elucidates the mechanisms that underlie an “acute” state of resistance to BET inhibition, achieved through p300 activity, and how these mechanisms remodel to mediate “chronic” resistance. Importantly, our data also suggest that sequential treatment with BET and p300 inhibition may prevent resistance development, thereby improving outcomes.
Introduction
Dysregulated epigenetic and transcriptional processes are central determinants of acute myeloid leukemia (AML) plasticity.1-5 Consequently, modulators of aberrant transcriptional activation are, theoretically, attractive therapeutic targets, with bromodomain and extraterminal protein (BET) inhibitors serving as a paradigm of novel epigenetic treatments in AML.6-8 BET inhibitors predominantly target bromodomain-containing protein 4 (BRD4), an epigenetic reader that recognizes acetylated histones H3/H4 and transcription factors (TFs), mediates transcriptional elongation/enhancer–directed transcription, and further recruits cofactors.9-12 BRD4 commonly associates with cancer-maintenance genes (eg, MYC and RUNX1) that are decorated with high-level acetylation, thus leading to selective cancer dependency on BRD4.13
A major issue with BET inhibitors became apparent after their introduction into clinical trials. This consisted of modest response rates as monotherapy, due to either primary or acquired resistance.14-18 As has been demonstrated for resistance to other novel epigenetic drugs, BET inhibitor resistance appears predominantly nongenetic, suggesting that epigenetic adaptation underlies this process.14-16,19-21 This is further evidenced by the rapid restoration of MYC transcription in BET inhibitor–resistant cells despite continued BRD4 inhibition or by recent reports of treatment strategies to target BET inhibitor–resistant cells, using epigenetic inhibitors to LSD1 or CDK7.14,16,22,23
AML usually responds to initial treatment but frequently relapses later. The development of resistance requires both the initial survival and immediate adaptation under selective therapeutic pressure.24,25 However, the mechanisms that underpin these acute processes are poorly understood. Furthermore, it remains unexplained whether mechanisms underpinning initial adaptation and later full-blown resistance are uniform or further evolve. Obtaining such knowledge will allow for better design of upfront treatments and possible maintenance strategies.
Here, we hypothesize that transcriptional plasticity in AML mediates early pathways of adaptation to and escape from BET inhibition. We predict that this plasticity provides new epigenetic vulnerabilities that, when properly inhibited, may extinguish later resistance.
Methods
The work with patient samples was conducted under authority granting ethics approval (UK Health Departments' Research Ethics Service reference number REC 07-MRE05-44 and Ethik-Kommission der Landesärztekammer Rheinland-Pfalz reference number 2019-14110). All animal experiments complied with local and UK national regulations and were performed under an existing UK Home Office project license (PA46C00DB).
Results
Compensation for BRD4 exclusion from chromatin via BET inhibition occurs through acute redistribution of p300 to critical AML maintenance genes
To probe early responses across the genetic spectrum of AML, we treated 6 cell lines with the BET inhibitor iBET-151 (hereafter BETi6; supplemental Figure 1A, available on the Blood website; supplemental Table 1). We and others have extensively documented the effects of BET inhibition in KMT2A-rearranged or NPM1-mutated AML.6,8,13 Complementary to previous data, we found that samples with RUNX1-RUNX1T1 rearrangement (KASUMI-1 and SKNO1 cell lines and 2 primary patient samples) exhibited the highest sensitivity to BETi, with significant reductions in viability and colony numbers (supplemental Figure 1B-E). To validate the effects of BETi in RUNX1-RUNX1T1–rearranged AML in vivo, we used an Aml1-Eto9a–driven murine AML model.26Aml1-Eto9a–expressing cKIT-high/Ter-119–negative murine fetal liver cells were either transplanted into mice or serially plated in methylcellulose (supplemental Figure 1F). Transformation occurred in both settings, but BETi treatment led to a significant reduction in colony numbers in vitro and extended disease latency/improved survival in vivo (supplemental Figure 1G-L).
Leukemia maintenance in RUNX1-RUNX1T1–rearranged AML relies on a refined balance between RUNX1-RUNX1T1 and wild-type RUNX1.27-31 Cooperative binding of PU.1, FLI1, ERG, and LMO229,32 influences this balance, whereas p300/CREBBP (CREB-binding protein) mediates local activation through acetylation of histones/TFs33-35 and recruitment of BRD4 to facilitate transcriptional elongation at paused promoters.36,37 Because the mechanisms underlying RUNX1-RUNX1T1–rearranged AML maintenance are well understood, this model was deemed optimal to deconvolute early chromatin processes upon BETi treatment (overview in supplemental Figure 2A).
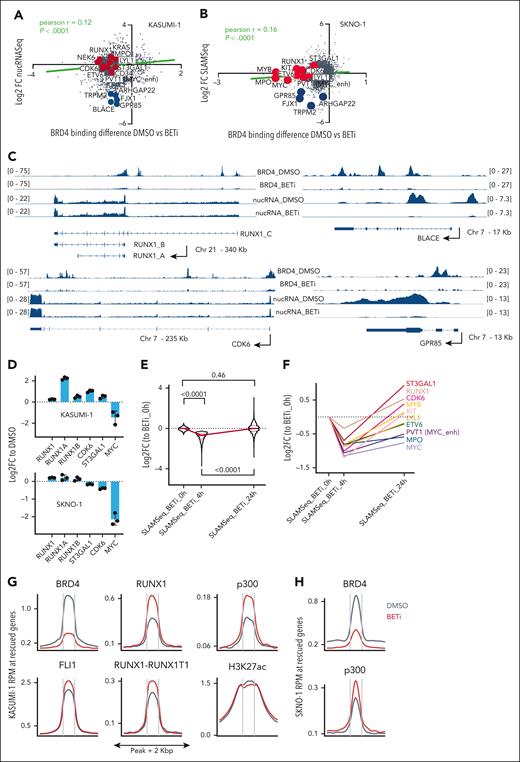
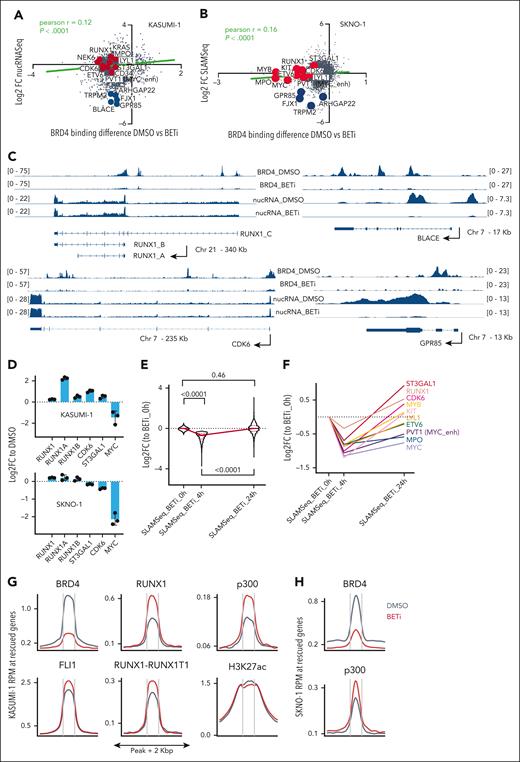
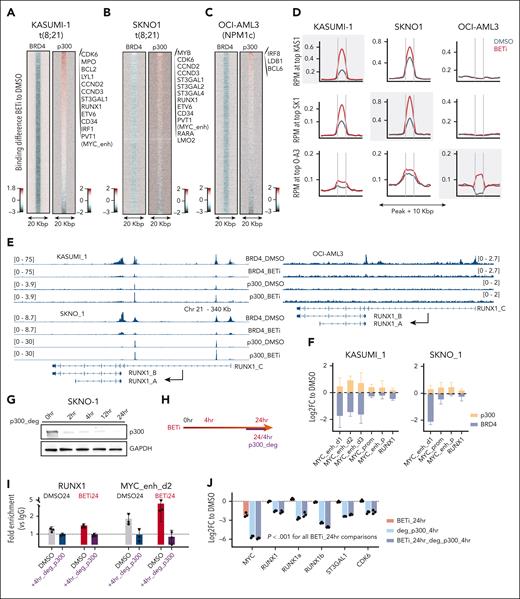
We assessed the binding of BRD4 via chromatin immunoprecipitation followed by sequencing (ChIP-Seq) in KASUMI-1 and SKNO1 cells at 24 hours after treatment. This was long enough to allow the release of BRD4 from chromatin but before the onset of cell-cycle arrest/apoptosis (supplemental Figure 2B-C). To link this with the dynamics of transcription, we measured differential nuclear RNA sequencing (RNA-Seq) in KASUMI-1 and de novo transcription via SLAM-Seq in SKNO1 cells after 24 hours of treatment (Figure 1A-B). As expected, BETi excluded BRD4 from chromatin (Figures 1A-C and 2A-B). Surprisingly, at many essential AML maintenance genes, including ETV6, MYC, CDK6, ST3GAL1, CD34, and the MYC enhancer PVT1, loss of BRD4 provoked only modest reductions in nuclear messenger RNA levels or de novo transcription (Figure 1A-B). Furthermore, loss of BRD4 did not consistently lead to decreased transcription; for example, RUNX1, LYL1, KRAS, and MPO in KASUMI-1 and RUNX1, MYB, KIT, CDK6, and ST3GAL1 in SKNO1 all showed increased transcription after 24 hours of BETi treatment (Figure 1A-C). Meanwhile, at nonessential transcripts such as BLACE, GPR85, FJX1, or TRPM2, BRD4 exclusion significantly decreased transcription (Figure 1A-C). Due to this variance, global dynamics of transcription correlated only weakly with the degree of BRD4 exclusion (Figure 1A-B). We confirmed the blunting of BETi effects on RUNX1 isoforms, ST3GAL1, and CDK6 using quantitative polymerase chain reaction (qPCR), demonstrating higher or only marginally decreased expression levels after 24 hours of BETi treatment (Figure 1D).
Compensation for the exclusion of BRD4 from chromatin via BET inhibition occurs through acute redistribution of p300 to critical AML maintenance genes. (A) Correlation of nuclear RNA-Seq (nucRNA-Seq) with BRD4 binding dynamics in DMSO vs BETi-treated KASUMI-1 cells. Shown are signals that matched to both BRD4 and nucRNA-Seq peaks. Signals were annotated to the nearest promoters. (B) Correlation of SLAM-Seq with BRD4 binding dynamics in DMSO vs BETi-treated SKNO1 cells. BRD4 peaks were annotated to the nearest promoters and matched to the corresponding 3’UTR regions from SLAM-Seq. (C) Examples of BRD4 binding and nucRNA-Seq profiles in DMSO and BETi-treated KASUMI-1 cells to demonstrate the rescue of messenger RNA production at/near promoters of the main RUNX1 isoforms and CDK6 upon BETi but not at/near the BLACE or GPR85 promoters. (D) Analysis of qPCR expression of the indicated transcripts/genes in KASUMI-1 and SKNO1 cells after treatment with either DMSO or BETi (24 hours). Shown are log2 fold changes (FCs) normalized to DMSO-treated controls and standard deviation (SD) from 3 biological replicates. (E) SLAM-Seq intensity at the 933 rescued genes at 0 hour (DMSO), 4 hours, and 24 hours after BET inhibition. Shown are log2 FC ratios compared with 0 hour (DMSO-treated controls). Three biological replicates were acquired per condition/time point. (F) SLAM-Seq intensity at the indicated exemplar rescued genes at 0 hour (DMSO), 4 hours, and 24 hours after BET inhibition. Shown are log2 FC ratios compared with 0 hours (DMSO-treated controls). Three biological replicates were acquired per condition/time point. (G) Average binding curve profiles for BRD4, p300, RUNX1, FLI1, RUNX1-RUNX1T1, and H3K27ac in DMSO and BETi-treated KASUMI-1 cells, to demonstrate the BETi-triggered increase of p300 and RUNX1 binding at/near the rescued genes. (H) Average binding curve profiles for BRD4 and p300 in DMSO and BETi-treated SKNO1 cells, to demonstrate the BETi-triggered increase of p300 binding at/near the rescued genes. Chr, chromosome.
Compensation for the exclusion of BRD4 from chromatin via BET inhibition occurs through acute redistribution of p300 to critical AML maintenance genes. (A) Correlation of nuclear RNA-Seq (nucRNA-Seq) with BRD4 binding dynamics in DMSO vs BETi-treated KASUMI-1 cells. Shown are signals that matched to both BRD4 and nucRNA-Seq peaks. Signals were annotated to the nearest promoters. (B) Correlation of SLAM-Seq with BRD4 binding dynamics in DMSO vs BETi-treated SKNO1 cells. BRD4 peaks were annotated to the nearest promoters and matched to the corresponding 3’UTR regions from SLAM-Seq. (C) Examples of BRD4 binding and nucRNA-Seq profiles in DMSO and BETi-treated KASUMI-1 cells to demonstrate the rescue of messenger RNA production at/near promoters of the main RUNX1 isoforms and CDK6 upon BETi but not at/near the BLACE or GPR85 promoters. (D) Analysis of qPCR expression of the indicated transcripts/genes in KASUMI-1 and SKNO1 cells after treatment with either DMSO or BETi (24 hours). Shown are log2 fold changes (FCs) normalized to DMSO-treated controls and standard deviation (SD) from 3 biological replicates. (E) SLAM-Seq intensity at the 933 rescued genes at 0 hour (DMSO), 4 hours, and 24 hours after BET inhibition. Shown are log2 FC ratios compared with 0 hour (DMSO-treated controls). Three biological replicates were acquired per condition/time point. (F) SLAM-Seq intensity at the indicated exemplar rescued genes at 0 hour (DMSO), 4 hours, and 24 hours after BET inhibition. Shown are log2 FC ratios compared with 0 hours (DMSO-treated controls). Three biological replicates were acquired per condition/time point. (G) Average binding curve profiles for BRD4, p300, RUNX1, FLI1, RUNX1-RUNX1T1, and H3K27ac in DMSO and BETi-treated KASUMI-1 cells, to demonstrate the BETi-triggered increase of p300 and RUNX1 binding at/near the rescued genes. (H) Average binding curve profiles for BRD4 and p300 in DMSO and BETi-treated SKNO1 cells, to demonstrate the BETi-triggered increase of p300 binding at/near the rescued genes. Chr, chromosome.
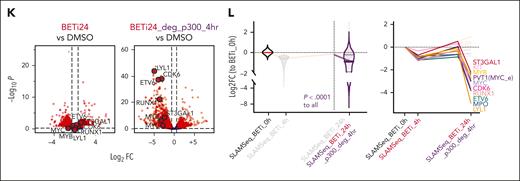
These data suggested that the transcriptional downregulation of certain essential AML genes might have been protected through other epigenetic processes acutely after the loss of BRD4, thereby rescuing critical programs. To formally demonstrate this, we performed thiol(SH)-linked alkylation for the metabolic sequencing of RNA (SLAM-Seq) at baseline (0 hour = dimethyl sulfoxide [DMSO] control) and compared it with SLAM-Seq after 4 and 24 hours of BETi treatment in SKNO1. In a set of 933 genes, transcription significantly decreased at 4 hours but recovered at 24 hours of BETi treatment, demonstrating that, after an initial impairment, these genes were indeed “rescued” at 24 hours after treatment (Figure 1E). Representative rescued genes again included ST3GAL1, RUNX1, CDK6, KIT, MYB, LYL1, ETV6, MPO, MYC, and PVT1 (Figure 1F; supplemental Figure 2D).
In addition to BRD4, we performed ChIP-Seq for central drivers and regulators of RUNX1-RUNX1T1–rearranged AML, including RUNX1, RUNX1T1(ETO), PU.1, FLI1, ERG, LMO2, p300, CDK9, and the histone mark H3K27ac, and we assessed chromatin accessibility dynamics via assay for transposase-accessible chromatin with sequencing (ATAC-Seq) (supplemental Figure 2A). We aligned these profiles with the regulatory regions of the 933 rescued genes in DMSO- vs BETi-treated KASUMI-1 cells after 24 hours of treatment. Contrary to the depletion of BRD4, p300- and RUNX1-binding increased markedly under BETi (Figure 1G). There was a moderate increase in FLI1, RUNX1T1, and ATAC-Seq signals, whereas H3K27ac and PU.1 levels remained unchanged (Figure 1G; supplemental Figure 2E). LMO2 and CDK9 exhibited a moderate decrease and ERG a significant decrease in binding near the rescued genes (supplemental Figure 2E). Of note, an increased p300 binding at the rescued genes, in which BRD4 was significantly reduced, was also present in SKNO1 (Figure 1H). Taken altogether, these results demonstrate an unanticipated transcriptional compensation of critical genes after BETi treatment, in which p300 appears to play a central role.
p300 compensates for the loss of BRD4 to rescue transcription after BET inhibition
To confirm whether p300 was preferentially redistributed at/around rescued genes, we integrated the dynamics of BRD4 binding with those of other TFs/regulators at a global scale. In both KASUMI-1 and SKNO1, p300 binding preferentially increased at sites corresponding to critical AML maintenance genes, such as CDK6, CCND2-3, ST3GAL1-2,4, RUNX1, ETV6, CD34, and PVT1, which also coincided with many of the exemplar rescued genes (Figure 2A-B,E; supplemental Figure 3C). To observe whether such a locus-specific accumulation of p300 after BETi treatment was reproducible in other AML subtypes, we performed ChIP-Seq for BRD4 and p300 (again at 24 hours after DMSO/BETi) in a completely independent BETi-sensitive AML cell line, OCI-AML3 (NPM1 mutated). Here, we also observed an increase of p300 at distinct loci, but these were fewer and, interestingly, exemplified by a different set of genes, including IRF8, LDB1, and BCL6 (Figure 2C; supplemental Figure 2D).
We next compared signal intensities across all 3 models for the top 5% of sites with increased p300 binding in each cell line. Upon BETi treatment, p300 signals that were in the top 5% in KASUMI-1 were also significantly increased in SKNO1 and vice versa (Figure 2D). In contrast, OCI-AML3 displayed a distinct pattern, characterized by generally lower p300 binding to chromatin and minimal overlap with the top 5% sites from KASUMI-1/SKNO1 (Figure 2D; supplemental Figure 2D). Comparing differential binding of the regulators presented above, either globally or solely at the top 5% of KASUMI-1 p300-increased sites, we observed significant enrichment for RUNX1, RUNX1T1, and FLI1 and a marginally higher intensity for H3K27ac (supplemental Figure 3A-B). All other parameters demonstrated either no change or a decrease in binding upon BETi treatment (supplemental Figure 3A or not shown). Reciprocal binding of BRD4 and p300 upon BETi treatment was further confirmed through quantitative ChIP-qPCR in KASUMI-1 and SKNO1 cells at the MYC promoter, 3 MYC enhancers, and the RUNX1 promoter (Figure 2F).
To functionally confirm the role of p300 in transcriptional compensation at rescued genes, we used a proteolysis targeting chimera (PROTAC)-based p300 degrader (p300_deg).38 Time-resolved western blots of p300 expression, along with matched qPCR for MYC, RUNX1a, and RUNX1b, confirmed a significant loss of p300 expression and its targets within 4 hours of p300_deg (Figure 2G; supplemental Figure 4A-D). This loss persisted at similar levels after 12 and 24 hours but was not accompanied by any phenotype change or increased apoptosis within this time frame (Figure 2G; supplemental Figure 4C-D). In line with the experiments leading to the discovery of the rescued genes, we treated SKNO1 and KASUMI-1 with BETi or DMSO for 24 hours, also adding either p300_deg or a mock control during the last 4 hours (Figure 2H). ChIP-qPCR at RUNX1 and 1 MYC enhancer showed that p300 binding was depleted upon p300_deg (Figure 2I). qPCR of the rescued genes MYC, RUNX1 (+RUNX1a and RUNX1b), ST3GAL1, and CDK6 showed a dramatic loss of expression upon p300_deg in both DMSO- and BETi-pretreated SKNO1 and KASUMI-1 cells (Figure 2J; supplemental Figure 4E). Finally, we performed SLAM-Seq at 24 hours in BETi-treated SKNO1 cells, with the addition of either a mock control or p300_deg for the last 4 hours. De novo transcription of rescued genes, which was blunted or increased in BETi-treated cells, decreased dramatically upon p300_deg (Figure 2K-L). Once again, this was most evident for ST3GAL1, KIT, MYB, PVT1, MYC, CDK6, RUNX1, ETV6 MPO, and LYL1 (Figure 2K-L). Altogether, our findings demonstrate that p300 is critically involved in the acute rescue of important maintenance genes of RUNX1-RUNX1T1–rearranged AML.
Sequential pharmacological BET inhibition followed by p300 inhibition suppresses the expression of rescued programs
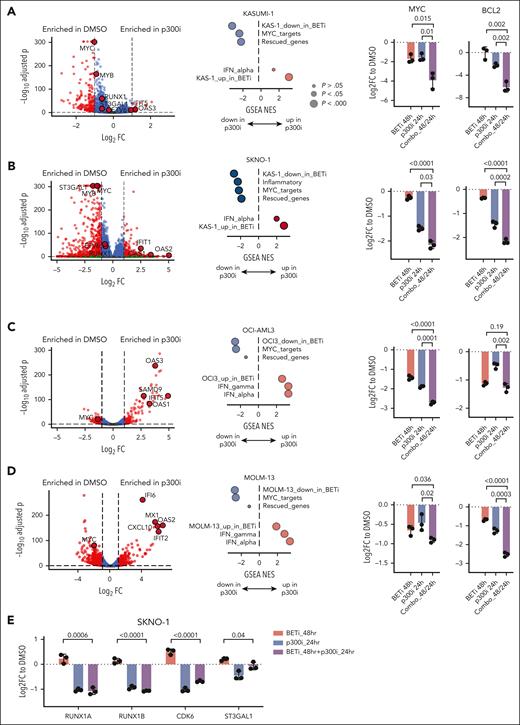
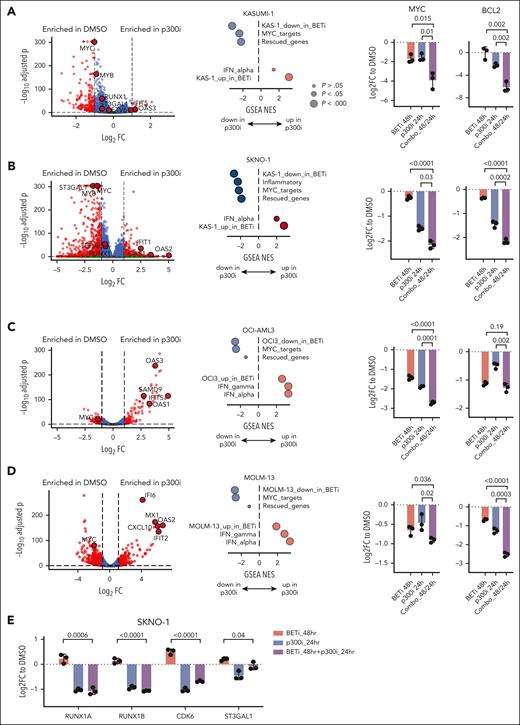
Given the overlap of critical AML maintenance genes with those rescued by p300 during acute adaptation to BETi, we hypothesized that these BETi-dependent transcripts are also regulated by p300. To test this, we performed RNA-Seq on KASUMI-1, SKNO1, and OCI-AML3 and MOLM-13 (a KMT2A-rearranged, BETi-sensitive cell line with transcriptional similarities to OCI-AML3) cells after 24 hours of treatment with DMSO or the p300/CREBBP acetyltransferase–selective inhibitor A-485 (p300i). Significant decreases in several p300-rescued genes, including RUNX1, ST3GAL1, ETV6, MYB, and MYC, were observed in KASUMI-1 and SKNO1 (Figure 3A-B), whereas MYC expression consistently decreased, and standard interferon-stimulated genes increased in OCI-AML3 and MOLM-13 (Figure 3C-D). Aiming to identify codependencies of p300i and BETi, we generated data sets of differentially upregulated/downregulated genes for each KASUMI-1, MOLM-13, and OCI-AML313 cells treated with DMSO/BETi and from p300-rescued genes identified in SKNO1 via SLAM-Seq and integrated these into the Molecular Signature Database (MSigDB) Hallmark collection (supplemental Table 3). Assessing gene set enrichment, we saw that all BETi-regulated gene sets were significantly enriched in their p300i-treated counterparts, with a decrease in MYC targets and an increase in interferon-stimulated genes observed across all models (Figure 3A-D). Importantly, rescued genes were enriched in SKNO-1 and KASUMI-1 but not in OCI-AML3 and MOLM-13, indicating AML subtype-specific p300-mediated compensation (Figure 3A-D).
Sequential pharmacological BET inhibition followed by p300 inhibition counteracts the expression of rescued programs. (A-D) Volcano plots (left) showing RNA-Seq expression changes in the indicated cell lines after 24 hours of treatment with DMSO or p300i. Dot plots (middle) of GSEA normalized enrichment scores (NESs) and false discovery rate q value significance of the top-scoring data sets after treatment with either DMSO or p300i for 24 hours in the indicated cell lines. Analysis of qPCR expression of MYC and BCL2 in the indicated AML cell lines (right) after treatment with either DMSO (48 hours of treatment), BETi (48 hours), p300i (24 hours), or sequential BETi and p300i (48 hours/24 hours). Shown are log2 FCs normalized to DMSO-treated controls and SD from 3 biological replicates. (E) Analysis of qPCR expression of the indicated transcripts/genes in SKNO1 cells after treatment with either DMSO (48 hours of treatment), BETi (48 hours), p300i (24 hours), or sequential BETi and p300i (48 hours/24 hours). Shown are log2 FCs normalized to DMSO-treated controls and SD from 3 biological replicates. GSEA, gene set enrichment analysis.
Sequential pharmacological BET inhibition followed by p300 inhibition counteracts the expression of rescued programs. (A-D) Volcano plots (left) showing RNA-Seq expression changes in the indicated cell lines after 24 hours of treatment with DMSO or p300i. Dot plots (middle) of GSEA normalized enrichment scores (NESs) and false discovery rate q value significance of the top-scoring data sets after treatment with either DMSO or p300i for 24 hours in the indicated cell lines. Analysis of qPCR expression of MYC and BCL2 in the indicated AML cell lines (right) after treatment with either DMSO (48 hours of treatment), BETi (48 hours), p300i (24 hours), or sequential BETi and p300i (48 hours/24 hours). Shown are log2 FCs normalized to DMSO-treated controls and SD from 3 biological replicates. (E) Analysis of qPCR expression of the indicated transcripts/genes in SKNO1 cells after treatment with either DMSO (48 hours of treatment), BETi (48 hours), p300i (24 hours), or sequential BETi and p300i (48 hours/24 hours). Shown are log2 FCs normalized to DMSO-treated controls and SD from 3 biological replicates. GSEA, gene set enrichment analysis.
Our results consistently highlighted MYC and its transcriptional program as key targets of both BETi and p300i across all data sets. We hypothesized that a redundant role for BET and p300 in the maintenance of critical AML genes might epigenetically define acute resistance and predict p300i sensitivity. We determined the effects of sequential BETi, followed by p300i, on the transcription of MYC and the MYC-dependent gene BCL2 across all 4 models. Single-agent treatment with BETi or p300i strongly downregulated both genes in all cell lines. Sequential treatment, however, resulted in even greater downregulation of MYC in all models and BCL2 in all but the OCI-AML3 model (Figure 3A-D). We also conducted a MYC reporter assay in the unrelated HCT116 cell line, in which combined treatment more effectively suppressed MYC activity than single-agent treatment (supplemental Figure 5A). Finally, we determined the effects of sequential BETi followed by p300i on the transcription of the rescued genes RUNX1_A, RUNX1_B, ETV6, and ST3GAL1 in SKNO-1 and KASUMI-1. Although BETi-triggered upregulation, single p300i and combined sequential treatment caused downregulation of these transcripts (Figure 3E; supplemental Figure 5B).
These results demonstrate the dependency of genes that can rescue the apoptotic phenotype after BETi upon p300i and also the putative clinical utility of sequential BET inhibition followed by p300 inhibition to impair rescue programs.
Sequential pharmacological BET inhibition followed by p300 inhibition synergistically suppresses AML proliferation
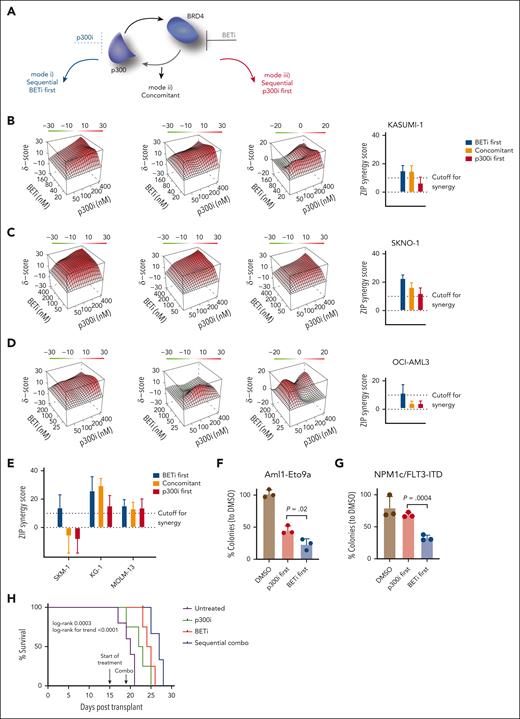
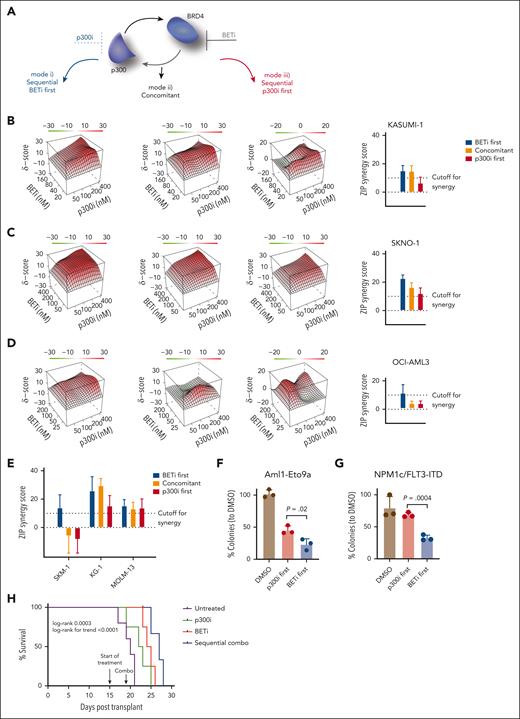
Our data suggested an immediate compensatory mechanism to maintain the transcription of critical genes via increased p300 dependency after BETi treatment (Figure 4A). To determine whether this response provided a therapeutic vulnerability, we treated KASUMI-1, SKNO1, and OCI-AML3 with the 2 inhibitors in 3 temporal sequences: mode 1, BETi sequentially followed by p300i; mode 2 both inhibitors concomitantly; and mode 3, p300i followed by BETi. Treatment was performed using BETi and p300i each at 4 doses plus DMSO controls (20 combinations). This strategy allowed for an unbiased analysis of treatment effects and the determination of synergistic activity, as quantified using the zero interaction potency (ZIP) algorithm.39 Importantly, BETi + p300i treatment was invariably synergistic only in mode 1 (BETi first; Figure 4B-D). KASUMI-1 and SKNO1 but not OCI-AML3 were synergistic in mode 2 (concomitant), whereas only SKNO1 cells remained synergistic in the p300i-first sequence (mode 3; Figure 4B-D).
Sequential pharmacological BET inhibition followed by p300 inhibition synergistically/optimally suppresses AML proliferation. (A) Schema of the approach adopted to inhibit the proposed feedback rescue loop to p300 after BETi. In total, 6 cells lines were treated, each in 3 biological replicates with the 2 inhibitors at each 4 doses and DMSO (20 combinations) in 3 temporal sequences: mode 1, BETi sequentially followed by p300i; mode 2, both inhibitors concomitantly; and mode 3, p300i sequentially followed by BETi. (B-D) Three-dimensional diffusion plots indicating maximal synergy scores (right) of combined treatment with BETi and p300i in the indicated orders and cell lines. Treatment efficiency was measured with CellTiterGlo at day 5 after the beginning of the first treatment. For the sequential treatment modes, the second compound was added 48 hours after the initial treatment commencement. Shown are averages and (for bar plots) SD from 3 biological/experimental replicates. ZIP scores >10 were considered synergistic, whereas ZIP scores less than –10 were antagonistic. (E) Plots of synergy scores of combined treatment with BETi and p300i in the indicated orders and cell lines. Treatment efficiency was measured with CellTiterGlo at day 5 after the beginning of the first treatment. For the sequential treatment modes, the second compound was added 48 hours after treatment began. Shown are averages and SD from 3 biological/experimental replicates. (F) Analysis of colony formation of Aml1-Eto9a–transformed murine AML cells after 2 rounds of plating and treatment with either DMSO in both plates, BETi followed by p300i, or vice versa. Shown are mean percentages normalized to DMSO and SD from 3 biological replicates. In each plating, treatment was performed for 7 days in methylcellulose. (G) Analysis of colony formation of Npm1c/Flt3-ITD murine AML cells after 2 rounds of plating and treatment with either DMSO in both plates, BETi followed by p300i, or vice versa. Shown are mean percentages normalized to DMSO and SD from 3 biological replicates. In each plating, treatment was performed for 7 days in methylcellulose. (H) Nod-scid gamma (NSG) mice that underwent tertiary transplant with Aml1-Eto9a were allocated to 4 treatment groups (untreated, n = 5; BETi treated, n = 4; p300i treated, n = 4; and sequentially combined treated, n = 4). Shown is the Kaplan-Meier plot of survival with log-rank P values (Mantel-Cox and trend). One mouse in the sequential combined treatment group was censored due to death to AML-unrelated reasons on day 23.
Sequential pharmacological BET inhibition followed by p300 inhibition synergistically/optimally suppresses AML proliferation. (A) Schema of the approach adopted to inhibit the proposed feedback rescue loop to p300 after BETi. In total, 6 cells lines were treated, each in 3 biological replicates with the 2 inhibitors at each 4 doses and DMSO (20 combinations) in 3 temporal sequences: mode 1, BETi sequentially followed by p300i; mode 2, both inhibitors concomitantly; and mode 3, p300i sequentially followed by BETi. (B-D) Three-dimensional diffusion plots indicating maximal synergy scores (right) of combined treatment with BETi and p300i in the indicated orders and cell lines. Treatment efficiency was measured with CellTiterGlo at day 5 after the beginning of the first treatment. For the sequential treatment modes, the second compound was added 48 hours after the initial treatment commencement. Shown are averages and (for bar plots) SD from 3 biological/experimental replicates. ZIP scores >10 were considered synergistic, whereas ZIP scores less than –10 were antagonistic. (E) Plots of synergy scores of combined treatment with BETi and p300i in the indicated orders and cell lines. Treatment efficiency was measured with CellTiterGlo at day 5 after the beginning of the first treatment. For the sequential treatment modes, the second compound was added 48 hours after treatment began. Shown are averages and SD from 3 biological/experimental replicates. (F) Analysis of colony formation of Aml1-Eto9a–transformed murine AML cells after 2 rounds of plating and treatment with either DMSO in both plates, BETi followed by p300i, or vice versa. Shown are mean percentages normalized to DMSO and SD from 3 biological replicates. In each plating, treatment was performed for 7 days in methylcellulose. (G) Analysis of colony formation of Npm1c/Flt3-ITD murine AML cells after 2 rounds of plating and treatment with either DMSO in both plates, BETi followed by p300i, or vice versa. Shown are mean percentages normalized to DMSO and SD from 3 biological replicates. In each plating, treatment was performed for 7 days in methylcellulose. (H) Nod-scid gamma (NSG) mice that underwent tertiary transplant with Aml1-Eto9a were allocated to 4 treatment groups (untreated, n = 5; BETi treated, n = 4; p300i treated, n = 4; and sequentially combined treated, n = 4). Shown is the Kaplan-Meier plot of survival with log-rank P values (Mantel-Cox and trend). One mouse in the sequential combined treatment group was censored due to death to AML-unrelated reasons on day 23.
To assess the effects of BETi + p300i across other AML genotypes, we extended the analysis to more BETi-sensitive cells, SKM1, MOLM-13, and KG-1. Again, synergistic inhibition of proliferation was present in all cell lines in mode 1 (the BETi-first, p300i-second treatment sequence; Figure 4E; supplemental Figure 6A). Inhibition became less synergistic using concomitant treatment in SKM1, whereas only KG-1 and MOLM-13 demonstrated synergism when p300i was used ahead of BETi (Figure 4E; supplemental Figure 6A). We also assessed for synergism in our models of Aml1-Eto9a and Npm1flox-cA/+;Flt3ITD/+;Mx1-Cre+(Npm1c/Flt3-ITD)4,40 murine AML, analyzing clonogenic capacity. Cells were plated in methylcellulose after BETi treatment followed by p300i or vice versa. Although both temporal sequences demonstrated reduced colony numbers vs DMSO, BETi followed by p300i was significantly more effective than the reverse sequence (Figure 4F-G). Finally, we performed an in vivo study using our Aml1-Eto9a system. Mice that underwent tertiary transplant were treated in 4 arms: vehicle compound, single BETi, single p300i, and a sequential combo with BETi and p300i. Mice receiving the sequential combination showed extended survival compared with those in other treatment groups (Figure 4H), without an increase in toxicity to normal hematopoiesis (supplemental Figure 6B-E). In summary, these results demonstrate increased therapeutic efficacy when BETi and p300i are combined. Consistent with our proposed p300-mediated mechanism for the acute adaptation of BETi-treated cells, sequential treatment starting with BETi is the most efficient.
p300i is invariably therapeutically effective during the early stages of resistance to BET inhibition
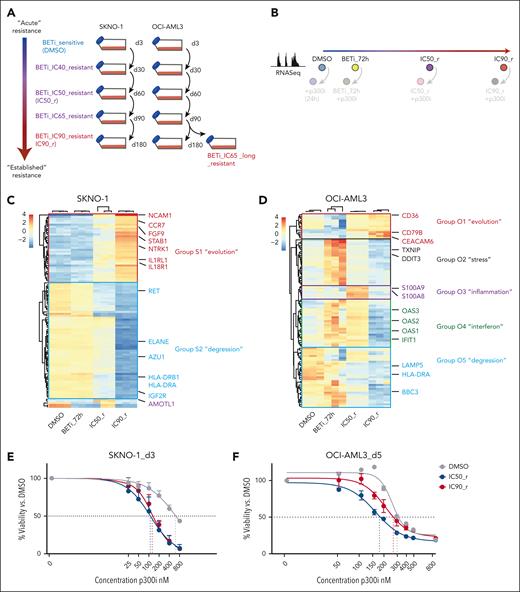
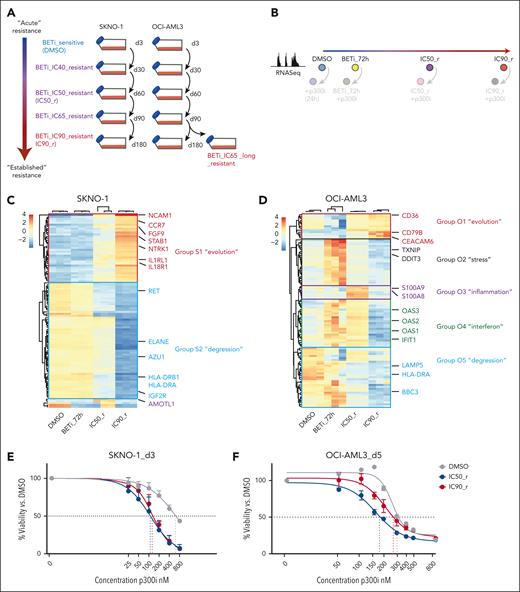
Disease relapse in AML usually occurs after months/years, and whether the mechanisms underlying acute resistance persist at later time points is unknown. We simulated the evolution of resistance acquisition to BETi in the 2 AML models that we had extensively tested so far: SKNO1 (RUNX1-RUNX1T1 rearranged) and OCI-AML3 (NPM1mut). We treated SKNO1 and OCI-AML3 cells with DMSO or increasing doses of BETi at IC20 (SKNO1 only), IC40, IC50, IC65, IC80 (SKNO1 only), and IC90 concentrations to generate cell lines along an evolutionary continuum from early to established resistance (Figure 5A; supplemental Figure 7A-B).
p300i is invariably effective during early stages of resistance to BET inhibition. (A) Graphical schema of the experimental approach to induce and store cells at all stages of resistance to BETi in SKNO1 and OCI-AML3 cells. (B) Experimental approach to the assessment of transcriptional changes via RNA-Seq during the longitudinal scale of establishment of resistance to BETi. To avoid putative sequencing-related batch effects, these experiments were directly performed in conjunction with matched p300i-treated (24 hours) samples (shown with lower opacity). All RNA-Seq experiments were performed on 3 biological replicates that were raised from individual wells (altogether 24 RNA-Seq samples per model). (C-D) Variance by nonsupervized hierarchical clustering of the 100 most variable genes in DMSO, BETi_72h, IC50_r, and IC90_r isogenic SKNO1 (C) and OCI-AML3 (D) cells. (E-F) Assessment of cell proliferation of the indicated isogenic SKNO1 (E) and OCI-AML3 (F) cell lines after 72 hours (for SKNO1) and 120 hours (for OCI-AML3) of p300i treatment. Shown are mean percentages normalized to DMSO-treated controls and SD from 3 biological replicates.
p300i is invariably effective during early stages of resistance to BET inhibition. (A) Graphical schema of the experimental approach to induce and store cells at all stages of resistance to BETi in SKNO1 and OCI-AML3 cells. (B) Experimental approach to the assessment of transcriptional changes via RNA-Seq during the longitudinal scale of establishment of resistance to BETi. To avoid putative sequencing-related batch effects, these experiments were directly performed in conjunction with matched p300i-treated (24 hours) samples (shown with lower opacity). All RNA-Seq experiments were performed on 3 biological replicates that were raised from individual wells (altogether 24 RNA-Seq samples per model). (C-D) Variance by nonsupervized hierarchical clustering of the 100 most variable genes in DMSO, BETi_72h, IC50_r, and IC90_r isogenic SKNO1 (C) and OCI-AML3 (D) cells. (E-F) Assessment of cell proliferation of the indicated isogenic SKNO1 (E) and OCI-AML3 (F) cell lines after 72 hours (for SKNO1) and 120 hours (for OCI-AML3) of p300i treatment. Shown are mean percentages normalized to DMSO-treated controls and SD from 3 biological replicates.
We next assessed transcriptional changes during the evolution of resistance by performing RNA-Seq at 4 longitudinal time points: DMSO treated, short-term BETi treated (BETi_72h), incipient resistance (IC50_r), and full-blown resistance to BETi (IC90_r; Figure 5B). Nonsupervized clustering of the most variable genes revealed 2 distinct transcriptional patterns in SKNO1, which we termed the “degression” module (Group_S2) for genes decreasing in expression and the “evolution” module (Group_S1) for those increasing (Figure 5C). The evolution module was enriched for signaling ligands and receptors such as NCAM1, CCR7, FGF9, and IL1RL1 (Figure 5C; supplemental Figure 8C). In contrast, OCI-AML3 displayed a more complex and certainly nonlinear transcriptional evolution of resistance, with 5 distinct modules. Besides a small “evolution” signature (Group_O1) and a larger “degression” group (Group_O5), some genes only increased transiently at lower IC doses of BETi (“stress” genes, Group_O2; Figure 5D). Of importance, a small number of “inflammation”-associated genes (Group_O3) were transiently expressed only in incipiently resistant IC50_r cells and consisted of potential resistance modulators such as S100A9/S100A841-43 (Figure 5D; supplemental Figure 8E). Finally, we identified an “interferon” group (O4), whose expression increased immediately after BETi treatment and in IC50_r but decreased in IC90_r cells (Figure 5D; supplemental Figure 8G).
We next treated cells from all stages of BETi resistance with p300i and measured their proliferation. In SKNO1, BETi resistance severely sensitized cells to p300i throughout all stages (Figure 5E; supplemental Figure 7C-D). Sensitivity to p300i was highest in IC50_r cells and remained high during later stages of established resistance, including in IC90_r cells (Figure 5E; supplemental Figure 7C-D). In OCI-AML3, p300i abrogated proliferation at lower IC50 values during all steps of resistance to BETi (Figure 5F; supplemental Figure 7E-F). However, compared with stages of established resistance (IC65_long_r and IC90_r), cells at early resistant stages required significantly less p300i to achieve the same inhibitory effects (Figure 5F; supplemental Figure 7E-F).
Altogether, these results indicate complex cell type/genotype-dependent transcriptional resistance mechanisms but also uncover a broad, early genotype–independent window to enhance BETi responses with p300i.
p300 regulates multiple downstream mediators of BETi resistance
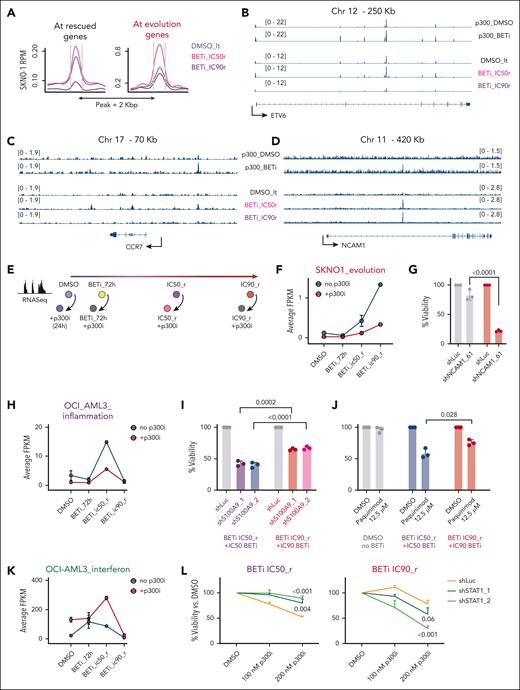
To assess p300 chromatin-binding dynamics during later stages of resistance to BETi, we performed ChIP-Seq for p300 in DMSO-treated, BETi_IC50_r, and BETi_IC90_r SKNO1. At rescued genes, p300 binding was significantly increased in IC50_r but nearly absent in IC90_r cells, indicating a possible shift toward other epigenetic regulators or diminishing rescue gene relevance with full resistance (Figure 6A-B). Similarly, at the Group_S1 genes, associated with resistance evolution, p300 binding was significantly increased in IC50_r cells but returned to levels similar to those in DMSO in IC90_r cells, a finding that appeared counterintuitive given the continued sensitivity of both IC50_r and IC90_r cells to p300i (Figure 6A,C-D). However, p300 binding increased significantly at precisely 3 sites in IC90_r cells compared with DMSO. The most notable/significant site was the promoter region of NCAM1, in which p300 was also enriched in IC50_r (Figure 6D). Moreover, when comparing the initial 24-hour time point between DMSO- and BETi-treated cells, p300 had already begun to bind at the same regulatory region of NCAM1 acutely after BETi treatment.
p300 regulates multiple downstream mediators of BETi resistance. (A) Average binding curve profiles for p300 in the indicated isogenic SKNO1 with different degrees of BETi resistance, centered at/around regulatory regions of the rescued (left) and evolution (right) genes. (B-D) Examples of binding kinetics of p300 at ETV6 (a rescued gene) (B), CCR7 (an evolution gene) (C), and NCAM1 (an evolution gene) (D) in BETi-sensitive and BETi-resistant settings. (E) Continued from Figure 5B, experimental approach to the assessment of transcriptional changes during the longitudinal scale of establishment of resistance to BETi and sensitivity toward p300i. (F) Longitudinal analysis of expression of SKNO1 evolution genes that code for ligands and signaling receptors, during all stages of resistance to BETi, with or without addition of p300i for 24 hours. Individual genes within the group were chosen based on their structural assignment per gene ontology analysis. Shown are average FPKM values from 3 biological replicates and SD. (G) Assessment of cellular viability after NCAM1 knockdown in the indicated SKNO1 isogenic cells for 120 hours. Shown are percentages normalized to Luc controls and SD from 3 biological replicates. (H) Longitudinal analysis of expression of all OCI-AML3-related “inflammation” genes, during all stages of resistance to BETi, with or without addition of p300i for 24 hours. Shown are average FPKM values from 3 biological replicates and SD. (I) Assessment of cellular viability after S100A9 knockdown in the indicated isogenic cells for 120 hours. Shown are the percentages normalized to Luc controls and SD from 3 biological replicates. (J) Analysis of cellular viability after treatment with either DMSO or paquinimod in the indicated OCI-AML3 isogenic cells for 72 hours. Shown are percentages normalized to DMSO-treated controls and SD from 3 biological replicates. (K) Longitudinal analysis of expression of all OCI-AML3–related “interferon” genes, during all stages of resistance to BETi, with or without addition of p300i for 24 hours. Shown are average FPKM values from 3 biological replicates and SD. (L) Analysis of cellular viability after STAT1 knockdown and DMSO or p300i treatment for 120 hours in the indicated isogenic cell lines. Shown are percentages normalized to DMSO and SD from 3 biological replicates. Chr, chromosome; ETV6, ETS variant transcription factor 6; FPKM, fragments per kilobase per million mapped fragments; RPM, reads per million.
p300 regulates multiple downstream mediators of BETi resistance. (A) Average binding curve profiles for p300 in the indicated isogenic SKNO1 with different degrees of BETi resistance, centered at/around regulatory regions of the rescued (left) and evolution (right) genes. (B-D) Examples of binding kinetics of p300 at ETV6 (a rescued gene) (B), CCR7 (an evolution gene) (C), and NCAM1 (an evolution gene) (D) in BETi-sensitive and BETi-resistant settings. (E) Continued from Figure 5B, experimental approach to the assessment of transcriptional changes during the longitudinal scale of establishment of resistance to BETi and sensitivity toward p300i. (F) Longitudinal analysis of expression of SKNO1 evolution genes that code for ligands and signaling receptors, during all stages of resistance to BETi, with or without addition of p300i for 24 hours. Individual genes within the group were chosen based on their structural assignment per gene ontology analysis. Shown are average FPKM values from 3 biological replicates and SD. (G) Assessment of cellular viability after NCAM1 knockdown in the indicated SKNO1 isogenic cells for 120 hours. Shown are percentages normalized to Luc controls and SD from 3 biological replicates. (H) Longitudinal analysis of expression of all OCI-AML3-related “inflammation” genes, during all stages of resistance to BETi, with or without addition of p300i for 24 hours. Shown are average FPKM values from 3 biological replicates and SD. (I) Assessment of cellular viability after S100A9 knockdown in the indicated isogenic cells for 120 hours. Shown are the percentages normalized to Luc controls and SD from 3 biological replicates. (J) Analysis of cellular viability after treatment with either DMSO or paquinimod in the indicated OCI-AML3 isogenic cells for 72 hours. Shown are percentages normalized to DMSO-treated controls and SD from 3 biological replicates. (K) Longitudinal analysis of expression of all OCI-AML3–related “interferon” genes, during all stages of resistance to BETi, with or without addition of p300i for 24 hours. Shown are average FPKM values from 3 biological replicates and SD. (L) Analysis of cellular viability after STAT1 knockdown and DMSO or p300i treatment for 120 hours in the indicated isogenic cell lines. Shown are percentages normalized to DMSO and SD from 3 biological replicates. Chr, chromosome; ETV6, ETS variant transcription factor 6; FPKM, fragments per kilobase per million mapped fragments; RPM, reads per million.
We also assessed gene expression alterations after p300 inhibition at key stages of adaptation to BETi (DMSO, BETi_72h, IC50_r, and IC90_r; Figure 6E). In SKNO1, p300i severely repressed many “evolution” genes in both IC50_r and IC90_r cells (Figure 6F; supplemental Figure 8A,C). The top-scoring “evolution” gene and the one that was also significantly rerepressed by p300i was NCAM1 (Figures 5C and 6D,F). We previously demonstrated that NCAM1 leads to resistance in diverse types of AML.44 Furthermore, NCAM1 associates with higher relapse rates in RUNX1-RUNX1T1–rearranged AML.45,46 To demonstrate a direct role for NCAM1 in the development of resistance to BETi in SKNO1, we performed RNA interference (RNAi)-mediated knockdown in DMSO-treated vs IC90_r cells. NCAM1 knockdown severely abrogated cell growth of IC90_r cells, while barely repressing proliferation of DMSO cells (Figure 6G; supplemental Figure 8D).
In OCI-AML3, p300i comparatively repressed the expression levels of “inflammation” genes in IC50_r cells, “evolution” genes in IC90_r cells, “stress” genes in short-term BETi-treated cells, and those of “degression” genes in general (Figure 6H; supplemental Figure 8B,E). Conversely, p300i massively boosted “interferon” genes in IC50_r cells only (Figure 6K; supplemental Figure 8G). Given that IC50_r cells were most sensitive to p300i, we tested whether resistance mechanisms were related to the upregulation of S100A9, a gene upregulated within the “inflammation” group (supplemental Figure 8E). We either treated cells with the S100A9 inhibitor paquinimod or created cell lines with inducible RNAi-mediated S100A9 knockdown. In both settings, this inhibition was significantly higher in IC50_r than IC90_r/DMSO cells (Figure 6I-J; supplemental Figure 8F). To test the requirement for the upregulated interferon signature, we induced RNAi-mediated knockdown of the interferon-effector STAT1 in IC50_r and IC90_r cells before treating them with p300i. Remarkably, p300i failed to inhibit proliferation in STAT1-depleted IC50_r cells compared with DMSO-treated controls. Conversely, in STAT1-depleted IC90_r cells, p300i significantly suppressed proliferation (Figure 6L; supplemental Figure 8H). Taken together, our data demonstrate the temporal and genotypic complexity of p300-induced adaptation after BETi treatment, which evolves continuously and uses separate and often transient emergency programs to maintain AML fitness.
p300 mediates early patterns of resistance to BETi in primary AML samples from a phase 1/2 clinical trial of molibresib
In line with results from human cell lines and murine models, we confirmed ex vivo in 1 RUNX1-RUNX1T1–rearranged and 4 NPM1-mutated patient samples that sequential BETi followed by p300i treatment significantly inhibited proliferation to a degree comparable with the concomitant treatment mode (Figure 7A-B).
p300 mediates early patterns of resistance to BETi in primary AML samples from a phase 1/2 clinical trial of molibresib. (A) Individual plots showing the treatment efficiency of concomitant or sequential treatment with BETi and p300i in 5 primary AML patient samples. Treatment efficacy was measured with CellTiterGlo at day 4 after the commencement of the first treatment. Shown are results from 2 biological replicates for each primary sample. For the sequential treatment mode with BETi first, p300i was added 48 hours after treatment commencement. (B) Violin plots showing treatment efficacy of concomitant or sequential treatment with BETi and p300i in 5 primary samples from patients with AML. Shown are results from 2 biological replicates for each primary sample. For the sequential treatment mode with BETi first, p300i was added 48 hours after treatment commencement. (C) Dot plots of average log2 fold expression changes of the indicated gene sets in 13 patients before and early after dose with molibresib in a phase 1/2 clinical trial. Negative values indicate a decrease in expression in the postdose samples. (D) Violin plots of the average log2 fold expression changes of the indicated genes in 13 patients before and early after dose with molibresib in a phase 1/2 clinical trial. Negative values indicate a decrease in expression in the postdose samples. (E) Viability after treatment with p300i (either 200 nM [upper] or 1000 nM [lower]) or DMSO in primary samples from the molibresib trial at predose and 5 days (for 4 samples) or 10 days (only for patient Moli_BETi_006, for whom samples were obtained at both days 5 and 10) postdose. Shown is the percent viability (measured via CellTiterGlo) to DMSO-treated cells. Due to the limited cell numbers of this clinical trial sample, only 1 “biological” replicate could be obtained. (F-G) Individual examples of viability after treatment with p300i (200 or 1000 nM) or DMSO in the primary samples Moli_BETi_006 (F) or Moli_BETi_12 (G) from the molibresib trial at predose and 5 days (for both patients) or 10 days (only for patient Moli_BETi_006). Shown is the percentage viability (measured via CellTiterGlo) to DMSO-treated cells. (H) Changes in expression of MYC in the same exemplar patient samples Moli_BETi_006 and Moli_BETi_12 at 24 hours of treatment with 200 or 1000 nM of p300i. Shown are log2 FCs to DMSO-treated cells. d5, day 5.
p300 mediates early patterns of resistance to BETi in primary AML samples from a phase 1/2 clinical trial of molibresib. (A) Individual plots showing the treatment efficiency of concomitant or sequential treatment with BETi and p300i in 5 primary AML patient samples. Treatment efficacy was measured with CellTiterGlo at day 4 after the commencement of the first treatment. Shown are results from 2 biological replicates for each primary sample. For the sequential treatment mode with BETi first, p300i was added 48 hours after treatment commencement. (B) Violin plots showing treatment efficacy of concomitant or sequential treatment with BETi and p300i in 5 primary samples from patients with AML. Shown are results from 2 biological replicates for each primary sample. For the sequential treatment mode with BETi first, p300i was added 48 hours after treatment commencement. (C) Dot plots of average log2 fold expression changes of the indicated gene sets in 13 patients before and early after dose with molibresib in a phase 1/2 clinical trial. Negative values indicate a decrease in expression in the postdose samples. (D) Violin plots of the average log2 fold expression changes of the indicated genes in 13 patients before and early after dose with molibresib in a phase 1/2 clinical trial. Negative values indicate a decrease in expression in the postdose samples. (E) Viability after treatment with p300i (either 200 nM [upper] or 1000 nM [lower]) or DMSO in primary samples from the molibresib trial at predose and 5 days (for 4 samples) or 10 days (only for patient Moli_BETi_006, for whom samples were obtained at both days 5 and 10) postdose. Shown is the percent viability (measured via CellTiterGlo) to DMSO-treated cells. Due to the limited cell numbers of this clinical trial sample, only 1 “biological” replicate could be obtained. (F-G) Individual examples of viability after treatment with p300i (200 or 1000 nM) or DMSO in the primary samples Moli_BETi_006 (F) or Moli_BETi_12 (G) from the molibresib trial at predose and 5 days (for both patients) or 10 days (only for patient Moli_BETi_006). Shown is the percentage viability (measured via CellTiterGlo) to DMSO-treated cells. (H) Changes in expression of MYC in the same exemplar patient samples Moli_BETi_006 and Moli_BETi_12 at 24 hours of treatment with 200 or 1000 nM of p300i. Shown are log2 FCs to DMSO-treated cells. d5, day 5.
Additionally, we investigated whether our findings correlated with data from a phase 1/2 trial testing the BETi molibresib as monotherapy in hematologic malignancies, which failed to induce significant clinical responses in AML.18 Paired RNA-Seq data at baseline and early after dose were available for 13 patient samples (supplemental Table 4). Despite the disparate AML genotypes and their lack of overlap with RUNX1-RUNX1T1–rearranged AML, we examined the transcriptional dynamics of our rescued genes (identified from KASUMI-1/SKNO1) after molibresib dosing. The rescued genes were then compared with the dynamics of other gene sets within the same patients; a “redundant” gene group consisting of transcripts that consequently decreased upon loss of BRD4 in SKNO1 SLAM-Seq; and the groups that were significantly downregulated by BETi in KASUMI-1, OCI-AML3, and MOLM-13, as introduced in Figure 3. Remarkably, the decrease of rescued genes appeared blunted in all clinical samples, whereas all other gene sets showed significantly deeper downregulation after molibresib (Figure 7C). As examples, relative preservation of expression was observed for our exemplar genes ST3GAL1, RUNX1, CDK6, ETV6, MYB, PVT1, KIT, LYL1, and MYC, as well as for the OCI-AML3–related putative rescued genes IRF8, BCL6, and LDB1 (Figure 7D).
Finally, 4 patient samples taken from the molibresib trial at day 0 (predose) and matched with day 5 (postdose) samples were subjected to p300i treatment. In 1 case, a sample was also available at day 10 after dose. Compared with the predosed samples, postdose samples were significantly more sensitive to p300i, correlating with a more profound decrease in MYC expression (Figure 7E-H; supplemental Figure 9A-C). Thus, studies in patients treated in vivo and in clinical samples taken from patients exposed to molibresib corroborate our findings of p300 rescue and the efficacy of sequential BET and p300 inhibition.
Discussion
After a transient response, the majority of patients with AML die from disease relapse.2,47-50 The emergence of novel clones and the expansion of clones with new mutations, distinct from those at diagnosis, complicate treatment by altering the genetic and epigenetic landscape.
These observations suggest that an understanding of resistance mechanisms is a major unanswered challenge in leukemia research. Because resistance mechanisms are likely pleotropic and drug and genotype dependent, the importance of this question is amplified by the growing number of promising novel agents.51,52
By definition, resistance must initiate under the selective pressure of induction therapy,53 and it remains unclear whether acute mechanisms that underpin initial persistence are the same as those that prevail in bulk disease upon rechallenge at relapse. This distinction may have clinical implications: response/survival are far higher for treatment at diagnosis than in relapse; and many physicians feel that for some AML there is only “one shot” at effecting cure. A greater knowledge of acute mechanisms of resistance could, therefore, allow for the rational development of combinations to prevent relapse.54 We have addressed these questions, using the evolution of BETi resistance in sensitive systems.
Our primary objective was to anticipate chronic resistance to BETi by analyzing early adaptation pathways leading to cellular persistence. We identified that p300 rapidly compensates for the loss of transcription at key AML genes, explaining, at least in part, acute persistence. Although our experiments focused on p300 to emphasize the translational consequences and to simplify the narrative, we also observed that RUNX1, RUNX1-RUNX1T1, and FLI1, known critical TFs in KASUMI-1 cells,27,29,30,32,34,55 were enriched at the top rescued sites, in conjunction with p300. These results reconcile with a demonstrated signaling cascade composed of TFs, p300/CREBBP, and BRD4 to support leukemia maintenance, in which TFs and p300/CREBBP recruit/instruct BRD4 to facilitate transcription.36
p300 activity is redundant with CREBBP at some loci, and their lysine acetyltransferase domains share an almost identical homology.56,57,58 Therefore, CREBBP may perform a similar function in resistance to BETi. In our study, this distinction is somewhat academic because deg_p300 targets both p300 and CREBBP, p300i inhibits the enzymatic function of both p300 and CREBBP, and our proposed therapeutic intervention also targets CREBBP-mediated adaptation.56 Nonetheless, we used the term “p300” solely to ease the narrative, because we do not have evidence whether p300 and CREBBP have common or independent functions as a response to BETi.
In our BETi-resistance experimental framework, synthetic dependency on p300i varied between models. SKNO1 cells maintained maximum dependency from inhibitory concentration (IC)50 to IC90 resistance levels, despite reduced chromatin activity of p300 in IC90-resistant cells. In OCI-AML3, sensitivity to p300i was highest in the early resistance stages and gradually declined as full-blown resistance developed. While exploring the mechanisms behind this dynamic resistance and its response to p300i, we noted significant differences in transcriptional responses among AML subtypes. We confirmed the role of NCAM1 in resistance, particularly in RUNX1-RUNX1T1–rearranged AML and identified interferon and inflammatory responses as critical for early resistance in NPM1mut cells, thereby deepening our understanding of transcriptional plasticity in BETi resistance.14,16,22,44,59,60 Although highly intriguing, several questions remain. Are the inflammatory/interferon signals cell intrinsic or do they involve autocrine/paracrine communication effective even in reductionist suspension-based systems? Additionally, it is unclear why certain transcriptional programs are crucial only during early resistance; are they too energy intensive to sustain or do they depend on residual BRD4 activity that diminishes over time?
Altogether, we demonstrate that acute resistance to BETi involves mechanistic feedback to p300, preserving critical leukemia programs. This acute resistance can evolve into fully established resistance in which p300 continues to regulate temporal- and genotype-specific programs to maintain leukemic fitness. Additionally, our work establishes a framework for sequential treatment with BETi followed by p300i, a strategy that enhances early synthetic lethality and presents a rational combination designed to prevent relapse.
Acknowledgments
The authors thank Matthias Klein from the sequencing core facility of the University Medical Center Mainz for the valuable support.
This work was supported by a grant from the Else-Kröner-Fresenius Foundation (2020_EKEA.35), a grant from the German Research Foundation (DFG 510093527), and a sponsorship of the Research Society for Hematology Mainz (WVHF_04_2022 [D.S.]); and grants from Cancer Research UK (CRUK; C18680/A25508), Kay Kendall Leukaemia Fund (KKL1243), the European Research Council (647685), Medical Research Council (MR-R009708-1), and Blood Cancer UK and the Wellcome Trust (205254/Z/16/Z [B.J.P.H.]). H.Y. is funded by a grant from the German Research Foundation (DFG YU 406/1-1) and supported by the Robert Bosch Stiftung. P.G. is funded by a CRUK Advanced Clinician Scientist Fellowship (C57799/A27964) and was previously funded by a Wellcome Trust fellowship (109967/Z/15/Z) and American Society of Hematology global award. Work in the Huntly laboratory is supported by the National Institute for Health and Care Research Cambridge Biomedical Research Centre (BRC-1215-20014), and was funded, in part, by the Wellcome Trust, which supported the Cambridge Stem Cell Institute (203151/Z/16/Z) and Cambridge Institute for Medical Research (100140/Z/12/Z).
Authorship
Contribution: V.S., G.G., H.O., B.J.P.H., and D.S. conceived and designed the experiments; V.S., G.G., H.O., M.M., A.G.-C., M.A.B., M.S.-P., B.S., H.Y., S.J.H., S.A.-S., P.S.H., D.L., F.B., and D.S. performed experiments and formal analysis; E.M., A.G.-C., and D.S. performed the bioinformatics analysis; A.T., I.E., O.B., A.D., M.W.M.K., B.G., M.T., T.K., P.G., P.Y., M.A.D., and R.K.P. provided critical resources; B.J.P.H. and D.S. wrote the manuscript draft; and all authors reviewed and edited the final manuscript.
The current affiliation for D.L. is Pharmaron, Hoddesdon, United Kingdom.
The current affiliation for R.K.P. is Science@RabP Ltd, Bishop's Stortford, United Kingdom.
Conflict-of-interest disclosure: A.T., I.E., O.B., and A.D. are employees of and hold shares in GlaxoSmithKline (GSK). D.L. is a former employee of GSK. M.W.M.K. reports personal honoraria from AbbVie, Bristol Myers Squibb (BMS), Gilead, Johnson & Johnson, Jazz, Pfizer, and Servier and research support from Kura and Syndax outside of the submitted work. P.G. reports honoraria from Astellas and employment of spouse with GSK outside the submitted work. P.Y. reports honoraria from Astellas and Novartis outside of the submitted work. R.K.P. is a former employee of and holds shares in GSK. B.J.P.H. reports advisory board membership for Novartis, Pfizer, and Janpix; consultancy work for Istesso, Menerini, and Amphista; personal honoraria from Novartis and Pfizer; and research funding from AstraZeneca outside of the submitted work. D.S. reports personal honoraria from AbbVie, Astellas, AstraZeneca, Gilead, and BMS and employment of spouse with BioNTech outside the submitted work. The remaining authors declare no competing financial interests.
Correspondence: Daniel Sasca, Department of Hematology and Oncology, University Medical Center of the Johannes Gutenberg University Mainz, Langenbeckstr. 1, Mainz 55131, Germany; email: dansasca@uni-mainz.de; and Brian J. P. Huntly, Jeffrey Cheah Biomedical Centre, Cambridge Biomedical Campus, Cambridge CB2 0AW, United Kingdom; email: bjph2@cam.ac.uk.
References
Author notes
V.S., G.G., and H.O. are joint first authors.
B.J.P.H. and D.S. are joint senior authors.
RNA-sequencing (RNA-Seq), chromatin immunoprecipitation with sequencing (ChIP-Seq), assay for transposase-accessible chromatin using sequencing (ATAC-Seq), thiol(SH)-linked alkylation for the metabolic sequencing of RNA (SLAM-Seq), and nuclear RNA-Seq data have been deposited in the Gene Expression Omnibus database (accession number GSE167163).
Anonymized patient data from the NCT01943851 trial were made available by GlaxoSmithKline on www.clinicalstudydatarequest.com for research proposals approved by an independent review committee. A data sharing agreement will be required.
The online version of this article contains a data supplement.
There is a Blood Commentary on this article in this issue.
The publication costs of this article were defrayed in part by page charge payment. Therefore, and solely to indicate this fact, this article is hereby marked “advertisement” in accordance with 18 USC section 1734.

![p300 mediates early patterns of resistance to BETi in primary AML samples from a phase 1/2 clinical trial of molibresib. (A) Individual plots showing the treatment efficiency of concomitant or sequential treatment with BETi and p300i in 5 primary AML patient samples. Treatment efficacy was measured with CellTiterGlo at day 4 after the commencement of the first treatment. Shown are results from 2 biological replicates for each primary sample. For the sequential treatment mode with BETi first, p300i was added 48 hours after treatment commencement. (B) Violin plots showing treatment efficacy of concomitant or sequential treatment with BETi and p300i in 5 primary samples from patients with AML. Shown are results from 2 biological replicates for each primary sample. For the sequential treatment mode with BETi first, p300i was added 48 hours after treatment commencement. (C) Dot plots of average log2 fold expression changes of the indicated gene sets in 13 patients before and early after dose with molibresib in a phase 1/2 clinical trial. Negative values indicate a decrease in expression in the postdose samples. (D) Violin plots of the average log2 fold expression changes of the indicated genes in 13 patients before and early after dose with molibresib in a phase 1/2 clinical trial. Negative values indicate a decrease in expression in the postdose samples. (E) Viability after treatment with p300i (either 200 nM [upper] or 1000 nM [lower]) or DMSO in primary samples from the molibresib trial at predose and 5 days (for 4 samples) or 10 days (only for patient Moli_BETi_006, for whom samples were obtained at both days 5 and 10) postdose. Shown is the percent viability (measured via CellTiterGlo) to DMSO-treated cells. Due to the limited cell numbers of this clinical trial sample, only 1 “biological” replicate could be obtained. (F-G) Individual examples of viability after treatment with p300i (200 or 1000 nM) or DMSO in the primary samples Moli_BETi_006 (F) or Moli_BETi_12 (G) from the molibresib trial at predose and 5 days (for both patients) or 10 days (only for patient Moli_BETi_006). Shown is the percentage viability (measured via CellTiterGlo) to DMSO-treated cells. (H) Changes in expression of MYC in the same exemplar patient samples Moli_BETi_006 and Moli_BETi_12 at 24 hours of treatment with 200 or 1000 nM of p300i. Shown are log2 FCs to DMSO-treated cells. d5, day 5.](https://ash.silverchair-cdn.com/ash/content_public/journal/blood/145/7/10.1182_blood.2022019306/6/m_blood_bld-2022-019306r1-gr7.jpeg?Expires=1766594134&Signature=BKIGY20VTXgXwOq0B9LmgeTvWeN7lrJ4QUJTFsjosCUsToo9kt9Jw0lKkMhxvGa0xfRNK3eOU54s8OQtgF721Bnoj1D19x3sGFO6V0914WTLvoO-kzBHJ7LdLjBROnB3kU17mEhJhUriP8RwKC2tBCRRSL9JYRrtyFg2yU997vXCgmZLR0jnqtc4C0mO4Fj22W7XE0RV05ySxMSXwuGiBp31eEJzSoMMzERw2o-lsoJxv5riNmu3z02VmU9O~C5dQpFiTog2~G9I7RV6qREKbLDxuEm9MwJJyE~swzdM8z-Cw3u7qZ15GEgsH4vLFz~sxPhiQ~Is7fwzcDf8zSNPdw__&Key-Pair-Id=APKAIE5G5CRDK6RD3PGA)


![p300 mediates early patterns of resistance to BETi in primary AML samples from a phase 1/2 clinical trial of molibresib. (A) Individual plots showing the treatment efficiency of concomitant or sequential treatment with BETi and p300i in 5 primary AML patient samples. Treatment efficacy was measured with CellTiterGlo at day 4 after the commencement of the first treatment. Shown are results from 2 biological replicates for each primary sample. For the sequential treatment mode with BETi first, p300i was added 48 hours after treatment commencement. (B) Violin plots showing treatment efficacy of concomitant or sequential treatment with BETi and p300i in 5 primary samples from patients with AML. Shown are results from 2 biological replicates for each primary sample. For the sequential treatment mode with BETi first, p300i was added 48 hours after treatment commencement. (C) Dot plots of average log2 fold expression changes of the indicated gene sets in 13 patients before and early after dose with molibresib in a phase 1/2 clinical trial. Negative values indicate a decrease in expression in the postdose samples. (D) Violin plots of the average log2 fold expression changes of the indicated genes in 13 patients before and early after dose with molibresib in a phase 1/2 clinical trial. Negative values indicate a decrease in expression in the postdose samples. (E) Viability after treatment with p300i (either 200 nM [upper] or 1000 nM [lower]) or DMSO in primary samples from the molibresib trial at predose and 5 days (for 4 samples) or 10 days (only for patient Moli_BETi_006, for whom samples were obtained at both days 5 and 10) postdose. Shown is the percent viability (measured via CellTiterGlo) to DMSO-treated cells. Due to the limited cell numbers of this clinical trial sample, only 1 “biological” replicate could be obtained. (F-G) Individual examples of viability after treatment with p300i (200 or 1000 nM) or DMSO in the primary samples Moli_BETi_006 (F) or Moli_BETi_12 (G) from the molibresib trial at predose and 5 days (for both patients) or 10 days (only for patient Moli_BETi_006). Shown is the percentage viability (measured via CellTiterGlo) to DMSO-treated cells. (H) Changes in expression of MYC in the same exemplar patient samples Moli_BETi_006 and Moli_BETi_12 at 24 hours of treatment with 200 or 1000 nM of p300i. Shown are log2 FCs to DMSO-treated cells. d5, day 5.](https://ash.silverchair-cdn.com/ash/content_public/journal/blood/145/7/10.1182_blood.2022019306/6/m_blood_bld-2022-019306r1-gr7.jpeg?Expires=1766740412&Signature=ZaeJ28IbRa9p7Bhfgk~L-PnIgxdwZ1Q1g~qhs7mHKc-HKbcg1HHl3tkPNJzPFGq4E9wjBLkTr3TNXnB6t15XRsDpNWkgWtY5oxFjAUxhYdqMQ2bM7C19b4zcRN2IV1ySQVCgsuUcVaVg44TIjMXOgm8qJd8YpxHx6uQ~8SkMxHUS495lpvIIIt6cxF-d8HUdOWKmqxhNsbIsZjVK~sY-WVBVi93aMt4X42yN5qPGIG16YkFTjY3BcfFbNagiO6sCYQ20PCgcWb90MUbvgaOJRFvt2ruekqMfiJLO7UT6WQmsD1uBS-bRiYmIAy2lrnRn2-SZMHFOqvAn8x-0oPPeVg__&Key-Pair-Id=APKAIE5G5CRDK6RD3PGA)