Abstract
Platelet/endothelial cell adhesion molecule-1 (PECAM-1) is a 130-kD member of the Ig gene superfamily that is expressed on platelets, endothelial cells, and certain leukocyte subsets. To examine the factors controlling vascular-specific expression of PECAM-1, we cloned the 5′-flanking region of the PECAM-1 gene and analyzed its transcriptional activity. 5′-Rapid amplification of cDNA ends (5′-RACE) analysis showed that transcription initiation occurred at several closely spaced nearby sites originating approximately 204 bp upstream from the translation start site. Analysis of the sequence immediately upstream from the transcription initiation site (TIS) showed no canonical TATA or CAAT elements, however an initiator element commonly found in TATA-less promoters encompassed the TIS. 5′-serially truncated PECAM-1 promoter segments cloned in front of a luciferase reporter drove transcription in both a lineage- and orientation-specific manner. Putative cis-acting control elements present within a 300-bp core promoter included two ets sites, an Sp1 site, tandem E-box domains, two GATA-associated sites (CACCC), an AP-2 binding site, and a GATA element at −24. Mutational analysis showed that optimal transcriptional activity required the GATA sequence at position −24, and gel-shift assays further showed that the GATA-2 transcription factor, but not GATA-1, bound to this region of the PECAM-1 promoter. Understanding the cis- and trans-acting factors that regulate the tissue-specific expression of PECAM-1 should increase our understanding of the mechanisms by which vascular-specific gene expression is achieved.
PROMOTERS THAT REGULATE the transcription of genes expressed in myeloid, megakaryocytic, and endothelial cells have been examined and used to search for lineage-specific trans-acting factors that control vascular-specific gene expression. Although to date few “lineage-specific” factors per se have been identified, particular combinations of motifs have often been shown to be required for optimal gene expression. In particular, GATA elements appear to play an important role in regulating the transcriptional activity of vascular cell adhesion molecules, including those present in the promoters for human and rat glycoprotein IIb (GPIIb),1-3 human and rat platelet factor 4,4,5 human GPIX,6 GPIb,7 P-selectin,8,9 von Willebrand factor,10 and human CD11b.11
Platelet/endothelial cell adhesion molecule-1 (PECAM-1; CD31) is a 130-kD member of the Ig gene superfamily (IgGSF )12,13 that mediates endothelial cell/endothelial cell interactions,14 as well as leukocyte/endothelial cell interactions during the process of transendothelial migration.15-17 In addition to its adhesive functions, a growing number of studies suggest that PECAM-1 may play a role in cellular signaling, as PECAM-1 becomes phosphorylated after cellular activation,18,19 and engagement of PECAM-1 leads to a number of downstream cellular events, including integrin activation20-22 and lymphocyte refractoriness.23
Cellular expression of PECAM-1 appears to be limited to cells of the vasculature, having been found on the surface of circulating platelets, monocytes, neutrophils, and certain lymphocyte subsets.24 PECAM-1 is also one of the most abundant adhesion molecules on the endothelial cell surface, where it is constitutively expressed at approximately 1 × 10⁶ molecules per cell.25 However, the cis- and trans-acting elements that restrict PECAM-1 expression to vascular cells and the mechanisms by which these factors control the cellular expression of PECAM-1 have not been defined.
Because of the importance of PECAM-1 in mediating cellular interactions and because of the importance of understanding the basic cellular processes that regulate vascular-specific gene expression, we have begun to examine the mechanisms regulating the transcription of PECAM-1 in vascular cells. In this report, we describe the cloning and characterization of the PECAM-1 promoter and the identification of cis-acting sequences that may regulate transcription of the PECAM-1 gene. In addition, we provide evidence that an element at position −24, which preferentially interacts with the GATA-2 transcription factor, is essential for maximal transcriptional activity of the PECAM-1 gene in cells of the megakaryocytic lineage.
MATERIALS AND METHODS
Genomic cloning and Southern blot analysis.A human genomic library, constructed from Sau3AI partially digested peripheral blood leukocyte DNA cloned into EMBL3 was purchased from Clonetech Laboratories (Palo Alto, CA). The library was screened by plaque lift hybridization with a 32P-labeled PECAM-1 cDNA probe spanning nucleotides 1-603 using previously described techniques.12 Southern blot analysis was conducted using the same probe. Inserts derived from positively hybridizing clones were subcloned into the plasmid vector pGEM-7 (Promega Biotech, Madison, WI) for further restriction endonuclease mapping and sequence analysis. Double-stranded sequencing was conducted via the Sanger dideoxy chain termination procedure using both the USB Sequenase Kit (US Biochemical Corp, Cleveland, OH) for manual sequencing and the PRISM Ready Reaction DyeDeoxy Terminator Cycle Sequencing Kit (Applied BioSystems, Foster City, CA) for automated sequencing reactions. The TFSITES database from the Wisconsin Genetics Computer Group (GCG, Madison, Wisconsin) GCG was used to identify potential regulatory motifs within the 5′ flanking region of the PECAM-1 promoter.
Cell lines.Human erythroleukemia (HEL) cells and Raji B lymphoma cells were obtained from the American Type Culture Collection (Rockville, MD), and were grown at 37°C in 5% CO2 in RPMI supplemented with 10% heat-inactivated fetal calf serum, 2 mmol/L glutamine, and 100 U/mL penicillin/100 μg/mL streptomycin. The human Dami promegakaryocytic cell line was a generous gift from Dr R. Handin (Boston, MA) and was grown at 37°C in 5% CO2 in Iscove's modified Dulbecco's medium supplemented with 10% heat-inactivated horse serum, 2 mmol/L glutamine, and 100 U/mL penicillin/100 μg/mL streptomycin. All cells were maintained at 1 to 9 × 10⁵/mL.
Analysis of PECAM-1 expression.Cell surface expression of PECAM-1 was determined by flow cytometry using a rabbit polyclonal antihuman PECAM-1 antibody, termed SEW1626 and detected using dichlorotriazinyl amino fluorescein-conjugated goat-antirabbit F(ab′)2 (Jackson Immunoresearch Laboratories, West Grove, PA). Analysis was conducted on a FACScan (Becton Dickinson, Inc, Palo Alto, CA). Western blot analysis of Triton X-100 detergent cell lysates cells also employed SEW16, at a concentration of 10 μg/mL. Detection was accomplished using the nitro blue terazolium/5-bromo-4-chloro-3-indolyl phosphate (NBT/BCIP) substrate pair, as previously described.27
RNA isolation and reverse transcriptase-polymerase chain reaction (RT-PCR) analysis.RNA was isolated using TRIzol reagent (GIBCO-BRL, Gaithersburg, MD) following the manufacturer's protocol and was stored at −80°C until use for either 5′-rapid amplification of cDNA ends (5′-RACE) or RT-PCR. The integrity of all RNA preparations was evaluated by ethidium bromide staining of agarose gels and by Northern blot analysis (data not shown). For RT-PCR analysis, total RNA was reverse transcribed using 200 U/mL of Moloney Murine Leukemia Virus RT (Boehringer Mannheim, Indianapolis, IN) primed with random hexamer oligonucleotides and poly-dT oligonucleotides. The cDNA was amplified using a sense primer, spanning nucleotides 813-830 of exon 2, having the sequence 5′-TGAACTGGTACCGTGACG-3′ and an antisense primer located in exon 3, spanning nucleotides 1213-1196 of PECAM-1 cDNA, having the sequence 5′-TGAAGTTGGCTGGAGGTGC-3′.28 These oligonucleotide primers yield a 400-bp product when mRNA is used as the template, but greater than 12 kb if the amplification product is derived from genomic DNA. PCR products were separated by 2% agarose gel electrophoresis and visualized by ethidium bromide staining.
5′-RACE.5′-RACE was performed using the 5′-AmpliFINDER RACE Kit (Clonetech) according to the manufacturer's directions, with only minor modifications. cDNA was synthesized using Moloney murine leukemia virus RT with a 40-nucleotide antisense primer beginning at the +204 position and having the sequence 5′-CCTGAGAGTAAGACTGCAGGCACAGTTAGTTCTGCCTTCGG-3′. Anchor-specific PCR amplification was conducted using 1 μL of the anchor-ligated cDNA, 0.2 U/mL of Vent polymerase, 0.5 μmol/L of a forward primer complementary to the anchor, having the sequence 5′-CTGGTTCGGCCCACCTCTGAAGGTTCCAGAATCGATAG-3′, and 0.5 μmol/L of one of two different antisense primers, beginning either 101 bp upstream from the transcription initiation site (TIS), having the sequence 5′-AAAAGCAGAAATTGCTCTGG-3′, or 63 bp upstream from the TIS, having the sequence 5′-GCAGAGAGACCGGCTGTGGC-3′. The resulting PCR products were separated by 2% agarose gel electrophoresis, excised, and subcloned into pGEM7 for sequence analysis.
Expression vectors and the generation of PECAM-1-promoter/reporter constructs.The luciferase expression vector, pGL3-Basic (Promega Biotech), which lacks eukaryotic promoter and enhancer sequences, was used to establish basal levels of luciferase activity in cell lysates. Selected segments of the 5′-flanking region of the PECAM-1 gene were subcloned into pGL3-Basic and examined for their ability to drive luciferase expression over that of pGL3-Basic. The pGL3-Control vector, containing both a simian virus 40 (SV40) promoter and enhancer, was used as a positive control for luciferase expression. The pSVbGal vector, which encodes β-galactosidase under the control of an SV40 promoter and enhancer, was used as an internal control for transfection efficiency.
To generate the −4500/+196 PECAM-1 promoter fragment, genomic clone 7.2 DNA (see Results) was digested with Pst I, and the resulting 4.5-kb Pst I fragment of the PECAM-1 promoter (-4500/+196) was subcloned into pGEM3 vector. The 4.5-kb Pst I segment was then excised using flanking Xba I and Not I sites, and subcloned into pGL3-Basic. Constructs containing this insert in both the forward and the reverse orientation were isolated to give the final −4500/+196 forward construct and +196/-4500 reverse construct.
Other PECAM-1 promoter fragments were generated by PCR using clone 7.2 DNA as a template. Briefly, 50 ng of this genomic clone was resuspended in a total volume of 100 μL containing: 1× Vent buffer [20 mmol/L Tris⋅HCl (pH, 8.8), 10 mmol/L KCl, 10 mmol/L (NH4 )2SO4 , 2 mmol/L MgSO2 0.1% Triton X-100], 1 mg/mL acetylated bovine serum albumin, 0.2 mmol/L of each deoxynucleotide triphosphate, and 0.20 U Vent polymerase (New England Biolabs, Beverly, MA). PCR amplification was performed using a cycle of denaturation at 94°C for 30 seconds, annealing at 56°C for 45 seconds, and primer extension at 72°C for 45 seconds for a total of 30 cycles. To generate the PECAM-1 promoter constructs, four different forward primers were used, beginning at nucleotides −1136 (5′-CACCATGTTGGCCAGGCTGG-3′), −588 (5′-GGGATTACAGGCGTGAGCC-3′), −254 (5′-GATC-TTTCTGGATGTCCTGGG-3′), and −163 (5′-AACGCCAAGGCAAATGTCAC-3′). A reverse primer beginning at base +204 (5′-CCTGAGAGTAAGACTGCAGGCACAGTTAGTCTGCCTTCGG-3′) was used in all cases to generate constructs spanning nucleotides −1136/+204, −588/+204, and −254/+204, and −163-+204. The resulting PCR fragments were subcloned into pGL2-basic, removed by digestion with Xma I and HindIII, and then directionally subcloned into pGL3-Basic. The construct −1136/-882/+20 and the reverse −1136/+20/-882 were generated by Nco I digestion and religation of the −1136/+204 construct.
The GATA mutant construct and a matched wild-type control were generated by overlapping PCR mutagenesis. Two primary PCR reactions were conducted using either Primer Set A, comprised of a forward primer beginning at position −588 (5′-GGGATTACAGGCGTGAGCC-3′) and reverse primer beginning at the −9 position that contained a GATA → CTTT substitution (5′-GGGCTGGCCTGAAAAGTCCTCAGG-3′), or Primer Set B, comprised of a forward primer beginning at −9 that contained the GATA → CTTT substitution (5′-CCTGAGGACTTTTCAGGCCAGCCC-3′) and a reverse primer starting at position +204 (5′-CCTGAGAGTAAGACTGCAGGCACAGTTAGTTCTGCCTT-CGG-3′). The primary PCR products were gel-purified and used as template in a secondary PCR reaction using the forward primer at position −588 and the reverse primer at position +204. The final PCR product was gel-purified, and digested with Bgl II and Nco I to generate a −254 to +20 fragment that was subcloned into pGL3-Basic. The sequences of all promoter constructs were verified by automated DNA sequence analysis.
Transfections.Cells to be transfected by electroporation were maintained at 1 to 9 × 10⁵/mL, harvested, rinsed 2 times in ice cold phosphate-buffered saline, and resuspended to a final concentration of 3.3 × 10⁷/mL. A total of 1 × 10⁷ cells were placed in each of duplicate 0.4-cm gap electroporation cuvettes (BioRad Corp, Richmond, CA) and 50 mL of a DNA mixture comprised of 50 μg of a PECAM-1/pGL3 promoter construct together with 10 μg of the vector pSVbGal. The cell-plasmid mixture was incubated on ice for 10 minutes and then electroporated at 250 V, 950 mF, using a GenePulserII (BioRad). The time constants ranged from 44 to 54 milliseconds. After electroporation, the cells were allowed to recover for 10 minutes on ice. The cells were then resuspended in growth media, plated in 35-mm wells in 6-well plates, placed at 37°C in 5% CO2 , and grown for 48 hours. Transfected cells were harvested and lysed in 200 μL of 1X Reporter Lysis Buffer (Promega). Luciferase activity and β-galactosidase activity were measured according to the manufacturer's protocols (Promega and Tropix, Inc [Bedford, MA], respectively) using a Turner Model TD20e luminometer (Sunnyvale, CA). Each sample was assayed in duplicate for both luciferase and β-galactosidase activity. Luciferase activity was normalized to the β-galactosidase activity, and the data were expressed as normalized luciferase activity (luciferase relative light units [RLU]/100 β-galactosidase RLU). All results shown were derived from the average of at least three individual experiments, with each experiment being conducted in duplicate.
Oligonucleotide preparation and labeling.The GATA wild-type oligonucleotide encoding the GATA site at position −24 in the PECAM-1 promoter had the sequence 5′-GTCATTTCCTGAG-GAGATATCAGGCCAGCC-3′. The mutant oligonucleotide had the sequence 5′-GTCATTTC-CGAGGACTTTTCAGGCCAGCC-3′. Double-stranded oligonucleotides were prepared by annealing equal molar amounts of complementary strands of DNA, followed by purification on Sephadex G-25 spin columns (Pharmacia Biotech, Inc, Uppsala, Sweden). Double-stranded oligonucleotides were then end-labeled with (γ-32P)adenosine triphosphate to a specific activity of 30,000 cpm/ng using T4 polynucleotide kinase (New England Biolabs) and repurified on a Sephadex G-25 spin column.
Electrophoretic mobility-shift assays (EMSAs).Nuclear extracts were prepared by the method of Dignam et al29 and stored in liquid nitrogen. Protein concentration was determined using the bicinchoninic acid assay (Pierce, Inc, Rockford, IL). DNA-binding assays were performed by incubating 10 μg of nuclear extract protein in binding buffer (20 mmol/L Tris [pH, 7.9], 80 mmol/L KCl, 10 mmol/L MgCl2 , 2 mmol/L 1,4-dithiothreitol, and 10% glycerol) with 1 μg poly (dI-dC; Pharmacia Biotech, Inc) and 0.5 ng of 32P-labeled, double-stranded oligonucleotides for 30 minutes at 22°C. For competition studies, 100-fold molar excess of unlabeled double-stranded oligonucleotide was preincubated for 30 minutes at 22°C in the reaction mixture before the addition of labeled double-stranded oligonucleotide. For immunodepletion of the DNA-protein complexes, 1 μg of monoclonal antibody to either GATA-1 or GATA-2 (Santa Cruz Biotechnology, Inc, Santa Cruz, CA) was preincubated for 30 minutes at 22°C with the reaction mixture before the addition of the labeled double-stranded oligonucleotide. Both of these antibodies displayed specific reactivity for their respective proteins by Western blot and immunohistochemistry. DNA-protein complexes were separated from free oligonucleotide on a 7% nondenaturing polyacrylamide gel containing 2.5% glycerol. Gels were electrophoresed at 40 mA for 90 minutes in a low ionic strength TAE (7 mmol/L Tris [pH, 7.9], 3.5 mmol/L sodium acetate, and 2 mmol/L EDTA). The gel was then fixed in 10% methanol/10% acetic acid, dried, and exposed to KODAK Biomax MR (Eastman-Kodak, Rochester, NY) film for autoradiography.
RESULTS
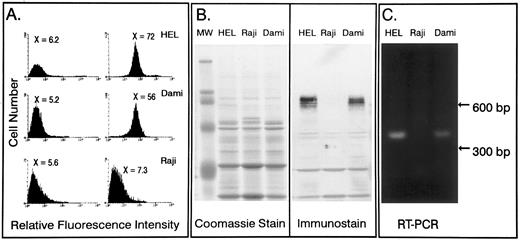
Expression of PECAM-1 on transformed leukocyte cell lines.As a prelude to examining the activity of the PECAM-1 promoter, we characterized several transformed cell lines for their ability to express PECAM-1. Because platelets are an end-stage differentiation product of megakaryocytes, we examined the expression of PECAM-1 in two megakaryocytic tumor cell lines, HEL30 and Dami.31 Raji cells, which are derived from a B-cell lymphoma,32 were employed as a negative control. Flow cytometric analysis was performed using the polyclonal antihuman PECAM-1 antibody, SEW16. As shown in Fig 1A, both HEL and Dami cells express PECAM-1 on the cell surface, whereas Raji cells do not. Western blot analysis of total cellular PECAM-1 present in detergent cell lysates from HEL, Dami, and Raji cells (Fig 1B), confirmed these observations. To ensure that the lack of detectable PECAM-1 protein in Raji cells was not due to failure to translate PECAM-1 mRNA, the presence of PECAM-1–specific mRNA in all three cell lines was also examined by Northern blot analysis (data not shown) and RT-PCR. As shown in Fig 1C, whereas both HEL and Dami cell mRNA yielded PECAM-1–specific amplification products, Raji cells did not express detectable levels of PECAM-1 mRNA.
Characterization of PECAM-1 expression on leukocyte tumor cell lines. The human leukocyte cell lines HEL, Dami, and Raji were examined for PECAM-1 expression. (A) Flow cytometric analysis of PECAM-1 expression. Cells were stained with either normal rabbit IgG or the human PECAM-1–specific polyclonal rabbit IgG, SEW16. Detection was accomplished by staining with a dichlorotriazinyl amino fluorescein-conjugated goat antirabbit IgG. As shown, HEL and Dami cells, express PECAM-1 on their surface, whereas Raji cells are negative. (B) Western blot analysis of PECAM-1 expression in HEL, Dami, and Raji cells was performed using SEW16. Detection was accomplished using alkaline phosphatase-conjugated goat antirabbit secondary antibody. Note that Raji cells do not contain even an intracellular pool of detectable PECAM-1. (C) RT-PCR analysis of PECAM-1 mRNA levels. mRNA was isolated from HEL, Dami, and Raji cells and subjected to RT-PCR using primers spanning a 400-bp region of PECAM-1 that include exons 2 and 3. These primers would yield a PCR product of greater than 12-kb product if amplification were to occur from genomic DNA. As shown, both HEL and Dami cells express PECAM-1 mRNA, whereas Raji cells are negative.
Characterization of PECAM-1 expression on leukocyte tumor cell lines. The human leukocyte cell lines HEL, Dami, and Raji were examined for PECAM-1 expression. (A) Flow cytometric analysis of PECAM-1 expression. Cells were stained with either normal rabbit IgG or the human PECAM-1–specific polyclonal rabbit IgG, SEW16. Detection was accomplished by staining with a dichlorotriazinyl amino fluorescein-conjugated goat antirabbit IgG. As shown, HEL and Dami cells, express PECAM-1 on their surface, whereas Raji cells are negative. (B) Western blot analysis of PECAM-1 expression in HEL, Dami, and Raji cells was performed using SEW16. Detection was accomplished using alkaline phosphatase-conjugated goat antirabbit secondary antibody. Note that Raji cells do not contain even an intracellular pool of detectable PECAM-1. (C) RT-PCR analysis of PECAM-1 mRNA levels. mRNA was isolated from HEL, Dami, and Raji cells and subjected to RT-PCR using primers spanning a 400-bp region of PECAM-1 that include exons 2 and 3. These primers would yield a PCR product of greater than 12-kb product if amplification were to occur from genomic DNA. As shown, both HEL and Dami cells express PECAM-1 mRNA, whereas Raji cells are negative.
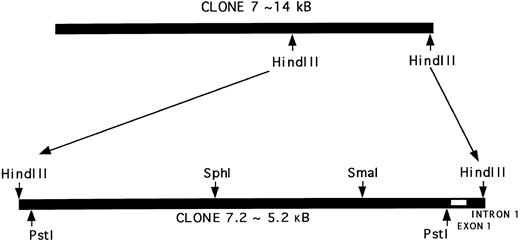
Characterization of a genomic clone encompassing the 5′-region of the PECAM-1 gene.A 15-kb λgt11 genomic clone (Clone 7) that hybridizes specifically with the 5′-region of PECAM-1 cDNA has previously been described.28 Further digestion of this clone with HindIII yielded a 5.2-kb fragment that hybridized specifically with PECAM-1 cDNA (data not shown). This 5.2-kb fragment was subcloned into pGEM-7 to give Clone 7.2, which was used for further restriction endonuclease mapping and sequence analysis. As shown schematically in Fig 2, Clone 7.2 contains part of intron one, exon one, and greater than 4.5 kb of upstream sequence. A number of smaller fragments of Clone 7.2 were derived by restriction digestion, including an internal 4.7-kb Pst I beginning only 4 bp upstream from the initiator methionine of the PECAM-1 signal peptide, a 2.8-kb Sph I/HindIII fragment, and a 1.3-kb Sma I/HindIII fragment. The latter fragment was subcloned into pGEM3, and its sequence determined in its entirety (Fig 3).
Characterization of a genomic clone containing the 5′-flanking region of the PECAM-1 gene. The map of Clone 7.2 (5.2 kb) indicates the relative position of selected introns and exons, as well as the restriction sites for several enzymes. As shown, digestion with Pst I, Sph I, or Sma I, alone or in combination with HindIII, yielded the following fragments: Pst I to Pst I (4.7 kb), Sph I to HindIII (2.8 kb), and Sma I to HindIII (1.5 kb). These fragments were subcloned into the vector pGEM7 for sequence analysis.
Characterization of a genomic clone containing the 5′-flanking region of the PECAM-1 gene. The map of Clone 7.2 (5.2 kb) indicates the relative position of selected introns and exons, as well as the restriction sites for several enzymes. As shown, digestion with Pst I, Sph I, or Sma I, alone or in combination with HindIII, yielded the following fragments: Pst I to Pst I (4.7 kb), Sph I to HindIII (2.8 kb), and Sma I to HindIII (1.5 kb). These fragments were subcloned into the vector pGEM7 for sequence analysis.
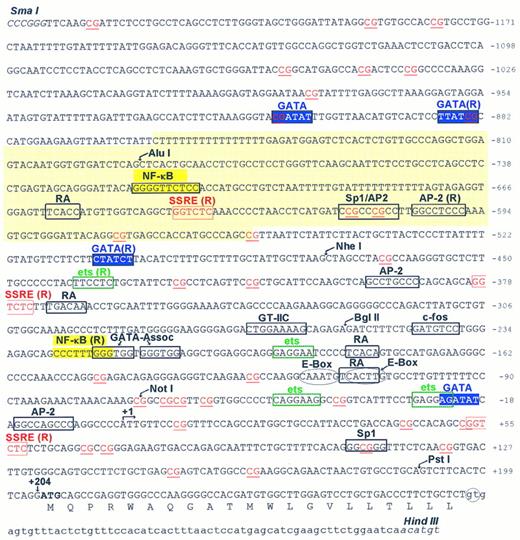
Sequence and structural features of the 5′-flanking region of the PECAM-1 gene. The 1,588-bp sequence shown contains 1,252 bases of the 5′-flanking region of the PECAM-1 gene, as well as the 5′ untranslated region, exon 1 and the beginning of intron 1. All numbering is relative to the Transcription Initiation Site (arrow at +1). The translated protein sequence corresponding to exon 1 is shown as single letter amino acids. Putative regulatory elements are boxed and labeled, and selected restriction enzymes sites used in subcloning this fragment, either in part or in its entirety, are also shown. GATA elements potentially involved in transcriptional regulation of the PECAM-1 promoter are shown in white against a blue background. An Alu sequence spanning nucleotides −859 to −557 is backshadowed in yellow, and contains one of three putative SSREs (shown in red). The ATG translation start site at +205 is shown in bold.
Sequence and structural features of the 5′-flanking region of the PECAM-1 gene. The 1,588-bp sequence shown contains 1,252 bases of the 5′-flanking region of the PECAM-1 gene, as well as the 5′ untranslated region, exon 1 and the beginning of intron 1. All numbering is relative to the Transcription Initiation Site (arrow at +1). The translated protein sequence corresponding to exon 1 is shown as single letter amino acids. Putative regulatory elements are boxed and labeled, and selected restriction enzymes sites used in subcloning this fragment, either in part or in its entirety, are also shown. GATA elements potentially involved in transcriptional regulation of the PECAM-1 promoter are shown in white against a blue background. An Alu sequence spanning nucleotides −859 to −557 is backshadowed in yellow, and contains one of three putative SSREs (shown in red). The ATG translation start site at +205 is shown in bold.
Detection of multiple transcription initiation sites.Primer extension analysis of total RNA isolated from human umbilical vein endothelial cells (HUVECs) showed a relatively broad band denoting the major TIS, as well as several other minor initiation sites for the PECAM-1 gene, all located within a region approximately 200 bp upstream from the translation start site28 (and indicated by “+1” in Fig 3). To insure that the primer extension products previously observed corresponded with the sequence of Clone 7.2 and to determine whether transcription of PECAM-1 mRNA initiated at the same site in different vascular cells, 5′-RACE was conducted using total RNA isolated from HUVECs and HEL, Dami, and Raji cells. As shown in Fig 4A, 5′-RACE products derived from each of these cell types were comparable in size, but were composed of a broad band, consistent with the presence of multiple PCR products of similar but not identical size. Sequence analysis of these 5′-RACE products (Fig 4B) confirmed that transcription of the PECAM-1 gene initiates from several closely spaced nucleotides, most of which are found proximal to the sequence CCCATTGTTC, a motif that corresponds closely with that of an initiator element (Inr), often found to direct transcription initiation in promoters that lack well-defined TATA boxes.33
Identification of multiple transcription initiation sites for the PECAM-1 gene. (A) 5′-RACE analysis. Total RNA was isolated from HUVEC, HEL, and Dami cells, all which express PECAM-1, as well as from the PECAM-1-negative Raji cell line. 5′-RACE analysis was conducted using a forward primer complementary to the anchor together with one of two different antisense primers, beginning either 63 bp upstream from the major TIS (lanes A) or 101 bp upstream from the TIS (lanes B), as described in Materials and Methods. The resulting PCR products were separated by agarose gel electrophoresis and visualized by ethidium bromide staining. (A) and (B) represent the two separate primer sets used (see Materials and Methods). As shown, HUVECs and HEL and Dami cells yielded comparably sized products, indicating that all three cell lines use the same region for transcription initiation. Note that the bands on the gel are somewhat broad, suggesting that a number of closely spaced PCR products might exist within each band. Raji cells showed no specific amplification products. (B) Sequence analysis of the 5′-RACE products. The 5′-RACE products shown in (A) were excised, subcloned, and sequenced. A summary of the 5′-termini derived from sequencing 15 individual clones is shown. The number under a specific nucleotide indicates the number of clones whose 5′-end corresponded to that particular base. The TIS, as previously determined by primer extension analysis,28 is shown above the sequence. Based on the 5′-RACE data, it appears that transcription of the PECAM-1 gene initiates at several closely spaced sites within this region.
Identification of multiple transcription initiation sites for the PECAM-1 gene. (A) 5′-RACE analysis. Total RNA was isolated from HUVEC, HEL, and Dami cells, all which express PECAM-1, as well as from the PECAM-1-negative Raji cell line. 5′-RACE analysis was conducted using a forward primer complementary to the anchor together with one of two different antisense primers, beginning either 63 bp upstream from the major TIS (lanes A) or 101 bp upstream from the TIS (lanes B), as described in Materials and Methods. The resulting PCR products were separated by agarose gel electrophoresis and visualized by ethidium bromide staining. (A) and (B) represent the two separate primer sets used (see Materials and Methods). As shown, HUVECs and HEL and Dami cells yielded comparably sized products, indicating that all three cell lines use the same region for transcription initiation. Note that the bands on the gel are somewhat broad, suggesting that a number of closely spaced PCR products might exist within each band. Raji cells showed no specific amplification products. (B) Sequence analysis of the 5′-RACE products. The 5′-RACE products shown in (A) were excised, subcloned, and sequenced. A summary of the 5′-termini derived from sequencing 15 individual clones is shown. The number under a specific nucleotide indicates the number of clones whose 5′-end corresponded to that particular base. The TIS, as previously determined by primer extension analysis,28 is shown above the sequence. Based on the 5′-RACE data, it appears that transcription of the PECAM-1 gene initiates at several closely spaced sites within this region.
Structural features of the PECAM-1 promoter.Figure 3 shows the DNA sequence of the first 1,300 bp upstream from the translation start site. As predicted by the presence of multiple transcription initiation sites (Fig 4), the PECAM-1 promoter lacks consensus TATA or CAAT elements, but contains numerous consensus binding sequences for a number of trans-acting regulatory proteins. Interestingly, the first 1,300 nucleotides of the 5′-flanking region have a high GC content (68%) and contain more than 30 CpG dinucleotide sequences, including four Hpa II restriction sites (CCGG) in the immediate vicinity of the TIS, suggesting that the methylation state of this region may be one mechanism by which cells suppress their transcription of the PECAM-1 gene in a tissue-specific manner.34-36 Other consensus cis-acting regulatory sequence motifs present in the PECAM-1 promoter include Pu/ets sites at −439, −193, −49, and −28; NF-κB sites at −718 and −226; three shear-stress–responsive elements (SSREs) at positions −641, −379, and +53; Sp1 sites at −615, −612, and +107; retinoic acid receptor-binding motifs at −659, −371, −182, and −111; a GTIIc element at position −269; E-box domains at −117 and −110; two tandem GATA-associated sites at −220 and −213; and GATA elements at −913, −888, −508, and −24. An Alu repeat spanning nucleotides −859 to −557 was also found to be present within the 5′-flanking region of the PECAM-1 gene.
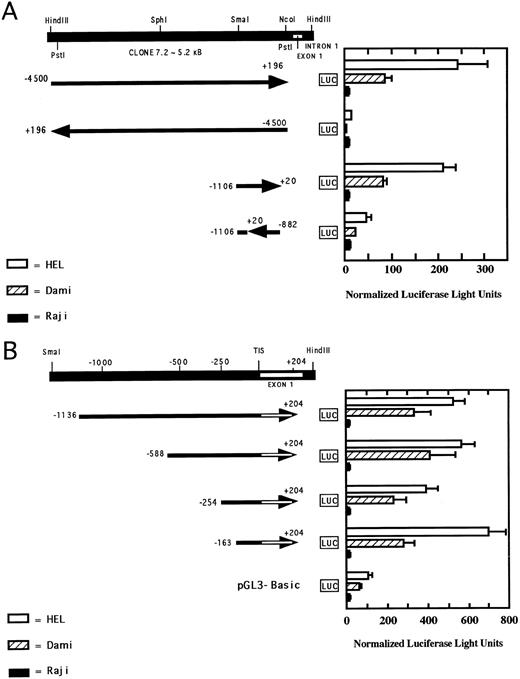
Transcriptional activity of the PECAM-1 promoter.The transcriptional activity of the PECAM-promoter was characterized by ligating selected segments of the 5′-flanking region of the PECAM-1 gene in front of the structural gene for luciferase in the reporter vector pGL3-Basic and transfecting HEL, DAMI, and Raji cells. As shown in Fig 5A, transfection of two different constructs, one encompassing nucleotides −4500 to +196 and the other comprised of nucleotides −1136 to +20, resulted in considerable luciferase expression in both HEL and Dami cells, whereas little or no luciferase activity was found in transfected Raji cells, demonstrating lineage-specific regulation of PECAM-1 gene expression. The transcriptional activity observed was orientation-specific, as paired reverse-orientation constructs displayed little or no activity in any cell type examined. Examination of additional 5-serially–truncated constructs (Fig 5B) showed that the PECAM-1 promoter retained tissue-specific transcriptional activity down to a fragment spanning nucleotides −163 to +204. Based on these observations, our data suggest that a core promoter region encompassing nucleotides −163 to +204 of the PECAM-1 gene contains much of the information necessary to drive transcriptional activity in a megakaryocytic lineage-specific manner.
Analysis of transcriptional activity of the 5′-flanking region of the PECAM-1 gene. HEL, Dami, and Raji cells were transfected with PECAM-1 promoter/luciferase reporter constructs (shown schematically on the left) containing selected segments of the 5′-flanking region of the PECAM-1 gene. Luciferase assays were conducted as described in Materials and Methods to assess transcriptional activity, which was normalized to β-galactosidase activity derived from equal transfection of a separate reporter plasmid encoding lacZ. The boundaries of the constructs are numbered relative to the transcription initiation site, and the relative 5′ → 3′ orientation of each construct is indicated by the direction of the arrow. Normalized luciferase activity present in each transfected cell line is indicated on the right. The data shown represent the mean ± SEM of three independent experiments, each performed in duplicate. (A) Orientation-specific transcriptional activity of the 5′-flanking region of the PECAM-1 gene. Note that both the longer 4,500-bp construct, as well as the shorter 1,100-bp construct are capable of driving orientation- and lineage-specific transcription of luciferase activity. (B) Localization of transcriptional activity to a core region of the PECAM-1 promoter. 5′-serially-truncated PECAM-1 promoter/luciferase constructs were assayed for luciferase activity to assess PECAM-1 promoter activity in HEL, Dami, and Raji cells as described in the text. Note that the region encompassing nucleotides −163 to +204 retains transcriptional activity in the PECAM-1–positive HEL and Dami cells and that all constructs failed to drive transcription in Raji cells.
Analysis of transcriptional activity of the 5′-flanking region of the PECAM-1 gene. HEL, Dami, and Raji cells were transfected with PECAM-1 promoter/luciferase reporter constructs (shown schematically on the left) containing selected segments of the 5′-flanking region of the PECAM-1 gene. Luciferase assays were conducted as described in Materials and Methods to assess transcriptional activity, which was normalized to β-galactosidase activity derived from equal transfection of a separate reporter plasmid encoding lacZ. The boundaries of the constructs are numbered relative to the transcription initiation site, and the relative 5′ → 3′ orientation of each construct is indicated by the direction of the arrow. Normalized luciferase activity present in each transfected cell line is indicated on the right. The data shown represent the mean ± SEM of three independent experiments, each performed in duplicate. (A) Orientation-specific transcriptional activity of the 5′-flanking region of the PECAM-1 gene. Note that both the longer 4,500-bp construct, as well as the shorter 1,100-bp construct are capable of driving orientation- and lineage-specific transcription of luciferase activity. (B) Localization of transcriptional activity to a core region of the PECAM-1 promoter. 5′-serially-truncated PECAM-1 promoter/luciferase constructs were assayed for luciferase activity to assess PECAM-1 promoter activity in HEL, Dami, and Raji cells as described in the text. Note that the region encompassing nucleotides −163 to +204 retains transcriptional activity in the PECAM-1–positive HEL and Dami cells and that all constructs failed to drive transcription in Raji cells.
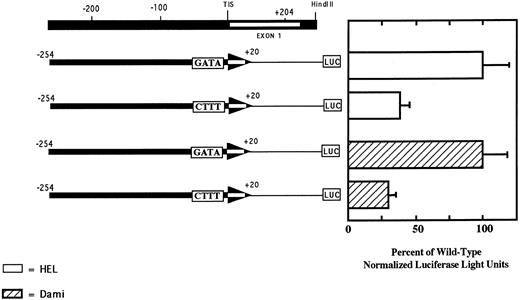
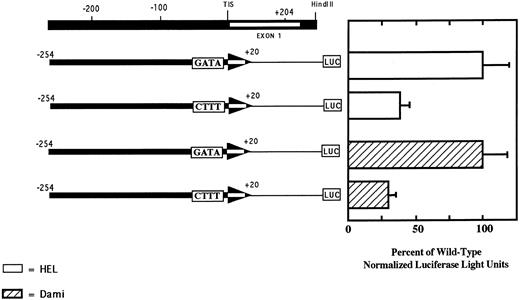
The GATA element at −24 is required for optimal transcriptional activity of the PECAM-1 promoter.As shown in Fig 3, the region from −163 to +204 contains numerous potential cis-acting elements that may regulate PECAM-1 expression. The GATA sequence at position −24 of the PECAM-1 promoter was of particular interest, because similarly positioned GATA motifs have been shown to serve as a weak surrogate for the binding of TFIID in other TATA-less core promoters, including those of the platelet factor 4 (PF4), GPIIb, and erythropoeitin genes.37 To determine whether the GATA element at position −24 in the PECAM-1 gene functioned as a positive regulatory element, we mutated the wild-type sequence 5′-GATA-3′ to 5′-CTTT-3′ in a pGL3 construct containing nucleotides −254 to +20 of the PECAM-1 promoter, and examined its effect on transcription. As shown in Fig 6, when this construct was transfected into HEL and Dami cells, luciferase activity was reduced by approximately 70% compared with that of the wild-type control. Neither of these constructs showed transcriptional activity in Raji cells (data not shown). These results show that the GATA element at position −24 of the PECAM-1 gene is functional and contributes to the optimal lineage-specific transcription of the PECAM-1 gene.
The GATA element at position −24 contributes to the transcriptional activity of the PECAM-1 promoter. HEL and Dami cells were transfected with the reporter constructs shown and cellular lysates assayed for luciferase activity to access transcriptional activity. Note that substitution of the sequence 5′-CTTT-3′ for the wild-type 5′-GATA-3′ resulted in a 70% reduction in PECAM-1 promoter activity in both megakaryocytic cell lines. PECAM-1-negative Raji cells showed no transcriptional activity when transfected with either reporter construct (data not shown). Data shown represent the mean ± SEM of three independent experiments, each performed in duplicate.
The GATA element at position −24 contributes to the transcriptional activity of the PECAM-1 promoter. HEL and Dami cells were transfected with the reporter constructs shown and cellular lysates assayed for luciferase activity to access transcriptional activity. Note that substitution of the sequence 5′-CTTT-3′ for the wild-type 5′-GATA-3′ resulted in a 70% reduction in PECAM-1 promoter activity in both megakaryocytic cell lines. PECAM-1-negative Raji cells showed no transcriptional activity when transfected with either reporter construct (data not shown). Data shown represent the mean ± SEM of three independent experiments, each performed in duplicate.
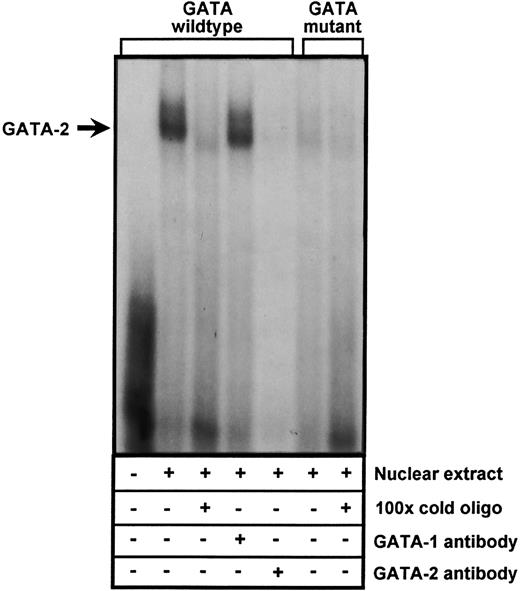
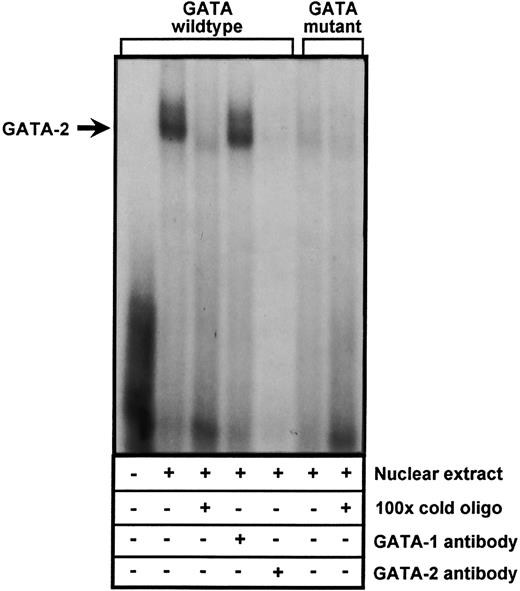
The −24 element binds GATA-2.To further corroborate these results and confirm that the GATA element at −24 is able to interact with at least one of the GATA transcription factors, EMSAs were performed using a double-stranded oligonucleotide probe encompassing the −24 GATA site. As shown in Fig 7, incubation of nuclear extracts from DAMI cells with the 32P-labeled oligo resulted in the formation of a specific DNA-protein complex that was completely inhibited by a 100-fold molar excess of unlabeled probe. A double-stranded oligonucleotide containing a CTTT sequence in place of GATA (identical to that used in the functional assays shown in Fig 6) did not form the DNA-protein complex. To determine which GATA transcription factor bound the −24 GATA element (both GATA-1 and GATA-2 are expressed in megakaryocytes), we immunodepleted the nuclear extracts with antibody directed against either GATA-1 and GATA-2. Formation of the major DNA-protein complex was unaffected by preincubation with anti-GATA–1, but preincubation of the nuclear extract with the GATA-2–specific antibody resulted in the complete loss of the major DNA-protein complex. Comparable results were obtained using HEL cell nuclear extracts (data not shown). Together with the results shown in Fig 6, these data suggest that GATA-2 binds to and regulates PECAM-1 gene expression in cells of the megakaryocytic lineage.
Binding of the transcription factor, GATA-2, to the −24 GATA element of the PECAM-1 promoter. Nuclear extracts derived from DAMI cells were incubated with a 32P-labeled double-stranded oligonucleotide containing either a GATA consensus binding site (lanes 2 to 5) or a mutated CTTT sequence in its place (lanes 6 and 7). Competition reactions were performed using a 100-fold molar excess of unlabeled double-stranded oligonucleotide containing either the wild-type (lane 3) or mutant CTTT sequence (lane 7). Immunodepletion studies (lanes 4 and 5) were conducted by preincubating the nuclear extracts with 1 μg of a monoclonal antibody specific for either GATA-1 (lane 4) or GATA-2 (lane 5). Note that a GATA-2-specific DNA-protein complex (arrow) forms only when the GATA sequence is present. Comparable results were obtained using nuclear extracts derived from HEL cells (data not shown).
Binding of the transcription factor, GATA-2, to the −24 GATA element of the PECAM-1 promoter. Nuclear extracts derived from DAMI cells were incubated with a 32P-labeled double-stranded oligonucleotide containing either a GATA consensus binding site (lanes 2 to 5) or a mutated CTTT sequence in its place (lanes 6 and 7). Competition reactions were performed using a 100-fold molar excess of unlabeled double-stranded oligonucleotide containing either the wild-type (lane 3) or mutant CTTT sequence (lane 7). Immunodepletion studies (lanes 4 and 5) were conducted by preincubating the nuclear extracts with 1 μg of a monoclonal antibody specific for either GATA-1 (lane 4) or GATA-2 (lane 5). Note that a GATA-2-specific DNA-protein complex (arrow) forms only when the GATA sequence is present. Comparable results were obtained using nuclear extracts derived from HEL cells (data not shown).
DISCUSSION
In this report, we have described the cloning and initial characterization of the PECAM-1 promoter, as well as the identification a specific GATA-2 binding site that regulates, in part, the expression of PECAM-1 in cells of the megakaryocytic lineage. Characterization of a 5.2-kb genomic clone encompassing intron 1, exon 1, and approximately 5 kb upstream from the translation initiation site (Fig 2) showed a promoter that (1) is GC-rich and devoid of TATA and CAAT elements (Fig 3), (2) contains a number of closely-spaced TIS (Fig 4), and (3) uses a functionally analogous initiator element first described for the terminal deoxytransferase (TdT) gene promoter,33 to direct transcription initiation. Thus, the PECAM-1 promoter joins a growing list of vascular cell adhesion molecule genes that use a TATA-less, CAAT-less promoter possessing multiple, closely spaced transcription initiation sites, including the promoters for the GPIIb1,38 α2 ,39 and α540 integrin subunits, platelet GPIX,6 human CD11a,41 CD11b,11,42,43 and CD18.44 45
Functional analysis of the 5′-flanking region of the PECAM-1 gene indicated that a 4.7-kb Pst I genomic fragment contains the promoter for the PECAM-1 gene, and that a 1-kb segment spanning nucleotides −1136 to +20 was capable of driving orientation-specific transcriptional activity in a lineage-restricted manner (Fig 5A). Further analyses of 5′-serially–truncated constructs within this region identified a core promoter encompassing nucleotides −163 to +204 that could drive high-level transcriptional activity in HEL and Dami cells, which express PECAM-1, but only basal expression in Raji cells, which are PECAM-1–negative (Fig 5B). Although these studies suggest that this core promoter region may be sufficient for specific expression in cells of the megakaryocytic lineage, functional analysis of similar PECAM-1 promoter constructs in endothelial cells and myeloid precursor cells will be required to determine if the same cis- and trans-acting factors serve to regulate PECAM-1 gene expression in these cell types. Furthermore, studies in transgenic mouse models will be necessary to determine if this region is sufficient to mediate tissue-specific expression in vivo.
Given the tight restriction of PECAM-1 protein expression to cells of the vasculature, PECAM-1 gene expression is likely to be regulated at several levels. In this regard, it is notable that there are more than 30 CpG dinucleotide sequences within the first 1,300 bp of the PECAM-1 promoter, with an especially high CpG:GpC ratio (>0.5) in the stretch running from −150 to +120, centered around the transcription initiation site. CpG island chromatin can be the target of DNA methylation and differs from bulk chromatin in a number of respects, including a reduction in histone H1 and a general absence of nucleosomes in the region.46 Though we have not yet performed Hpa II/Msp digests on cells that differentially regulate PECAM-1 expression, it is possible that methylation may be one mechanism by which PECAM-1 gene expression is regulated at the “pretranscriptional” level.
Examination of the PECAM-1 promoter showed potential binding sites for a number of known trans-acting regulatory elements, including those that bind to AP-2, GATA, ets (Pu), Sp1, NF-kb, retinoic acid receptor, E-box domain, and SSRE motifs. The locations of these putative cis-acting control elements within the PECAM-1 promoter is provided in Fig 3. Of particular interest were four potential GATA-binding motifs identified within the first 1,000 nucleotides of the PECAM-1 promoter (Fig 3). Functionally active GATA elements have been identified within the promoters of a large number of genes that are expressed constitutively in vascular cells. Like PECAM-1, the promoters for a subset of these, including rat PF4, human GPIIb, and human GPIX, are all TATA-less, “TdT-type” promoters that harbor GATA elements near the −30 region. Examination of several such GATA-box–containing promoters in vitro has shown that the GATA box can serve not only as a recognition site for members of the GATA family of transcription factors,2,47-49 but also as a recognition site for basal transcription factors.37 Although deletional analysis did not show a requirement for the GATA elements at positions −913, −888, or −508, sited directed mutagenesis showed that the −24 GATA element contributes to the optimal transcriptional activity of the PECAM-1 core promoter (Fig 6). Because both GATA-1 and GATA-2 transcription factors are present in cells of the megakaryocyte and endothelial cell lineage and have been shown to bind sequences similar to that found within the PECAM-1 promoter,2 47-49 it was hypothesized that one or both of these factors may participate in regulating PECAM-1 expression in megakaryocytes. EMSAs and immunodepletion experiments (Fig 7) showed that the transcription factor GATA-2, but not GATA-1, bound specifically to the −24 GATA element. Thus, GATA-2 appears to regulate the transcription of PECAM-1 in cells of the megakaryocytic lineage.
In conclusion, we have characterized the 5′-flanking region of the PECAM-1 gene and showed that a GATA-2 binding element within the core PECAM-1 promoter contributes to its optimal transcriptional activity. Further mutational analysis of other cis-acting sequences found within this region should result in the identification of other regulatory elements that contribute to the transcriptional activity of the PECAM-1 promoter. It will be interesting to determine whether the same factors responsible for transcriptional activity in cells of the megakaryocytic lineage are operative in myeloid (monocytic/neutrophil) cells and endothelial cells. Further characterization of the PECAM-1 promoter, in conjunction with studies of the promoters of other vascularly expressed genes, may clarify how common elements such as GATA regulate gene expression restricted to the vasculature.
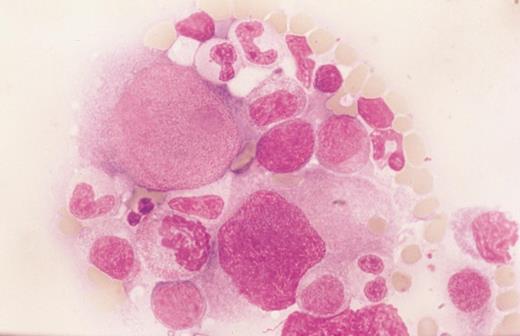
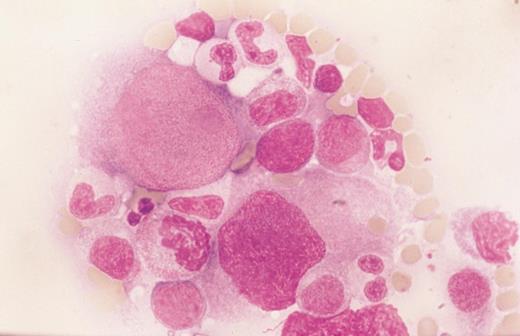
Parvovirus-induced red blood cell aplasia. A patient with hereditary spherocytosis presented with severe anemia and reticulocytopenia. The marrow showed giant pronormoblasts (with size comparable to that of megakaryocytes) and absence of normoblasts. The condition can be mistaken for marrow involvement by large-cell lymphoma. (Courtesy of K.F. Wong and J.K.C. Chan, Department of Pathology, Queen Elizabeth Hospital, Hong Kong.)
Parvovirus-induced red blood cell aplasia. A patient with hereditary spherocytosis presented with severe anemia and reticulocytopenia. The marrow showed giant pronormoblasts (with size comparable to that of megakaryocytes) and absence of normoblasts. The condition can be mistaken for marrow involvement by large-cell lymphoma. (Courtesy of K.F. Wong and J.K.C. Chan, Department of Pathology, Queen Elizabeth Hospital, Hong Kong.)
ACKNOWLEDGMENT
We thank M. Poncz and J. Morris for helpful discussions and consultation in experimental design and N. Almendro and Dr C. Bernabeu for sharing their unpublished data.
Supported by Grant No. HL40926 (to P.J.N) and Training Grant No. HL-07209 from the National Institutes of Health (Bethesda, MD). R.J.G. is the recipient of a Medical Scientist Training Fellowship from the Medical College of Wisconsin (Milwaukee, WI) and a predoctoral fellowship from the American Heart Association, Wisconsin Affiliate. P.J.N. is an Established Investigator of the American Heart Association (Milwaukee, WI).
Presented in part in abstract form at the 37th Annual Meeting of the American Society of Hematology, Seattle, WA, December 1-5, 1995.
Address reprint requests to Peter J. Newman, PhD, Blood Research Institute, The Blood Center of Southeastern Wisconsin, PO Box 2178, Milwaukee, WI 53201-2178.

