Abstract
The DNA synthesis inhibitor hydroxyurea (HU) was administered to determine whether it induces changes in the cell-cycle status of primitive hematopoietic stem cells (HSCs)/progenitors. Administration of HU to mice leads to bone marrow accumulation of c-kit+Thy-1.1loLin−/loSca-1+ (KTLS) cells in S/G2/M phases of the cell cycle. HU is a relatively nontoxic, reversible cell-cycle agent that can lead to approximately a threefold expansion of KTLS cells in vivo and approximately an eightfold increase in the number of KTLS cells in S/G2/M. HSCs in HU-treated mice have undiminished multilineage long-term and short-term clonal reconstitution activity.
HYDROXYUREA (HU) has been used clinically as an anticancer drug, such as in the treatment of chronic myelogenous leukemia.1,2 HU has also been used to treat sickle cell anemia3 because it stimulates fetal hemoglobin synthesis,4 although the mechanism is not completely understood. Administration of effective doses of HU to patients even over the long term (a few weeks to >5 years) has little or no life-threatening myelosuppressive effect.1,2 HU can reversibly inhibit DNA synthesis in mammalian cells5,6 primarily by inhibiting ribonucleotide reductase and thereby decreasing de novo synthesis of essential DNA precursors. This can lead to the accumulation of cells in the late G1 to early S phase of the cell cycle.7
In this study, we tested the effect of HU treatment on murine hematopoietic stem cells (HSCs) in vivo to determine whether this treatment could synchronize HSCs in early S phase. We treated mice with HU and analyzed a purified population of HSCs that express the phenotype c-kit+Thy-1.1loLin−/loSca-1+ (KTLS).8-12 KTLS cells include a heterogeneous population of multipotent progenitors, including both long-term (LT-HSC) and short-term (ST-HSC) clonal progenitors with different degrees of self-renewal potential.10 Up to 22% of KTLS cells in young adult mice are in the S/G2/M phases of the cell cycle,12 but only 2% to 4% of the LT-HSC subset are in S/G2/M.10
We characterized the cell-cycle status of KTLS cells from bone marrow (BM) by flow cytometric analysis of cells stained for DNA content with Hoechst 33342 dye. We found that the number of KTLS cells in BM was increased after 3 days of continuous HU treatment, and that these cells accumulated but were not synchronized in the mitotic phase of the cell cycle. The biologic activity of KTLS cells and subset populations was assessed by competitive reconstitution assays in lethally irradiated mice. After HU treatment, KTLS cells and G0/G1 Rh123lo and S/G2/M Rh123mid subsets generated multilineage blood cell progeny and sustained lymphopoiesis and myelopoiesis in vivo with high frequency. These results suggest that in vivo administration of HU may be useful to accumulate cycling HSCs for retroviral-mediated gene transfer and to “activate” HSCs that can engraft and sustain multiple lineages better than untreated HSCs.
MATERIALS AND METHODS
Mouse strains. The mouse strains C57BL/Ka (Thy-1.2, Ly-5.2), C57BL/Ka-Thy-1.1 (Thy-1.1, Ly-5.2), C57BL/6-Ly-5.1 (Thy-1.2, Ly-5.1), and C57BL/6-Thy-1.1-Ly-5.1 (Thy-1.1, Ly-5.1)13 were bred and maintained in the animal care facility at SyStemix. About 7- to 8-week-old mice were treated for HU before KTLS cell isolation.
In vivo HU treatment. To initiate a continuous infusion of HU, mice were injected intraperitoneally with HU (10 to 100 mg/kg body weight). These HU-treated mice were then anesthetized with a mixture of ketamine hydrochloride (50 mg/kg) and zylazine hydrochloride (25 mg/kg) and implanted with osmotic minipumps (Alza, Palo Alto, CA) containing either HU (10 to 100 mg/kg/d) or, as a control, phosphate-buffered saline (PBS) with 1% human serum albumin.
Purification of KTLS cells. To isolate KTLS cells, mice were killed to obtain the long bones (two femurs and two tibias per mouse) 1, 3, or 5 days after initiation of HU treatment. BM cells were obtained by flushing the long bones with PBS containing 2% fetal calf serum ([PBS/FCS] Hyclone Laboratory, Logan, UT). KTLS cells were stained and isolated from BM as described previously.8 10 Antibodies used to remove cells that expressed lineage markers included the following: RA3-6B2 for the B-lineage marker B220; RM.-5 (CD2), GK. 1.5 (CD4), 53-7.3 (CD5), and 53.6.72 (CD8) for T-cell markers; RB6-8C5 (GR-1) and M1/70.15.11.5 (Mac-1) for myelomonocytic markers; and TER-119 for erythrocytes. Antibodies specific for the lineage markers were obtained from Pharmingen (San Diego, CA) and were detected with phycoerythrin-conjugated polyclonal anti-rat antibody (Caltag, South San Francisco, CA) with phycoerythrin-conjugated 145-2C11 (CD3) monoclonal antibody (mAb). The cells were incubated with biotinylated mAb specific for Sca-1. Sca-1+ cells were positively selected using the MACS magnetic bead system (Miltenyl Biotec, Auburn, CA). The positively selected cells were stained with fluorescein-conjugated 19XE5 mAB (Thy-1.1), allophycocyanin-conjugated 2B8 mAb (c-kit), and streptavidin-Texas Red (BioMeda, Foster City, CA). The cells were incubated for 20 minutes on ice for each step. After the final wash, cells were resuspended in a PBS/FCS buffer that contained propidium iodide (1 μg/mL) to discriminate between viable and nonviable cells. KTLS cells were analyzed and sorted by a FACS Vantage (Becton Dickinson Immunocytometry Systems, San Jose, CA). Dead cells were identified by characteristic propidium iodide staining and excluded from analysis. After sorting, the purity of KTLS cells was reanalyzed by flow cytometry.
Hoechst 33342 staining for analysis of cell cycle. The sorted KTLS cells were resuspended in PBS containing 2% FCS (≤106 cells/mL) and incubated with Hoechst 33342 (10 μmol/L; Molecular Probes, Eugene, OR) at 37°C for 1 hour. Verapamil (50 to 100 μmol/L; Sigma, St Louis, MO) was added to the mixture to ensure that Hoechst 33342 would not be effluxed. We analyzed cells treated with or without verapamil and found that the efflux of the Hoechst dye was minimal regardless of whether verapamil was present.
Rhodamine 123 and Hoechst 33342 staining. A stock solution of Rhodamine 123 ([Rh123] 1 mg/mL ethanol; Molecular Probes) was prepared just before use and stored at −20°C in the dark. The sorted KTLS cells were resuspended in PBS/FCS (≤106 cells/mL) and incubated with Rh123 (0.2 μg/mL) for 30 minutes at 37°C. The cells were washed and incubated with Hoechst 33342 (10 μmol/L; Molecular Probes) at 37°C for 60 minutes to simultaneously allow DNA labeling of the Hoechst dye and efflux of the Rh123 dye.
Flow cytometric analyses for Rh123 and Hoechst 33342 staining. Dual-laser flow cytometric analyses were performed on a FACStar Plus (Becton Dickinson Immunocytometry Systems). Argon ion lasers were used as primary and secondary excitation sources emitting 200 mW of the 488-nm line and 50 mW of the 360-nm line, respectively. Light scattered at forward and orthogonal angles was amplified and measured through 488-nm band-pass filters. Rh123, propidium iodide, and Hoechst 33342 linked fluorescence emissions were measured using 525/30-, 630/20-, and 424/40-nm band-pass filters, respectively. Light scatter and Hoechst fluorescence signals were amplified linearly, and Rh123 and propidium iodide fluorescence signals were amplified logarithmically.
In vitro culture of purified KTLS cells. To test the effect of HU on cell-cycle progression of KTLS cells in vitro, KTLS cells were purified as already described. Sorted KTLS cells were cultured in 96-well round-bottom plates (∼5,000 cells/well) in the presence of mouse interleukin-6 ([IL-6] 10 ng/mL), mouse Steel factor (100 ng/mL), and human thrombopoietin ([TPO] 100 ng/mL) cytokines with or without HU (100 μg/mL). The medium consisted of 50% Iscove's modified Dulbecco's medium (JRH Bioscience, Lenexa, KS), 50% RPMI with 10% FCS, 2-mercaptoethanol (40 μmol/L), 1 mmol/L sodium pyruvate, 50 U/mL penicillin-streptomycin, and 2 mmol/L glutamine (JRH Bioscience). After 24 hours of culture, the cells were harvested and stained with Hoechst 33342 (10 μmol/L) and verapamil (25 μmol/L) at 37°C for 1 hour. One set of KTLS cells cultured with cytokines and HU for 24 hours was washed to remove HU and cultured for an additional 24 hours in the presence of cytokines. They were subsequently stained with Hoechst 33342 for analysis.
Long-term competitive reconstitution assays. For competitive reconstitution assays, cells for individual injections were prepared in wells of 96-well plates as follows. BM cells from nonirradiated host Ly-5 congenic strains were harvested, resuspended at a concentration of 106 cells/mL, and plated at a 120 μL vol/well of 96-well flat-bottom plates. The sorted KTLS cells or subsets of these cells were further sorted by an automated cell deposition unit into 96-well flat-bottom plates containing the host congenic BM cells. Cells were prepared with 20% extra volume. For example, 12 KTLS cells were deposited into wells with 120 μL to obtain 10 KTLS cells for injection per 100 μL.
Recipient mice were lethally irradiated with a total dose of 1,100 rads in a split dose with a 3-hour interval. A limited dilution of sorted KTLS cells and a subset of KTLS cells (∼0.83 to 100 cells/mouse) along with 105 host congenic Ly-5 BM cells were injected (100 μL/mouse) intravenously into the retro-orbital plexus of anesthetized mice. Injection was performed by aspirating cells (100 μL) from a 96-well plate with 0.5-mL insulin syringes (Becton Dickinson, Franklin Lakes, NJ). Syringes were rinsed in PBS between injection.
Peripheral blood analysis. To evaluate the level of reconstitution, blood samples were monitored for donor-marked cells by four-color immunofluorescence staining and flow cytometry. Peripheral blood was obtained once every 4 weeks from the retro-orbital sinus, and red blood cells were lysed by a 5- to 10-minute incubation in the ammonium chloride lysing buffer (SyStemix). Samples were stained with mAbs specific for B cells (anti-B220), myeloid cells (anti-Gr-1 and anti-Mac-1), T cells (anti-CD3, mAb 2C11), and specific allelic markers (anti-Ly-5.2, antibody AL-4A2, or anti-Ly-5.1, antibody A20.1) to distinguish between cells of host or donor origin.
RESULTS
HU is a reversible inhibitor of the G1 → S transition in purified KTLS cells activated by SLF, IL-6, and TPO in vitro. Before treating mice with HU, we tested the effect of HU on purified KTLS cells in vitro. KTLS cells were isolated from the BM of normal mice, cultured with and without HU, and stained with the vital dye Hoechst 33342 to evaluate the cell-cycle status. After 24 hours in culture, untreated KTLS cells remained small and did not progress to the S phase of the cell cycle without cytokines (Fig 1a), while the majority of KTLS cells enlarged and progressed to the S/G2/M phases in the presence of SLF, IL-6, and TPO (Fig 1b). Virtually all KTLS cells incubated with HU in the same cytokine combination became enlarged, possibly signifying a G0 → G1 transition, but were blocked from entering S phase (Fig 1c). The inhibitory effect was reversible: when the cells were washed to remove HU from the culture medium, the majority of cells progressed into S/G2/M phases of the cell cycle (Fig 1d). Thus, the effect of HU on KTLS cells in vitro appears to be reversible.
Cell-cycle analysis of purified murine KTLS cells after HU treatment in vitro. KTLS cells were isolated from BM and cultured for 24 hours with (a) no cytokines (72% viable), (b) the cytokines IL-6, SLF, and TPO (95% viable), (c) HU (100 μg/mL) and cytokines (78% viable), or (d) HU (100 μg/mL) and cytokines, and then cells were washed to remove HU and cultured with cytokines for another 24 hours (92% viable). FACS plots display Hoechst 33342 staining forward scatter. The percentage of cells in G0/G1 or S/G2/M is indicated at the left or right of each FACS plot, respectively. About 6% of KTLS cells were in the S/G2/M phases before culture initiation. During this experiment, the fine-gain setting of forward-scatter measurement was normalized using calibration beads.
Cell-cycle analysis of purified murine KTLS cells after HU treatment in vitro. KTLS cells were isolated from BM and cultured for 24 hours with (a) no cytokines (72% viable), (b) the cytokines IL-6, SLF, and TPO (95% viable), (c) HU (100 μg/mL) and cytokines (78% viable), or (d) HU (100 μg/mL) and cytokines, and then cells were washed to remove HU and cultured with cytokines for another 24 hours (92% viable). FACS plots display Hoechst 33342 staining forward scatter. The percentage of cells in G0/G1 or S/G2/M is indicated at the left or right of each FACS plot, respectively. About 6% of KTLS cells were in the S/G2/M phases before culture initiation. During this experiment, the fine-gain setting of forward-scatter measurement was normalized using calibration beads.
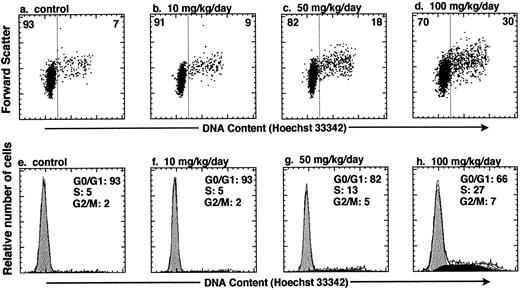
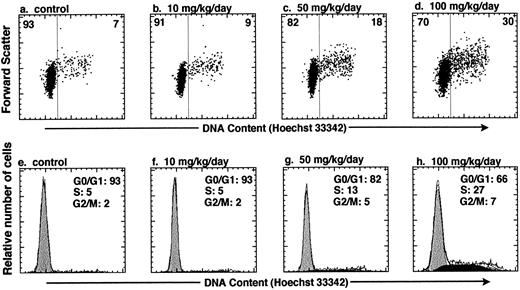
In vivo administration of HU increases the number of KTLS cells that are actively cycling in the BM of treated mice. To test whether HU can be used to affect the cell-cycle status of HSCs in vivo, we varied the HU dose and dose duration within a subtoxic range of concentrations.14 KTLS cells isolated from the BM of PBS-treated controls and HU-treated mice were stained with Hoechst 33342. We measured the total number of KTLS cells in the four long bones (tibiae and femora), which represent about 15% of mouse BM. Table 1 summarizes the number or percent of KTLS cells and the percentage of actively cycling KTLS cells from mice that were infused with HU (10, 50, or 100 mg/kg/d) for 1, 3, or 5 days. At day 1, there was not a significant change in the number of KTLS cells in cycle (ie, cells in S/G2/M phases). When the mice were treated for 3 days, the total number of BM cells decreased to about 59% of the control level with a dose of 100 mg/kg/d. Paradoxically, at the 50-mg and especially the 100-mg dose, the number of KTLS cells increased about threefold, and the percentage of KTLS cells in S/G2/M-phases of the cell cycle increased from 7.3% (PBS-treated group) to 22.2% at the 100-mg dose (Table 1). In addition, more KTLS cells were in the S/G2/M phases when mice were treated with HU for 3 days versus 1 or 5 days. The highest proportion of KTLS cells accumulated in S phase after 3 days with the 100-mg/kg/d dose of HU (Fig 2). In this particular experiment, based on DNA content modeling, about 27% of KTLS cells were in the S phase and 7% were in the G2/M phases of the cell cycle after the 100-mg/kg/d HU treatment, as compared with 5% in S phase and 2% in G2/M phases in the controls (Fig 2h v e). There were about 1.8 × 10³ KTLS cells in the S/G2/M phases in the four long bones of control mice, versus 1.3 × 10⁴ KTLS cells in HU-treated mice (100 mg/kg for 3 days; Table 1). However, when mice were treated for 5 days, we observed a significant decrease in the proportion of KTLS cells in the S/G2/M phases; the duration of HU treatment was probably too long to recover the maximum number of KTLS cells in active cell-cycle phases. For the subsequent study, we chose 100 mg/kg/d HU for 3 days as the optimal dose because significant numbers and proportions of KTLS cells accumulated into the S/G2/M phases of the cell cycle.
In vivo administration of HU results in accumulation of KTLS cells in the S/G2/M phases of the cell cycle. Mice were treated with HU (10, 50, or 100 mg/kg/d) for 3 days. The cell-cycle status of KTLS cells from HU-treated mice was examined by sorting KTLS cells from BM and staining with Hoechst 33342 for analysis of DNA content. FACS plots display Hoechst 33342 staining v forward scatter (a to d). The percentage of cells in G0/G1 or S/G2/M is indicated at the left or right of each FACS plot, respectively. (e and f ) Cells in G0/G1, S, and G2/M phases of the cell cycle were determined by DNA histogram modeling using ModFit (Verity Software House, Topsham, ME). Note that the calibration for the forward-scatter setting is different from the one used in Fig 1.
In vivo administration of HU results in accumulation of KTLS cells in the S/G2/M phases of the cell cycle. Mice were treated with HU (10, 50, or 100 mg/kg/d) for 3 days. The cell-cycle status of KTLS cells from HU-treated mice was examined by sorting KTLS cells from BM and staining with Hoechst 33342 for analysis of DNA content. FACS plots display Hoechst 33342 staining v forward scatter (a to d). The percentage of cells in G0/G1 or S/G2/M is indicated at the left or right of each FACS plot, respectively. (e and f ) Cells in G0/G1, S, and G2/M phases of the cell cycle were determined by DNA histogram modeling using ModFit (Verity Software House, Topsham, ME). Note that the calibration for the forward-scatter setting is different from the one used in Fig 1.
The productive life span of donor-marked transplanted KTLS cells isolated from BM of HU-treated mice. To evaluate the functional activity of HSCs from HU-treated mice, we performed limiting dilution competitive reconstitution assays to determine if KTLS cells or primitive KTLS subsets were in fact biologically active stem cells. To isolate primitive KTLS subsets, the combination of Rh123 and Hoechst 33342 was used. The Rh123 dye-retention profile has been used to isolate primitive hematopoietic progenitors and stem cells in both the mouse and the human.15-22 The low retention levels of Rh123 dye result from facilitated efflux of the hydrophobic dye by transporters such as p-glycoprotein-1, the product of the multidrug resistance gene,23,24 and/or activity of the mitochondria.24-26 The Rh123lo KTLS fraction is almost exclusively contained in G0/G1 (Fig 3, box I) and is believed to be mainly primitive HSCs.12,21,22 25
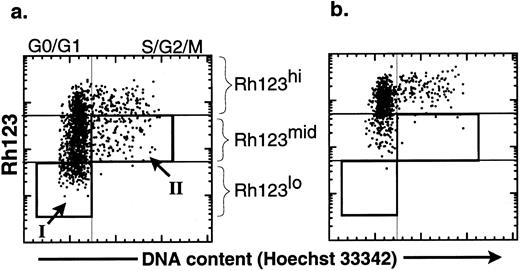
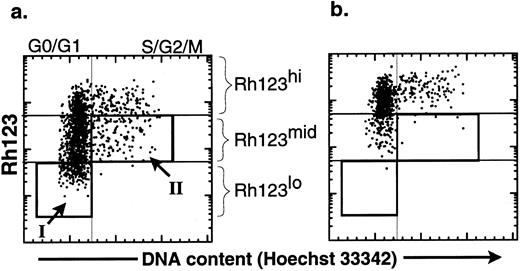
Comparison of the effect of verapamil on the cell-cycle status of KTLS cells isolated from BM of HU-treated mice. KTLS cells were isolated from BM of HU-treated mice (100 mg/kg/d for 3 days) and stained with Rh123 and Hoechst 33342 to determine the cell-cycle status of KTLS subsets. FACS plots of the purified HSCs show Hoechst 33342 staining v rhodamine staining (a) without and (b) with verapamil. Verapamil inhibited the efflux of Rh123. The boxes show populations that were purified for further analysis: (I) G0/G1 Rh123lo and (II) S/G2/M Rh123mid (these cells in S/G2/M have the ability to efflux Rh123 dye). G0/G1 Rh123lo cells represent about 15% to 18% of KTLS cells, while S/G2/M Rh123mid cells represent 4% to 8% of KTLS cells.
Comparison of the effect of verapamil on the cell-cycle status of KTLS cells isolated from BM of HU-treated mice. KTLS cells were isolated from BM of HU-treated mice (100 mg/kg/d for 3 days) and stained with Rh123 and Hoechst 33342 to determine the cell-cycle status of KTLS subsets. FACS plots of the purified HSCs show Hoechst 33342 staining v rhodamine staining (a) without and (b) with verapamil. Verapamil inhibited the efflux of Rh123. The boxes show populations that were purified for further analysis: (I) G0/G1 Rh123lo and (II) S/G2/M Rh123mid (these cells in S/G2/M have the ability to efflux Rh123 dye). G0/G1 Rh123lo cells represent about 15% to 18% of KTLS cells, while S/G2/M Rh123mid cells represent 4% to 8% of KTLS cells.
In addition to G0/G1 Rh123lo KTLS, we wanted to evaluate the biologic activity of HSCs in active cell-cycle status (ie, >2n cells in S/G2/M cell cycle). It has been shown that KTLS in the S/G2/M phases from normal BM were relatively inefficient in vivo in radioprotection and LTMR assays.12 To isolate primitive HSCs in S/G2/M phases, we further isolated KTLS cells that were in the S/G2/M phases of the cell cycle and could efflux the Rh123 dye. The ability to efflux Rh123 was demonstrated by the disappearance of the Rh123lo subset when incubated in the presence of verapamil, which inhibits efflux of the Rh123 dye (Fig 3b). Some KTLS cells in the S/G2/M phases were Rh123mid (Fig 3a, box II), and these redistributed from Rh123mid (Hoechst staining analysis >2n) to Rh123hi in the presence of verapamil.
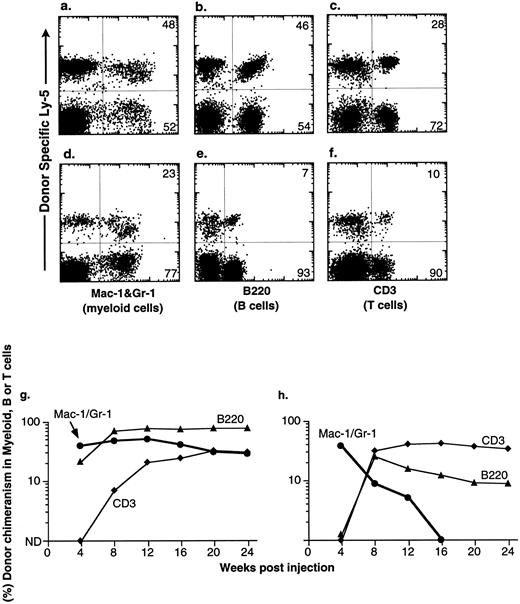
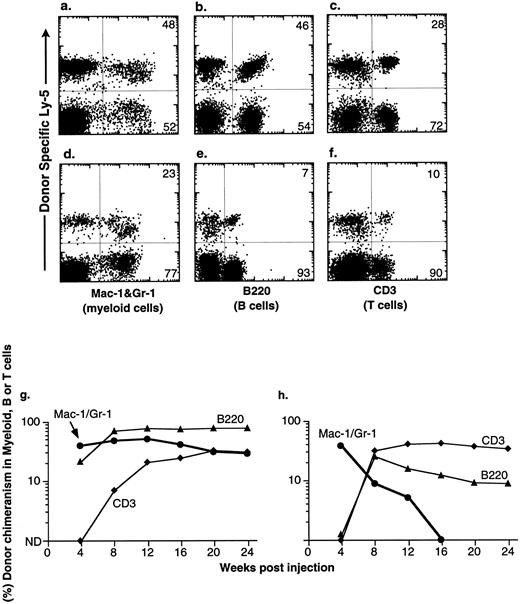
Congenic C57BL mice were lethally irradiated for the competitive repopulation assay, and donor KTLS cells (either Ly-5.1 or Ly-5.2) or subsets of KTLS cells were injected into congenic host mice along with host-type BM cells (either Ly-5.2 or Ly-5.1, 105 cells). Since the donor and the recipient mouse expressed different alleles of the hematopoietic cell surface marker Ly-5 (CD45), the progeny of donor-derived blood cells could be detected with mAbs that recognize Ly-5.1 or Ly-5.2. Peripheral blood cells were analyzed every 4 weeks for up to 6 months. Mice that had greater than 1% of donor-derived cells in the myeloid-, B-, or T-cell lineages were scored as positive chimeras (Fig 4). Figure 4 shows peripheral blood cell analysis of mice reconstituted with 10 KTLS (Fig 4a to c) or 10 S/G2/M Rh123mid KTLS cells (Fig 4d to f ) from HU-treated mice, which were reconstituted with donor-derived myeloid cells, B cells, and T cells at 24 weeks.
Production of B-cell, T-cell, and myeloid lineages by donor-marked KTLS cells isolated from BM of HU-treated mice. KTLS cells and subsets of KTLS cells were isolated from mice treated with HU (100 mg/kg/d) for 3 days. Host mice were lethally irradiated and reconstituted with 105 recipient-type BM cells and 10 KTLS cells (top FACS plots) or 10 S/G2/M Rh123mid KTLS cells (bottom FACS plots). Cells that arise from donor KTLS expressed a donor-specific Ly-5 allele. Six months later, peripheral blood was obtained and analyzed for donor-specific myeloid lineages (Mac-1 and Gr-1), B cells (B220), or T cells (CD3). The percentage of a lineage-specific Ly-5+ population that originated from donor KTLS cells is indicated in the upper right corner of each plot. Anti-B220 staining was suboptimal in 1 experiment (e) compared with the typical staining profile (b). The percent of donor-type B cells (B220, ▴), T cells (CD3, ♦), and myeloid cells (Mac-1 and Gr-1, •) in the peripheral blood was assessed monthly for 6 months. Two examples of multilineage reconstitution with 10 Ly-5–marked KTLS cells are shown: (g) an example of the long-term production of B cells, T cells, and myeloid cells, and (h) an example of multilineage reconstitution with transient myelopoiesis. Myeloid cells have a short life span and therefore are a good indicator of continuous hematopoiesis originating from donor HSCs.
Production of B-cell, T-cell, and myeloid lineages by donor-marked KTLS cells isolated from BM of HU-treated mice. KTLS cells and subsets of KTLS cells were isolated from mice treated with HU (100 mg/kg/d) for 3 days. Host mice were lethally irradiated and reconstituted with 105 recipient-type BM cells and 10 KTLS cells (top FACS plots) or 10 S/G2/M Rh123mid KTLS cells (bottom FACS plots). Cells that arise from donor KTLS expressed a donor-specific Ly-5 allele. Six months later, peripheral blood was obtained and analyzed for donor-specific myeloid lineages (Mac-1 and Gr-1), B cells (B220), or T cells (CD3). The percentage of a lineage-specific Ly-5+ population that originated from donor KTLS cells is indicated in the upper right corner of each plot. Anti-B220 staining was suboptimal in 1 experiment (e) compared with the typical staining profile (b). The percent of donor-type B cells (B220, ▴), T cells (CD3, ♦), and myeloid cells (Mac-1 and Gr-1, •) in the peripheral blood was assessed monthly for 6 months. Two examples of multilineage reconstitution with 10 Ly-5–marked KTLS cells are shown: (g) an example of the long-term production of B cells, T cells, and myeloid cells, and (h) an example of multilineage reconstitution with transient myelopoiesis. Myeloid cells have a short life span and therefore are a good indicator of continuous hematopoiesis originating from donor HSCs.
At the clonal level, the productive life span of multipotent HSCs can be measured by the production of donor-derived myeloid cells; since the blood granulocyte life span is 1 day or less, they are a good indicator of continuous hematopoiesis. It was shown previously that the disappearance of donor-derived myeloid cells correlated with a loss of grafted donor HSC activity.10,27 28 The majority of engrafted KTLS clones cease myeloid production at 8 to 12 weeks (STMR). Occasional KTLS clones sustained myelopoiesis for more than 12 weeks but disappeared at or before 20 weeks. Some KTLS clones sustained myelopoiesis (LTMR). Examples of LTMR and STMR clones are shown in Fig 4g and h, respectively.
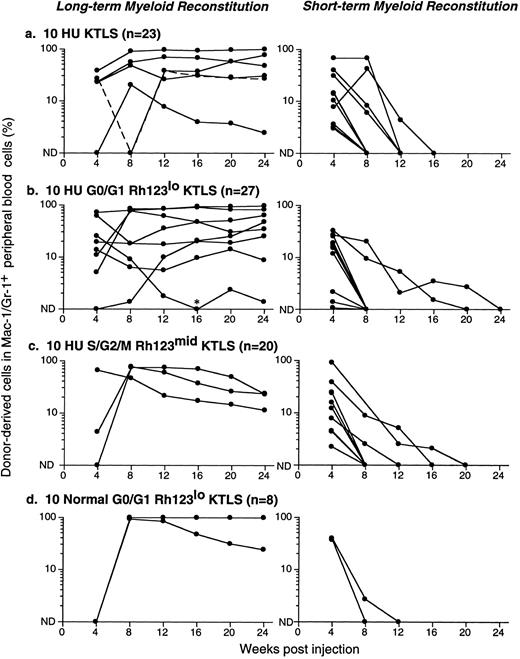
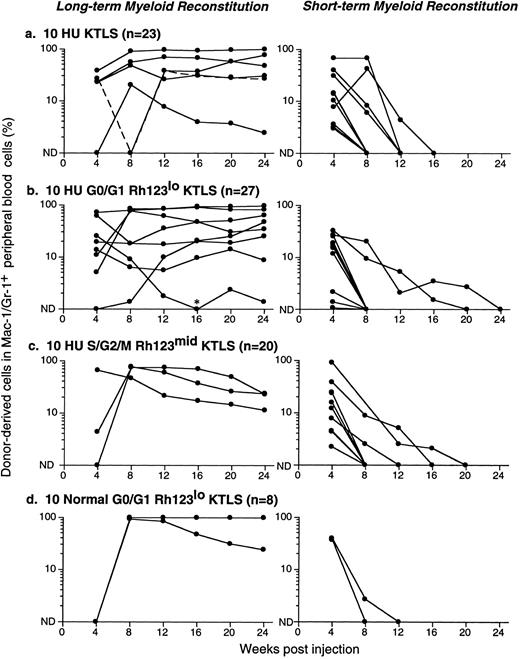
Figure 5 shows results from a number of reconstitution assays: LTMR clones are shown on the left and STMR clones on the right. Data from 10 KTLS cells, 10 G0/G1 Rh123lo KTLS cells, and 10 S/G2/M Rh123mid KTLS cells isolated from HU-treated mice are shown in Fig 5a, b, and c, respectively. Results from 10 G0/G1 Rh123lo KTLS cells from normal mice are shown in Fig 5d. It is clear that KTLS cells and their subsets from HU-treated donors were capable of contributing to both LTMR and STMR. Dose-response analyses for KTLS cells from normal and HU-treated donors are shown in Table 2. In all cases, cell doses of 20 to 50 KTLS cells, whether from normal or HU-treated mice, gave rise to mainly LTMR, with the remainder producing STMR. These results were independent of Rh123 and cell-cycle staining status.
Productive life span of donor-marked KTLS cells and KTLS subsets isolated from BM of HU-treated mice. Recipient mice were lethally irradiated and reconstituted with 105 recipient-type BM cells and (a) 10 KTLS cells, (b) 10 G0/G1 Rh123lo KTLS cells, or (c) 10 S/G2/M Rh123mid KTLS cells isolated from HU-treated mice (100 mg/kg/d for 3 days). One group of mice received (d) 10 G0/G1 Rh123lo KTLS cells from untreated mice as a control. The number of mice reconstituted with given populations is indicated. The percent of donor-derived myeloid cells in peripheral blood was assessed monthly for 6 months. Each line represents consecutive samples of peripheral blood taken from a single mouse. *Low but significant levels of donor-derived myeloid cells were detected in this chimera at week 16.
Productive life span of donor-marked KTLS cells and KTLS subsets isolated from BM of HU-treated mice. Recipient mice were lethally irradiated and reconstituted with 105 recipient-type BM cells and (a) 10 KTLS cells, (b) 10 G0/G1 Rh123lo KTLS cells, or (c) 10 S/G2/M Rh123mid KTLS cells isolated from HU-treated mice (100 mg/kg/d for 3 days). One group of mice received (d) 10 G0/G1 Rh123lo KTLS cells from untreated mice as a control. The number of mice reconstituted with given populations is indicated. The percent of donor-derived myeloid cells in peripheral blood was assessed monthly for 6 months. Each line represents consecutive samples of peripheral blood taken from a single mouse. *Low but significant levels of donor-derived myeloid cells were detected in this chimera at week 16.
To quantify engraftment frequency, linear regression analysis was performed on the reconstitution results summarized in Table 2. Table 3 shows the frequency of KTLS cells and KTLS subsets that contribute to engraftment (including LTMR, STMR, and single lineages) and LTMR alone. In contrast to the engraftment frequency of Thy-1.1loLin−/loSca-1+ cells from normal mice (one in 13 to 16),27 28 the frequency of engraftment of G0/G1 Rh123lo KTLS cells from normal mice is one in seven; about 30% of these clones yielded LTMR. In both the KTLS and the G0/G1 Rh123lo subset from HU-treated mice, about one in five cells injected contributed to blood cell production. S/G2/M Rh123mid KTLS cells from HU-treated mice displayed an engraftment frequency of about one in six cells. About 15% of KTLS clonal reconstitutions from HU-treated donors were LTMR, while about 25% of G0/G1 Rh123lo and 10% of S/G2/M Rh123mid clonal reconstitutions from HU-treated donors were of the LTMR type. Taken together, HU treatment of mice at 100 mg/kg/d for 3 days before BM harvest results in an increased frequency of KTLS cells that are at least as active on a per-cell basis as their KTLS counterparts from normal mice in terms of both engraftment efficiency and the fraction of clones that could contribute LTMR.
DISCUSSION
In this study, we wished to test whether continuous HU treatment could synchronize HSCs at the G1/S boundary. As predicted, in vitro HU treatment of isolated KTLS cells prevented these cells from progressing through the cell cycle beyond the G1/S boundary, and this effect was reversible. Surprisingly, in vivo HU treatment allowed BM KTLS cells to increase in number about threefold and to show increased cell-cycle activity. This would not be expected if the effect of HU on KTLS cells was simply to block the G1 → S transition, and in fact HU treatment did not result in these cells being in a particular synchronized phase of the cell cycle. When KTLS cells were isolated 3 days following administration of 100 mg/kg/d HU, increased numbers of KTLS cells had progressed into the cell cycle; about an eightfold increase of the number of KTLS cells in the S/G2/M phases (1.3 × 10⁴ KTLS cells) was observed compared with the control group (1.8 × 10³ KTLS cells). Perhaps the cytoreductive effect of HU on BM cells may have triggered a proliferative KTLS response. HU toxicity to most BM cells is likely to result from activation of programed cell death by cells trapped for too long in the S/G2/M phases of the cell cycle. It is also possible that similar results could be observed using other drugs that allow accumulation of cells in the G1 or G1/S phases.
The concept that HU could be used to synchronize cells in the cell cycle in vitro29 and in vivo30,31 has been tested, including experiments wherein the behavior of progenitors and HSCs was tested by analyzing CFU-S, marrow repopulating ability, or day 28 cobblestone-area–forming cells.32-36 The results of attempts to use HU as either a synchronizing drug or a drug that kills cycling cells are difficult to compare because the dose, duration, interval between treatments, mouse strains, and stem cell assays differ greatly between experiments.32,33 36 It should be pointed out that HU and perhaps (by extrapolation) other low-toxicity cell-cycle inhibitors could provide a relatively nontoxic procedure for increasing both the HSC number and the fraction that is induced or retained in the mitotic phase of the cell cycle. It shall be important to identify an appropriate cell-cycle blocker where the effects are reversible and have no toxicity to HSCs when used in vivo.
Remarkably, KTLS subsets isolated from HU-treated mice retained their HSC biologic activity as demonstrated by competitive reconstitution assays. The population of KTLS cells, as well as their subsets, the G0/G1 Rh123lo and S/G2/M Rh123mid KTLS cells, were able to efficiently reconstitute mice with multiple blood cell lineages. In this study, about one in five KTLS cells isolated from HU-treated mice contributed to blood cell production, while one in seven engrafted clones provided LTMR. These engraftment frequencies were much higher than the historical data, where engraftment frequencies of 1 in 13 to 16 transplanted Thy-1.1loLin−/loSca-1+ cells could contribute to blood cell production, while 1 in 5 to 10 engrafted clones provided LTMR.27,28 It is possible that improvements in the isolation and/or handling of mouse HSCs contributed to improved engraftment efficiencies (eg, inclusion of c-kit mAbs increases the purity9,10 ). Since the number of KTLS cells in BM increases after HU treatment, one can speculate that the total LTMR activity from BM can be increased with this conditioning. It shall be of interest to test whether HU treatment triggers an activation of HSCs so that they “home” to appropriate hematopoietic microenvironments more effectively. Nevertheless, the G0/G1 Rh123lo fraction contains HSCs with the greatest proliferative and self-renewal potential. While the S/G2/M Rh123mid fraction is less able to sustain long-term proliferation, this may be explained by a commitment of many of these cells, like other transient HSCs,12 to self-renew less and differentiate faster, ie, differential homing to long-term hematopoietic microenvironments.37
If these results from mouse HSCs reflect a similar potential in human HSCs, there are a number of potential therapeutic opportunities that could result from “conditioning” of HSC donors with HU. HU is a relatively inexpensive drug that has been a human pharmaceutical for decades. Also, since in vivo treatment with HU enriches the BM for HSCs, it may prove useful to increase the available number of BM stem cells for transplantation; these accumulated and/or “activated” HSCs can engraft and sustain multilineages better than HSCs from untreated donors. Currently, high doses of cyclophosphamide (CTX) are used widely as a component of chemotherapy-cytokine mobilization treatment for cancer patients. Unlike HU, treatment of mice with CTX 200 mg/kg resulted in about a 1-log depletion of BM and KTLS cells 3 days after CTX injection. As early as 4 days post-CTX injection, immediate expansion of BM KTLS cells is seen (Uchida N, unpublished observation, December 1995). A similar transient reduction of HSCs followed by expansion is also observed when mice are treated with 5-fluorouracil.38 39 It will be of interest to determine whether HU can act alone or with cytokines not only to expand but also to “mobilize” HSCs into the peripheral blood.
Since HU has the ability to accumulate and/or recruit stem cells into the S/G2/M phases of the cell cycle, HU treatment may be used to prime stem cells as targets of gene therapy. Cycling cells are more receptive to gene targeting,40,41 presumably because at mitosis the nuclear membrane breaks down and the introduced genes have access to the chromatin. Finally, since patients with sickle cell anemia lack a normal β-globin gene and may already receive HU as a treatment to induce nonsickling fetal γ-hemoglobin,42 this may provide an ideal disease model to test the efficacy of HU for the priming of HSCs for gene replacement therapy.
ACKNOWLEDGMENT
We thank Dr A. Schlageter for helping in the preparation and review of the manuscript. We also thank the SyStemix Comparative Medicine, Animal Care, and Flow Cytometry departments. We are grateful to Drs Michael Cooke, Richard Rigg, and Roland Scollay for stimulating discussions and reviewing the manuscript, and to L. Osborne and B. Ford for technical support.
Address reprint requests to Nobuko Uchida, PhD, SyStemix Inc, 3155 Porter Dr, Palo Alto, CA 94304.


