Abstract
Macrophage inflammatory protein-1 (MIP-1) can stimulate growth inhibitory and potent chemotactic functions in hematopoietic cells. To investigate whether the action of MIP-1 may be regulated at the cellular receptor level, we studied the expression and modulation of MIP-1 receptors on CD34+ cells isolated from normal bone marrow (NBM), umbilical cord blood (CB), and leukapheresis products (LP). Expression of MIP-1 receptors on CD34+cells was analyzed by two-color flow cytometry using a biotinylated MIP-1 molecule. The mean percentage of LP CD34+ cells expressing the MIP-1 receptors was 67.7 ± 7.2% (mean ± SEM; n = 22) as compared with 89.9 ± 2.6% (n = 10) and 74.69 ± 7.04% (n = 10) in CB and NBM, respectively (P = .4). The expression of the MIP-1 receptor subtypes on LP CD34+ cells was studied by indirect immunofluorescence using specific antibodies for the detection of CCR-1, CCR-4, and CCR-5. Microscopical examination revealed a characteristic staining of the cytoplasmic cell membrane for all three receptor subtypes. Detailed analysis of two LP samples showed that 65.8%, 4.4%, and 30.5% of CD34+ cells express CCR-1, CCR-4, and CCR-5, respectively. Culture of LP CD34+ cells for 24 to 36 hours in the presence of tumor necrosis factor- (TNF-) and interferon-γ (IFN-γ) resulted in a significant increase in MIP-1 receptor expression. TNF- induced MIP-1 receptor upregulation in a time- and concentration-dependent manner. Our results suggest that inhibitory cytokines produced by the bone marrow microenvironment are likely to be involved in the regulation of MIP-1 receptor expression on hematopoietic cells.
© 1998 by The American Society of Hematology.
THE PROLIFERATION OF hematopoietic cells is regulated by a balance between stimulatory and inhibitory signals normally provided by the bone marrow microenvironment. Over recent years, macrophage inflammatory protein-1α (MIP-1α), which is constitutively1 and inducibly2 produced by stromal macrophages and myoid cells3 and is a member of a family of closely related small (8 to 12 kD) proteins called chemokines,4-6 has been shown to inhibit cell cycling of primitive hematopoietic cells in vitro7,8 and in vivo.9-11 This chemokine affects the proliferative state of hematopoietic progenitor cells in a complex way depending on the origin12 and the maturational stage of the target cells.13
Chemokines elicit their effects on primitive hematopoietic cells via G-protein–coupled receptors, several of which have recently been cloned.14-17 MIP-1α has been shown to bind to at least three of these receptors, designated chemokine receptors CCR-1, CCR-4, and CCR-5.14-18 MIP-1α binding to these receptors is associated with transient elevations of intracellular calcium levels [Ca2+]i, which has been used as an indicator of receptor activation.18,19 The signal transduction pathways further downstream of the receptors have only been partially elucidated. Aronica et al20 showed that treatment of Mo7e cells with MIP-1α inhibits upregulation of Raf-1 kinase activity in response to granulocyte-macrophage colony-stimulating factor (GM-CSF) and stem-cell factor (SCF). The same authors recently reported that the chemokines, interferon-inducible protein 10 (IP-10) and MIP-1α, block the stimulatory effects of GM-CSF and SCF on MAP kinase activity in MO7e cells.21 Thus, it is possible that the variety of responses to MIP-1α is a reflection of both the receptor ligand interaction and the intracellular signaling cascades elicited as a consequence of ligand binding.
As the action of MIP-1α may be regulated at the cellular receptor level, we studied the expression and modulation of MIP-1α receptors in hematopoietic CD34+ cells. We show that CD34+ cells, from normal bone marrow, umbilical cord blood, and leukapheresis products, exhibit comparable receptor levels as determined by flow cytometric analysis of biotinylated MIP-1α binding to CD34+ cells. Furthermore, we demonstrate that CD34+ cells express the three MIP-1α–binding chemokine receptors CCR-1, CCR-4, and CCR-5 on their cytoplasmic cell membranes. MIP-1α receptor expression on the cell surface of CD34+cells was found to be associated with cell cycling and can be upregulated by the inhibitory cytokines tumor necrosis factor-α (TNF-α) and interferon-γ (IFN-γ).
MATERIALS AND METHODS
Cells.
Human umbilical cord blood (CB) samples were collected from full-term normal deliveries and normal bone marrow (NBM) samples were obtained from allogeneic BM donors. Leukapheresis products (LP) were obtained from 27 patients with hematological malignancies or solid tumours (12 multiple myeloma, 1 acute lymphoblastic leukemia, 1 acute myeloid leukemia, 4 teratoma, 1 sarcoma, 4 non-Hodgkin’s lymphoma, 2 breast cancer, 1 Hodgkin’s lymphoma, 1 chronic lymphocytic leukemia). To mobilize hematopoietic progenitor cells into the peripheral blood, all patients received appropriate cytotoxic chemotherapy followed by recombinant granulocyte colony-stimulating factor (G-CSF; Lenogastrim [Chugai Pharma, London, UK], 263 μg/d subcutaneously); leukapheresis was performed on these patients when the rising blood white cell count exceeded 3 × 10⁹/L. At the time of the leukapheresis, all patients were in remission. The median age was 48 years (range, 15 to 65 years). The female:male ratio was 12:15. All samples were obtained with informed consent. Samples were collected in sterile tubes containing preservative-free heparin, and the mononuclear cells (MNC) were isolated by centrifugation on Ficoll-Hypaque (Lymphoprep, 1.077 g/mL; Nycomed, Birmingham, UK) at 400g for 25 minutes. The MNC at the interface were collected and washed in phosphate-buffered saline (PBS) containing 0.5% (wt/vol) bovine serum albumin (BSA).
Isolation of CD34+ cells.
CD34+ cells from CB, NBM, and LP were isolated using the Mini-MACS immunomagnetic separation system (Miltenyi Biotec, Bergisch Gladbach, Germany) according to the manufacturer’s instructions. Briefly, 108 cells were suspended in 300 μL of sorting buffer (PBS supplemented with 5 mmol/L EDTA and 0.5% [wt/vol] BSA) and incubated with 100 μL human IgG FcR blocking antibody and 100 μL monoclonal microbead-conjugated CD34 antibody (clone QBEND/10; Miltenyi Biotec) for 30 minutes at 4°C. Thereafter, the cells were washed and passed through a 30-μm nylon mesh and separated in a column exposed to the magnetic field of the MACS device. The column was washed four times with sorting buffer (500-μL aliquots) and removed from the separator. The retained cells were eluted in 1 mL sorting buffer and counted using a hemocytometer.
Immunophenotypical analysis of MIP-1α receptor expression.
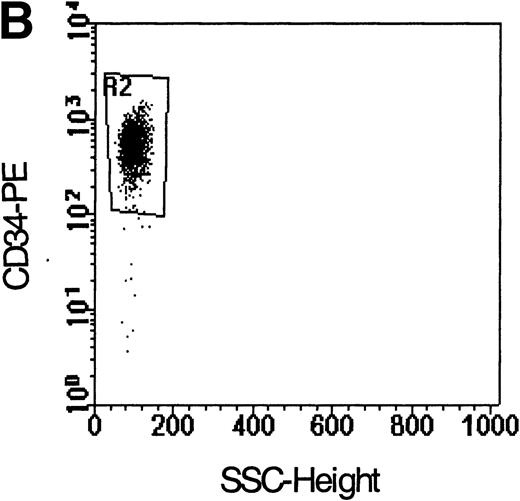
MIP-1α receptor expression on CD34+ cells was analyzed using the commercially available Fluorokine hu MIP-1α receptor kit (R&D Systems, Abingdon, UK) according to the manufacturer’s instructions. Briefly, MACS purified CD34+cells were washed and labeled with human MIP-1α biotin conjugate for 1 hour at 4°C. Avidin-fluorescein and directly-conjugated CD34-PE (HPCA-2; Becton Dickinson, Cowley, Oxon, UK) were added and the cell suspension was further incubated at 4°C for 30 minutes. Subsequently, the cells were washed and fixed in 1% (vol/vol) formaldehyde. Receptor expression was analyzed by flow cytometry in a uniformly set gate comprising lymphoblast-like cells expressing the CD34 antigen. Results are expressed as the percentage of MIP-1α receptor positive cells in the CD34+ cell population. The receptor density on these cells was assessed by determining the mean fluorescence intensity (MFI) for fluorescein isothiocyanate (FITC) in an identical gate (Fig 1). The specificity of the MIP-1α receptor labeling was tested using a blocking antibody (R&D Systems) in combination with MIP-1α biotin and using a nonspecific biotinylated protein (soybean trypsin inhibitor) as a negative control as described by the manufacturer. When tested on LP CD34+ cells, this blocking antibody reduced the number stained with the biotinylated MIP-1α to less than 1%. In some experiments, MIP-1α receptor–labeled cells were fixed in 70% (vol/vol) ethanol/PBS and stained with propidium iodide (Sigma, St Louis, MO) to analyze the cell cycle distribution of the different cell populations as previously described.22 Flow cytometric analysis was performed on a FACScan flow cytometer (Becton Dickinson) equipped with an Argon-Ion laser tuned at 488 nm within 24 hours of sample processing.
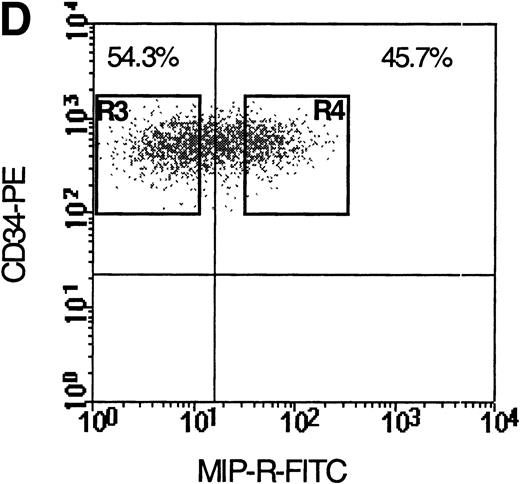
Flow cytometric analysis of isolated LP CD34+ cells from a representative experiment; two-color immunofluorescence staining with FITC-avidin-biotin-MIP-1 complex and PE-conjugated anti-CD34 monoclonal antibody. Control cells were stained with a nonspecific biotinylated protein (soybean trypsin inhibitor) and irrelevant mouse monoclonal conjugated to PE as described in Materials and Methods. Gates for the analysis of MIP-1 receptor expression on CD34+ are defined as shown: R1, lymphocyte gate (A); R2, CD34+ lymphocytes (B). MIP-1 receptor expression was assessed as mean fluorescence intensity (C) in R2 and percentage of positive cells (D). A negative control using a irrelevant biotinylated protein (shaded histogram) was used to set the quadrant such that at least 99% of the analyzed cells were negative for MIP-1 receptor. Sorting gates are indicated in (D): R3, CD34+MIP R−; R4, CD34+MIP R+, and were set to include a strongly negative and positive fraction, respectively.
Flow cytometric analysis of isolated LP CD34+ cells from a representative experiment; two-color immunofluorescence staining with FITC-avidin-biotin-MIP-1 complex and PE-conjugated anti-CD34 monoclonal antibody. Control cells were stained with a nonspecific biotinylated protein (soybean trypsin inhibitor) and irrelevant mouse monoclonal conjugated to PE as described in Materials and Methods. Gates for the analysis of MIP-1 receptor expression on CD34+ are defined as shown: R1, lymphocyte gate (A); R2, CD34+ lymphocytes (B). MIP-1 receptor expression was assessed as mean fluorescence intensity (C) in R2 and percentage of positive cells (D). A negative control using a irrelevant biotinylated protein (shaded histogram) was used to set the quadrant such that at least 99% of the analyzed cells were negative for MIP-1 receptor. Sorting gates are indicated in (D): R3, CD34+MIP R−; R4, CD34+MIP R+, and were set to include a strongly negative and positive fraction, respectively.
Fluorescence-activated cell sorter (FACS) sorting of CD34+ cells.
Immunomagnetically isolated CD34+ cells were sorted under sterile conditions into MIP-1α receptor positive and negative fractions using the Automatic Cell Deposition Unit (ACDU) on a FACS Vantage flow cytometer (Becton Dickinson). A total of 2 to 3 × 10³ cells of each fraction was plated in colony-forming assays and analyzed for the presence of colony-forming cells–granulocyte-macrophage (CFC-GM) and burst-forming unit–erythroid (BFU-E) as previously described.23
Immunophenotypical analysis of MIP-1α receptor subtypes.
Commercially available goat polyclonal antibodies against the MIP-1α binding chemokine receptors CCR-1, CCR-4, and CCR-5 (Santa Cruz Biotechnology, Santa Cruz, CA) were used to characterize the expression of MIP-1α receptor subtypes on CD34+ cells. Indirect immunofluorescent cell staining was performed as described by the manufacturer. Cells were washed and cytospin preparations were prepared. Cells were fixed in methanol at −10°C for 5 minutes and air dried. Nonspecific IgG binding was blocked by preincubating cells with human AB serum (1:200 dilution in PBS). Primary antibody (1 μg/mL) staining was performed for 1 hour followed by three washes with PBS. Thereafter, the secondary anti-goat IgG-FITC antibody (15 μg/mL; Autogen Bioclear, Calne, Wiltshire, UK) was added and incubated for 45 minutes. Slides were washed in PBS and cells were counterstained with DAPI and mounted in antifade solution (Vectashield; Vector, Brelton, Peterborough, UK) under glass cover-slips. Control slides were subjected to the same protocol, with the exception of substituting PBS for the primary antibody in the first incubation step. All incubations were performed in a humidified atmosphere at room temperature. Slides were viewed using a Zeiss Axioskop Fluorescent microscope (Oberkocken, Germany) equipped with single-band excitation filters for each fluorochrome mounted in a computer-controlled filter wheel. Grey levels were captured for each fluorochrome using a Photometrics (Tucson, AZ) charge-coupled device (CCD) camera, and final analysis and preparation of figures were performed using Vysis Quips software (Vysis, London, UK).
In two experiments we quantitated the chemokine receptor subtype expression on MACS purified CD34+ cells (purity >90%) using the same antibodies and a single-color flow cytometric approach. CD34+ cell suspensions were subjected to the same fixation and staining protocol as outlined for the cytospin preparations. FACS analyses were performed as described in the previous section.
Colony forming cell assays.
A total of 2 to 3 × 10³ sorted cells from each of the selected populations were plated as previously described.23Briefly, cells were added to a 1-mL mixture of 30% (vol/vol) fetal calf serum (FCS), 10% (wt/vol) deionized BSA, 10% (vol/vol) 5637-conditioned medium, 2 U erythropoietin, and 1.35% (wt/vol) methylcellulose. After thorough mixing, cells were plated in triplicate and incubated for 14 days at 37°C in 5% CO2 and 5% O2 in nitrogen. Colonies of granulocyte-macrophage cells (CFC-GM) or erythroid cells (BFU-E) were assessed using standard criteria after 14 days’ incubation.
Suspension cultures.
A total of 1 to 2 × 10⁵ CD34+ cells was cultured in 24-well flat-bottom plates in Iscove’s modified Dulbeccos medium (IMDM), 15% (vol/vol) FCS plus various concentrations of TNF-α (Sigma), 1,000 IU/mL IFN-γ, and 2.5 ng/mL (100 pmol/L) transforming growth factor-β (TGF-β; both from R&D Systems). Cells were incubated for 24 hours at 37°C in 5% CO2 and 5% O2 in nitrogen. At the end of the culture period cells were washed 2× in PBS, and viability was measured using the Trypan blue exclusion method. In four experiments, the kinetics of MIP-1α receptor expression in response to TNF-α (2 ng/mL) were studied by obtaining cultures after various time intervals and comparing the results to the time 0 baseline values.
Statistical analysis.
Data are expressed as mean ± SEM. Statistical significance was determined using the nonparametric Wilcoxon test for paired samples. The Kruskal Wallis test was used to compare differences in MIP-1α receptor expression between NBM, CB, and LP CD34+cells.
RESULTS
Purification of CD34+ cells.
The median purity of LP-derived CD34+cells was 82% (range 55% to 96%) after MiniMACS purification. The median numbers of processed MNC and CD34+ recovered were 2.2 × 10⁸ (range 6 × 10⁷ to 5 × 10⁸) and 2.7 × 10⁶ (range1.2 × 105 to 1 × 10⁷), respectively. The purity of CB and NBM CD34+ cell preparations was not routinely assessed but usually exceeded 80%, as determined by flow cytometry, and this was in agreement with our previous data.24 Cell viability following separation was always greater than or equal to 90%.
Two-color immunofluorescence analysis of CD34+ cells for MIP-1α receptor expression.
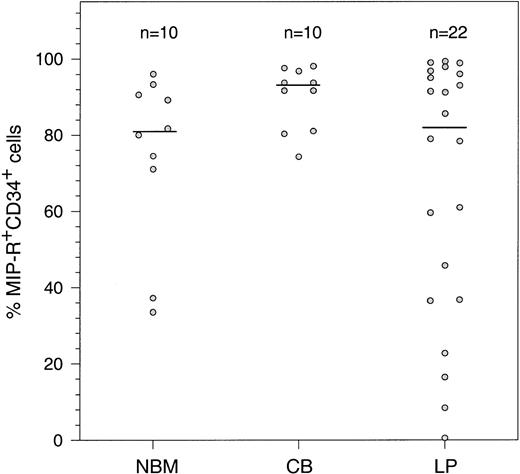
The coexpression of the CD34 antigen and MIP-1α receptors was assessed on cells isolated from LP, NBM, and CB. MIP-1α receptor expression was assessed as the percentage of MIP-R+ cells in the CD34+ population and MFI as described in Fig 1. The median percentage of CD34+ cells coexpressing the MIP-1α receptors (Fig 2) was higher in CB (range 74.2% to 98.1%) than in NBM and LP (range 33.5% to 96.0% and 0.5% to 99.4%, respectively), but this difference was not significant (P = .4). None of the patient characteristics including the quality of the apheresis product (CFC-GM and CD34+ cell content) and the extent or type of pretreatment with radio/chemotherapy appeared to correlate with MIP-1α receptor expression on the isolated CD34+ cells in the LP samples (data not shown).
Constitutive expression of MIP-1 receptors on human CD34+ cells isolated from NBM, CB, and LP. Purified CD34+ cells were double-stained with biotinylated MIP-1 and antibodies specific for the CD34 antigen. Results are expressed as the percentage of CD34+ cells coexpressing MIP-1 receptors. Horizontal bars denote the median of n individual determinations.
Constitutive expression of MIP-1 receptors on human CD34+ cells isolated from NBM, CB, and LP. Purified CD34+ cells were double-stained with biotinylated MIP-1 and antibodies specific for the CD34 antigen. Results are expressed as the percentage of CD34+ cells coexpressing MIP-1 receptors. Horizontal bars denote the median of n individual determinations.
Colony formation by MIP-1α receptor positive and negative CD34+ cells.
The colony forming potential of MIP-1α receptor positive (R+) and negative (R−) CD34+cells is shown in Table 1. In general, CFC-GM colony forming efficiency in the MIP-1α–R+ cell fraction exceeded those in the MIP-1α–R− fraction, but this difference was found to be significant only in LP CD34+ cells (P < .05). The BFU-E were more evenly distributed between the two fractions in all cell sources examined.
Cell cycle distribution of MIP-1α receptors in cytokine-stimulated CD34+ cells.
The cell-cycle distribution of ungated, MIP-1α receptor positive and negative cells is shown in Table 2. Significantly more MIP-1α–R+ than MIP-1α–R− cells were in S/G2/M phase (P < .05). Furthermore, the MIP-1α receptor density on cells in S/G2/M was significantly higher than in the G0/G1 population (MFI: 232.7 ± 50.9v 181.4 ± 39.8; n = 4, mean ± SEM, P < .05).
Characterization of MIP-1α receptor subtypes expressed by CD34+ cells.
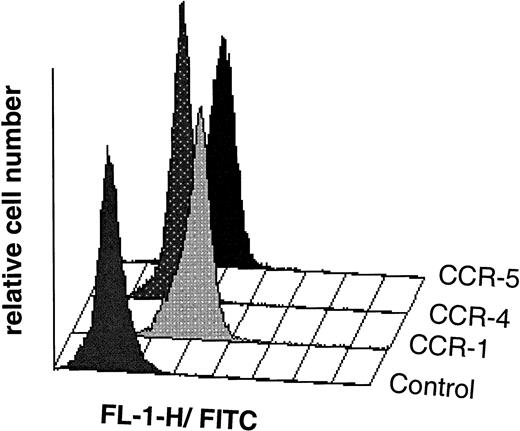
In some experiments CD34+ cells were spun onto slides and the expression of the MIP-1α binding chemokine receptors CCR-1, CCR-4, and CCR-5 was analyzed microscopically using indirect immunofluorescence. All three receptor subtypes were detected on LP CD34+ cells, and the staining showed a characteristic membrane-associated distribution. In a second series of experiments, we tried to quantify the coexpression of the MIP-1α receptor subtypes using highly purified CD34+ cells (purity >90% as analyzed by flow cytometry) and single-color flow cytometry. Table 3 summarizes the results, and Fig 3 shows an example of a representative experiment.
Flow cytometric analysis of isolated LP CD34+ cells (purity 98%) from a representative experiment; indirect single-color immunofluorescence staining was performed with specific antibodies raised against the human chemokine receptor subtypes CCR-1, CCR-4, and CCR-5 as described in Materials and Methods. Control cells were stained with secondary FITC-linked antibody only. Chemokine receptor expression was analyzed in a uniformly set lymphocyte gate comprising 20,375, 21,503, and 21,659 cells in the CCR-1, CCR-4, and CCR-5 experiments, respectively. Overlay plots of the histograms (cell number against MFI) for the different chemokine receptors and the control are shown.
Flow cytometric analysis of isolated LP CD34+ cells (purity 98%) from a representative experiment; indirect single-color immunofluorescence staining was performed with specific antibodies raised against the human chemokine receptor subtypes CCR-1, CCR-4, and CCR-5 as described in Materials and Methods. Control cells were stained with secondary FITC-linked antibody only. Chemokine receptor expression was analyzed in a uniformly set lymphocyte gate comprising 20,375, 21,503, and 21,659 cells in the CCR-1, CCR-4, and CCR-5 experiments, respectively. Overlay plots of the histograms (cell number against MFI) for the different chemokine receptors and the control are shown.
Effects of inhibitory cytokines on the expression of MIP-1α receptors.
To determine whether TNF-α, IFN-γ, and TGF-β could modulate MIP-1α receptor expression, LP CD34+ cells were cultured in the presence of these cytokines and subsequently analyzed by flow cytometry. Figure 4A and C shows that TNF-α significantly increased MIP-1α receptor expression on CD34+ cells in a time-dependent fashion with maximum stimulation observed after a 10-hour incubation period (2.1-fold MFI increase; P < .05) followed by a gradual decline. However, the MFI was still 1.3-fold over baseline values at 24 hours. In contrast, the control showed a time-dependent decrease in MIP-1α receptor expression with a reduction of MFI to 20.1 ± 7.4% (P < .05, mean ± SEM, n = 4) of baseline values at 24 hours. The differential kinetics of MIP-1α receptor expression was also reflected by the decreased percentages of MIP-1α–R+cells in the control but not in the TNF-α–treated cells (Fig 4B).
Time-dependent expression of MIP-1 receptors on LP CD34+ in short-term suspension culture. Cells were cultured at a concentration of 1 to 2 × 10⁵ cells in 1 mL of IMDM supplemented with 15% (vol/vol) FCS and incubated in 5% CO2 and 5%O2 in nitrogen for various time periods (4, 10, and 24 hours) in the absence or presence of TNF- (2 ng/mL). MIP-1 receptor expression was assessed by determining the mean fluorescence (A) and the percentage of CD34+ cells expressing MIP-1 receptors (B). (C) Shows a representative experiment. Overlay plots of the histograms (cell number against MFI) for the different cell populations at successive time-points are shown. T = 0 hours, empty area represents the untreated cell population stained for MIP-1 receptors (FITC). T = 10 hours and T = 24 hours, shaded and empty areas represent MIP-1 receptor expression in TNF-–treated and untreated cells, respectively. Data points in (A) and (B) are the mean ± SEM of four independent experiments. Nonspecific binding of avidin-FITC in TNF-–treated cultures was not increased over untreated cells at T = 0 hours. (*) Denotes significant differences between the TNF-–treated and untreated cells (P < .05). (**) Indicates significant differences in comparison to control values at 0 hours incubation (P < .05).
Time-dependent expression of MIP-1 receptors on LP CD34+ in short-term suspension culture. Cells were cultured at a concentration of 1 to 2 × 10⁵ cells in 1 mL of IMDM supplemented with 15% (vol/vol) FCS and incubated in 5% CO2 and 5%O2 in nitrogen for various time periods (4, 10, and 24 hours) in the absence or presence of TNF- (2 ng/mL). MIP-1 receptor expression was assessed by determining the mean fluorescence (A) and the percentage of CD34+ cells expressing MIP-1 receptors (B). (C) Shows a representative experiment. Overlay plots of the histograms (cell number against MFI) for the different cell populations at successive time-points are shown. T = 0 hours, empty area represents the untreated cell population stained for MIP-1 receptors (FITC). T = 10 hours and T = 24 hours, shaded and empty areas represent MIP-1 receptor expression in TNF-–treated and untreated cells, respectively. Data points in (A) and (B) are the mean ± SEM of four independent experiments. Nonspecific binding of avidin-FITC in TNF-–treated cultures was not increased over untreated cells at T = 0 hours. (*) Denotes significant differences between the TNF-–treated and untreated cells (P < .05). (**) Indicates significant differences in comparison to control values at 0 hours incubation (P < .05).
Furthermore, to exclude the possibility that changes in receptor expression were due to preferential death or survival of CD34+ subpopulations, cell viability was assessed using the Trypan blue exclusion method. Cell viabilities were similar in all groups and always within the range 80% to 92%.
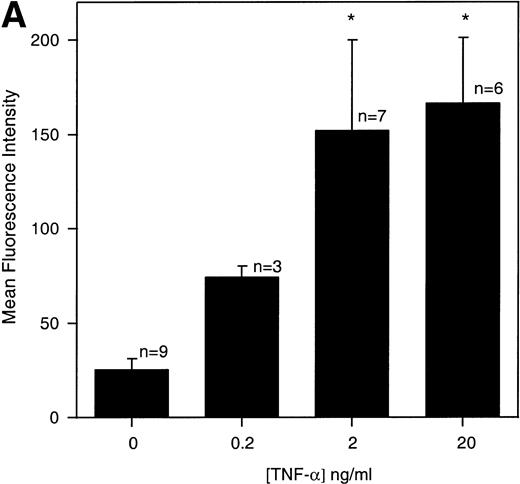
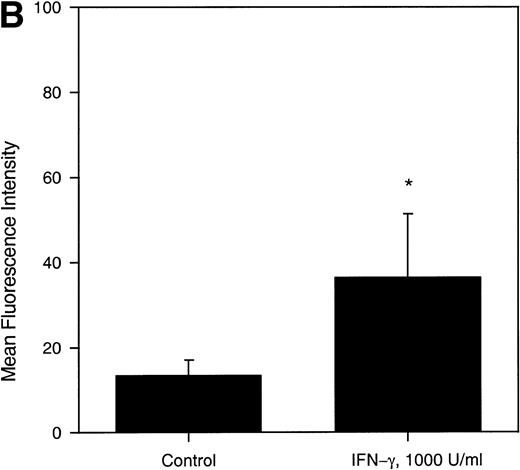
In general, TNF-α was found to be a potent upregulator of MIP-1α receptor expression (Fig 5A), whereas INF-γ elicited only a moderate but statistically significant stimulatory effect (Fig 5B). In contrast, under the conditions used, TGF-β (100 pmol/L) did not influence MIP-1α receptor expression (data not shown).
(A) Concentration-dependent increase of MIP-1 receptors on LP CD34+ in response to TNF-. Purified CD34+ cells were cultured for 24 hours in the absence or presence of varying concentrations of TNF-, as detailed in the legend of Fig 3. Thereafter, the expression of MIP-1 receptors on CD34+ cells was analyzed by flow cytometry. Bars represent the mean ± SEM of n independent experiments. (*) Denotes significant differences between the TNF-–treated cells and controls (P < .05). (B) IFN-γ–induced upregulation of MIP-1 receptors on LP CD34+ cells. Purified LP CD34+ cells were cultured for 24 hours in the absence or presence of IFN-γ (1,000 U/mL) as detailed in the legend of Fig 3. Thereafter the expression of MIP-1 receptors on CD34+cells was analyzed by flow cytometry. Bars represent the mean ± SEM of four independent experiments. (*) Denotes significant difference between the IFN-γ–treated cells and the control (P < .05).
(A) Concentration-dependent increase of MIP-1 receptors on LP CD34+ in response to TNF-. Purified CD34+ cells were cultured for 24 hours in the absence or presence of varying concentrations of TNF-, as detailed in the legend of Fig 3. Thereafter, the expression of MIP-1 receptors on CD34+ cells was analyzed by flow cytometry. Bars represent the mean ± SEM of n independent experiments. (*) Denotes significant differences between the TNF-–treated cells and controls (P < .05). (B) IFN-γ–induced upregulation of MIP-1 receptors on LP CD34+ cells. Purified LP CD34+ cells were cultured for 24 hours in the absence or presence of IFN-γ (1,000 U/mL) as detailed in the legend of Fig 3. Thereafter the expression of MIP-1 receptors on CD34+cells was analyzed by flow cytometry. Bars represent the mean ± SEM of four independent experiments. (*) Denotes significant difference between the IFN-γ–treated cells and the control (P < .05).
In two experiments CD34+ cells cultured under control conditions (serum-supplemented medium only) for 24 hours were stimulated with TNF-α at the 24-hour time point. As can be seen in Table 4, following a further 12-hour incubation in the presence of TNF-α, MIP-1α receptor expression increased when compared with the 24-hour levels and in one case to time zero levels. This indicates that the receptor downregulation in the control group was at least partially reversible.
DISCUSSION
We have analyzed the constitutive and induced expression of MIP-1α receptors in human CD34+ cells from normal bone marrow, cord blood, and leukapheresis products. The majority of CD34+ cells were found to express MIP-1α receptors constitutively on their cell surface. On average, MIP-1α receptor expression in CB was higher than in LP CD34+ and NBM CD34+ hematopoietic progenitor cells, although differences were not statistically significant. Perhaps more importantly, individual variation between different LP samples was substantially higher than in NBM and CB samples. Individual values could not be correlated to the patient’s disease characteristics, including pretreatment with radio/chemotherapy or the quality of the apheresis product. This raises the possibility that heterogeneity in MIP-1α receptor expression may reflect the variability of CD34+populations mobilized with different regimes. Our results in NBM and CB are consistent with previous studies by Su et al,25 showing that most NBM CD34+ cells express the MIP-1α receptor CCR-1. However, using a similar assay as described in this study, Chasty et al22 found that greater than 52% of NBM CD34+ express MIP-1α receptors.
The majority of colony forming cells were observed in the MIP-1α receptor positive fraction, although statistical significance was reached only in the case of LP CD34+ CFC-GM. Furthermore, cell cycle analysis of cytokine stimulated LP CD34+ cells revealed that MIP-1α receptor expression is significantly increased in cycling cells, which is in line with the results obtained in the clonogenic assays. Our cell cycle data are in contrast to those reported by Chasty et al,22 who did not observe a cell cycle–dependent expression of MIP-1α receptors on NBM CD34+ cells. However, this discrepancy may be explained by differences in the experimental systems. We have used growth factor stimulated hematopoietic progenitor cells to initiate cell cycling whilst Chasty et al used unstimulated cells.
Because analysis of biotinylated MIP-1α binding to CD34+cells cannot distinguish between the three different human MIP-1α receptors CCR-1, CCR-4, and CCR-5, we used specific polyclonal antibodies and standard indirect immunofluorescent techniques to identify these receptor subtypes in highly purified LP CD34+ cells. All three receptor subtypes were detected in cytospin preparations of LP CD34+cells. Microscopical evaluation revealed a characteristic staining of the cytoplasmic membrane, and this staining pattern was similar for all the three receptor subtypes, in all cell samples investigated. However, CCR-1 and CCR-5 were more highly expressed than CCR-4, and this observation was confirmed and further quantified in a flow cytometric assay. It is as yet unknown which MIP-1α receptor subtypes relay the different biological effects elicited by MIP-1α. Graham et al26suggested that MIP-1α uses different receptors to convey chemoattractant as opposed to stem-cell–inhibitory signals. In particular, CCR-1 was identified as an important receptor for chemoattraction, whereas no stem-cell–inhibitory effects were observed following CCR-1 activation. However, using neutralizing CCR-1 antibodies Su et al25 showed that the inhibition of BFU-E formation from NBM CD34+ induced by MIP-1α is at least partially mediated through CCR-1, suggesting a role of this receptor in the proliferative control of erythroid progenitor cells.
The more variable surface expression of the MIP-1α receptors in LP as compared to CB and NBM CD34+ cells led us to hypothesize that cellular and/or humoral factors could regulate the MIP-1α receptor status on CD34+ cells. Our first finding in support of this hypothesis was that CD34+ cells cultured in serum-supplemented medium exhibited a significant decrease of MIP-1α receptor expression over an incubation period of 24 hours in the absence of significant changes in cell viability. We then exposed LP CD34+ cells to TNF-α and IFN-γ, which have recently been shown to modulate Fas-receptor and IFN-γ–receptor expression on CD34+ bone marrow progenitor cells.27 Both cytokines increased the MIP-1α receptor expression significantly over 24-hour control values. For TNF-α this effect was shown to be time- and concentration-dependent and was detectable at concentrations of 0.2 to 2 ng/mL. Similar levels of TNF-α have been observed in the supernatants of normal LTBMC,28 suggesting that TNF-α could play a physiological role in MIP-1α receptor regulation in these culture systems. TGF-β, which was previously reported to downregulate MIP-1α receptors on FDCP-Mix cells,29 did not change receptor levels in our experimental conditions. Analysis of cell viability and the gating strategy used to analyze MIP-1α receptor expression excluded the possibility that changes in receptor expression were due to preferential cell death or survival of CD34+ cell subsets. This was also confirmed by the fact that receptor downmodulation on cultured CD34+ cells could be reversed by addition of TNF-α.
To our knowledge this is the first report on the upmodulation of MIP-1α receptor levels on human CD34+ cells by other inhibitory cytokines. However, the underlying mechanisms remain to be determined. Evidence for the regulation of chemokine receptors including CCR-1 at the transcriptional level has been described for T lymphocytes that were cultured in the presence of interleukin-2 (IL-2).30 The kinetics of IL-2–induced CCR-1 mRNA expression showed a gradual increase to a maximum after a 4-day culture period, while our results revealed a peak receptor protein expression after only 10 hours incubation. Furthermore and importantly, Loetscher et al 30 reported that CCR-1 upregulation was correlated with increased cell migration toward MIP-1α and RANTES, indicating that chemokine receptor levels can regulate the biological responsiveness of cells to chemokines.
TGF-β and MIP-1α play important roles in the cell cycle control of primitive hematopoietic progenitor cells that are localized in the adherent layers of long-term bone marrow cultures.31,32 It is known that MIP-1α is constitutively and inducibly produced by stromal cell types.3,33 Using immunohistochemistry we identified macrophages lodged in the stroma as the main producers of MIP-1α in these culture systems (E.A.D., unpublished data, August 1997). Furthermore, stromal fibroblasts, macrophages, and accessory T lymphocytes have been reported to secrete an array of cytokines including IL-1β, TNF-α, and IFN-γ.2,33,34Importantly, these proinflammatory cytokines have recently been shown to stimulate the production of MIP-1α in the bone marrow microenvironment.35 36 Therefore, in view of our data the inhibitory cytokines TNF-α and IFN-γ not only induce the production of MIP-1α but could also modulate the chemokine responsiveness of the hematopoietic target cells through regulation of MIP-1α receptor expression.
ACKNOWLEDGMENT
We thank M. Hughes and J. Barry for assistance with flow cytometry, Prof T.M. Dexter for helpful discussions, and the Cancer Research Campaign for support.
Supported by the Cancer Research Campaign of Great Britain. J.D. was supported by a grant from ESMO. C.K. was supported by a grant from “Aktion Kampf dem Krebs,” Germany.
Address reprint requests to Clare M. Heyworth, PhD, CRC Section of Haemopoietic Cell and Gene Therapeutics, Paterson Institute for Cancer Research, Christie Hospital NHS Trust, Wilmslow Rd, Manchester M20 4BX, UK; e-mail: Cheyworth@PICR.man.ac.uk.
The publication costs of this article were defrayed in part by page charge payment. This article must therefore be hereby marked "advertisement" is accordance with 18 U.S.C. section 1734 solely to indicate this fact.


