Abstract
CDR3 spectratyping was used to analyze the complexity of the T-cell repertoire and to define the mechanisms and kinetics of the reconstitution of T-cell immunity after allogeneic bone marrow transplantation (BMT). This method, which is based on polymerase chain reaction amplification of all CDR3 regions using the T-cell receptor (TCR) Vβ genes, was used to examine serial samples of peripheral blood lymphocytes from 11 adult patients with chronic myelogenous leukemia (CML) who underwent T-cell–depleted allogeneic BMT. In contrast to 10 normal donors who display highly diverse and polyclonal spectratypes, patient samples before and early after BMT revealed markedly skewed repertoires, consisting of absent, monoclonal, or oligoclonal profiles for the majority of Vβ subfamilies. To quantify changes in TCR repertoire over time, we established an 8-point scoring system for each Vβ subfamily. The mean complexity score for patient samples before transplant (130.8) was significantly lower than that for normal donors (183; P = 0.0007). TCR repertoire complexity was abnormal in all patients at 3 months after BMT (mean score = 87). Normalization of repertoire began in 4 patients at 6 months after BMT, but the majority of patients continued to display abnormal repertoires for up to 3 years after BMT. To determine whether the reconstituted T-cell repertoire was derived from the donor or recipient, unique microsatellite loci were examined to establish chimeric status. At 3 months after BMT, 7 patients demonstrated mixed chimerism; 4 had complete donor hematopoiesis (CDH). CDH strongly correlated with likelihood of restoration of T-cell repertoire complexity (P = 0.003). In contrast, patients who demonstrated persistence of recipient hematopoiesis failed to reconstitute a diverse TCR repertoire. These findings suggest that the reconstitution of a normal T-cell repertoire from T-cell progenitors in adults is influenced by interactions between recipient and donor hematopoietic cells. (Blood. 2000;95: 352-359)
The generation and maintenance of a diverse T-cell repertoire is a critical element of immune competence. In normal development, thymic processing of T-cell progenitors results in a broad array of naı̈ve T cells that remain present for much of the lifetime of an individual. Although thymic processing is thought to continue in normal adults, thymic involution occurs in all individuals and results in a marked decrease in the processing and generation of naı̈ve T cells. How the T-cell repertoire is generated and maintained after myeloablative therapy and allogeneic bone marrow transplantation (BMT) is not well understood. After conventional transplantation with marrow containing relatively large numbers of normal donor lymphocytes, T-cell reconstitution is at least in part derived from the expansion of mature donor T cells. However, T-cell reconstitution also occurs after transplantation of T-cell–depleted marrow, which contains few, if any mature differentiated T cells. In both instances, T-cell function remains compromised for prolonged periods of time. This clinical observation suggests that the process of regeneration of a diverse T-cell repertoire is a relatively slow one in adult individuals.
Following allogeneic BMT, regeneration of T-cell populations with a diverse repertoire can occur by at least 2 mechanisms. One mechanism is a thymic-dependent pathway, which presumably involves both negative and positive selection and recapitulates fetal ontogeny. Alternatively, regeneration of peripheral T cells may occur through thymic-independent mechanisms. Mackall et al. have examined the regeneration of CD4+ T cells after intensive chemotherapy, using CD45RA as a marker of naı̈ve cells generated by thymic-dependent pathways. Their results suggest that although thymic-dependent regeneration of CD4+ cells occurs in children after chemotherapy, this process is much less active in adults.1,2 After allogeneic BMT, Roux et al detected increased numbers of CD45RO+ memory cells, a hallmark of T cells that regenerate in the absence of a functioning thymus.3 These findings support the notion that thymic-independent pathways of T-cell regeneration are important and that these “peripheral” pathways function primarily in adults.
The extensive diversity of the mature T-cell receptor (TCR) is determined primarily by the complementarity-determining regions (CDR3) of the TCR. The CDR3 play a key role in defining the specificity of antigen recognition because these regions form the contact site for binding to peptide major histocompatibility complexes (MHCs) expressed by antigen-presenting cells. The CDR3 of both TCRα and TCRβ genes is generated by extensive rearrangement and fusion between the V, D, and J segments and by random insertion and deletion of junctional nucleotides, which yields final products that are quite heterogeneous in size. As a result of these gene rearrangements, each T cell has a unique TCR and the diversity of the T-cell repertoire at any specific time can be characterized by the examination of CDR3 within that population. The structure and sequence of the entire TCR Vβ gene family has been established,4 and polymerase chain reaction (PCR) amplification of the Vβ region has been previously described in a technique called CDR3 spectratyping.5,6 Using this technique, normal individuals demonstrate a highly diverse and polyclonal TCR repertoire with a typically gaussian distribution of CDR3 species of approximately 8 sizes for each Vβ region. In contrast, strong immune responses, such as acute graft-versus-host disease (GVHD), solid organ transplant rejection, infection, and autoimmune diseases, are associated with oligoclonal or monoclonal CDR3 patterns in peripheral blood as well as in the affected tissue.7-15 Patients with hairy cell leukemia demonstrate gradual normalization of skewed TCR repertoires after several years of treatment with interferon (IFN)-α, and patients with HIV infection normalize their T-cell repertoire following effective anti-retroviral therapy.16 We previously used CDR3 spectratyping to characterize the T-cell response after donor lymphocyte infusion (DLI).17 Patients with relapsed chronic myelogenous leukemia (CML) after allogeneic BMT were found to have markedly abnormal TCR repertoires but T-cell repertoire complexity was restored after DLI. Moreover, the response to DLI was associated with the appearance of new clonal T-cell populations in peripheral blood. Taken together, these studies demonstrate that severe deficiencies in the T-cell repertoire can be reversible and that CDR3 analysis provides a sensitive method for characterization of the T-cell repertoire as well as for following changes in individual patients over time.
In the present study, we used CDR3 spectratype analysis to examine the kinetics of T-cell reconstitution following allogeneic BMT in patients who received T-cell–depleted marrow from HLA-identical siblings. T-cell repertoire was analyzed in 11 patients with CML at various intervals up to 3 years after allogeneic BMT. This represents the largest cohort to date of a homogeneous population of patients undergoing this type of analysis. Because all the patients received normal donor hematopoietic stem cells without mature T cells, these patients provide the unique opportunity to examine peripheral T-cell reconstitution in adults. None of these patients developed clinical evidence of significant GVHD and thus the analysis was not complicated by the effects of GVHD or by the administration of immunosuppressive agents. When compared to normal donors, TCR Vβ repertoires of all patients were remarkably skewed at 3 months after transplant. By 6 to 12 months after BMT, several patients began to demonstrate gradual restoration in the complexity of the T-cell repertoire. Reconstitution of the T-cell repertoire appeared to occur only in patients who had exclusively donor hematopoiesis. In contrast, patients who demonstrated persistence of recipient hematopoiesis failed to reconstitute a diverse TCR repertoire. These findings suggest that the reconstitution of a normal T-cell repertoire from T-cell progenitors in adults is influenced by interactions between recipient and donor hematopoietic cells.
Materials and methods
Cell preparation
Heparinized blood samples from patients were obtained before and at various times after transplant. Heparinized blood samples were also obtained from 10 normal donors; 5 were HLA-identical sibling marrow donors for CML patients, and 5 were sibling donors for patients with multiple myeloma undergoing allogeneic BMT. Peripheral blood mononuclear cells (PBMC) from normal donors and patients were isolated by Ficoll/Hypaque density gradient centrifugation, cryopreserved with 10% dimethyl sulfoxide (DMSO), and stored in vapor phase liquid nitrogen until the time of analysis.
Flow cytometric analysis
The PBMC (0.5-1 × 10⁶) were incubated at 4°C for 30 minutes with murine monoclonal antibodies specific for CD3, CD4, CD8, and CD56 antigens conjugated to fluorescein or phycoerythrin (Coulter Immunology, Hialeah, FL). Antibodies were used at 1:100 dilution, and cells were washed with phosphate-buffered saline followed by fixation with 2% paraformaldehyde. Immunophenotypic analysis of the stained and fixed cells was performed on a Coulter EPICS XL Flow Cytometer (Beckman Coulter, Hialeah, FL). Absolute number of cells per lymphocyte subset was calculated as (% lymphocytes + monocytes + atypical lymphocytes) × (total peripheral white blood cells number) × % positive cells determined by flow cytometry (FACS).
RNA extraction, reverse transcription, and PCR
RNA was extracted from 12 to 26 × 106 PBMC by the single-step acid guanidinium thiocyanate/phenol/chloroform method (RNA Stat-60 kit; Tel-test Inc, Friendswood, TX) according to the manufacturer's protocol. First-strand cDNA was generated from 2 μg total RNA using random hexanucleotides (Pharmacia LKB Biotechnology Inc, Picscataway, NJ) and reverse transcriptase (Superscript; GIBCO BRL, Gaithersburg, MD). Each TCR Vβ segment was amplified with one of the Vβ subfamily-specific primers as previously described and a Cβ primer recognizing both Cβ1 and Cβ2 regions in a 100-μL volume.6 18 The Cβ primer was conjugated to fluorescent dye 6-FAM (Applied Biosystems, Foster City, CA) for CDR3 analysis. Because of the large size of the Vβ5 and Vβ13 gene products, these Vβ regions were amplified by 2 sets of non-overlapping primers, designated as Vβ5.1, Vβ5.2, Vβ13.1, and Vβ13.2. Thus, cDNA from each sample was amplified with a set of 26 primers spanning the entire group of 24 TCR Vβ subfamilies. Patients 3 and 7 had low lymphocyte counts before transplant, and there were insufficient amounts of starting material for the successful extraction of RNA and subsequent reverse transcriptase-polymerase chain reaction (RT-PCR) amplification of TCR CDR3 sequences at this particular time point.
Genomic DNA extraction
Genomic DNA was extracted from 3 to 10 × 106PBMC or bone marrow according to the manufacturer's recommendations (Wizard Genomic DNA Purification Kit, Promega, Madison, WI). Prior to amplification, all DNA samples were quantitated by UV spectrophotometry and diluted to working concentrations.
TCRβ chain CDR3 fragment size analysis
The size distribution of each fluorescent PCR product was determined by electrophoresis on an automated 373 or 377 DNA sequencer (Applied Biosystems, Foster City, CA) using a 4.75% or 4% polyacrylamide gel, respectively, and data were analyzed by GeneScan software (Perkin Elmer Cetus Instruments, Emeryville, CA). No differences in sensitivity of detection of spectratype peaks or morphology of peaks were noted between the 2 sequencing instruments (data not shown). Because the position of the 5′ and 3′ primers is fixed, fragment size differences within each Vβ subfamily are entirely due to different CDR3 lengths, reflecting junctional diversity and N-random nucleotide insertions in the V-D-J region. Peaks corresponding to in-frame transcripts are detected at 3 nucleotide intervals. A normal transcript size distribution, reflecting polyclonal cDNA, contains 8 to 10 peaks for each Vβ subfamily.5 The appearance of dominant peaks indicates the presence of excess cDNA of identical size, suggesting the presence of an oligoclonal or clonal T-cell population. The absence of any peaks after PCR amplification suggests the absence of any T cells using a specific Vβ subfamily of TCR genes.
Spectratype complexity scoring
The overall complexity within a Vβ subfamily was determined by counting the number of discrete peaks per subfamily. Subfamilies were graded on a score of 0 to 8 based on the degree of complexity. Normal complexity is characterized by a gaussian distribution of transcript sizes, which reflects the presence of polyclonal cDNA species and contains 8 to 10 peaks for each Vβ subfamily. A score of 0 was assigned if a subfamily was absent. A score of 1 was given if a subfamily demonstrated only a single monoclonal peak. A score of 2 was given for a biclonal profile. A subfamily was designated with a score of 3 if 3 peaks were present and so on. Finally, a score of 8 denoted a normal-appearing spectratype of 8 to 10 peaks with a complex, diverse, and polyclonal appearance. The overall spectratype complexity score per sample was calculated as the summation of the number of subfamilies (ie, 26, because subfamilies 5 and 13 are represented by 2 sets of primers) per score category, with a maximum possible score of 208 (8 × 26).
Hematopoietic chimerism assay
Genomic DNA was extracted from samples of each donor-recipient pair before transplant and amplified by PCR with a panel of 6 primer pairs specific for polymorphic microsatellite regions to identify an informative locus. Four of the 6 primer sequences have been previously described and were designated as b7, h10, h12, and h4.19 We found that these 4 primer sequences were not informative for some patients, and 2 additional primer pair sequences (designated as 3p2 and pi) were designed based on analysis of a linkage map of the human genome characterizing microsatellites regions20 (Table 1) (Genosys Biotechnologies, The Woodland, TX). As a modification of the technique described by Oberkircher, we conjugated the 3′ primer of each pair to fluorescent 6-FAM or Hex dye (Genosys Biotechnologies, The Woodland, TX). All reactions were performed in sterile autoclaved 0.5-mL microcentrifuge tubes containing 0.03 μg genomic DNA, 10 mM Tris-HCl (pH 8.3), 1.5 mM Mg2Cl, 50 mM KCl, 0.01% (w/v) gelatin, 200 μM each of deoxyguanosine triphosphate, deoxyadenosine triphosphate, deoxythymidine triphosphate, and deoxycytidine triphosphate, 0.5 U AmpliqTaq DNA polymerase (Perkin Elmer Cetus, Norwalk, CT), and 10% DMSO. After initial denaturation of the DNA template at 94°C for 5 minutes, each cycle consisted of denaturation at 94°C for 60 seconds, primer annealing at 55°C for 60 seconds, and primer extension at 72°C for 60 seconds for 40 cycles. A final 10-minute extension at 72°C followed the last cycle. The amplification products were electrophoresed on an automated 373 or 377 DNA sequencer (Applied Biosystems, Foster City, CA) using a 4.75% or 4% polyacrylamide gel, respectively, and data were analyzed by GeneScan software (Perkin Elmer Cetus Instruments). A locus was defined as informative if analysis of recipient and donor samples before transplant showed either a unique band for the recipient and a unique band for the donor, or if it showed a unique band for the recipient only. Once an informative locus was identified, genomic DNA from subsequent samples after transplant samples at various time points was amplified with that specific primer to follow hematopoietic chimerism. On the occasion that the donor to a male patient was female, male-specific primers to testis-determining factor (5′ primer—GAATATTCCCGCTCTCCGGA; 3′ primer—GCTGGTGCTCCATTCTTGAG) were used to detect chimerism.
Statistical analysis
Based on the spectratype complexity scores of 10 normal donors, we established a score of 142, based on the 95% lower confidence interval, as the lower limit of normal. The Student t test was used to assess the difference in Vβ complexity between the normal donors and the pretransplant profiles of the patients. We used the Fisher exact test to assess the association between patient characteristics and the achievement of normal Vβ complexity. Spearman's rank correlation was used to examine the relationship between complexity score and lymphocyte counts. Analyses were based on samples available before cytogenetic relapse.
Results
Patient characteristics
The clinical characteristics of the 11 patients studied are summarized in Table 2. All patients, aged 31 to 57 years (median, 43 years), underwent allogeneic HLA-matched sibling BMT at the Dana-Farber Cancer Institute between January 1990 and August 1993. Ten patients were in stable phase CML at the time of transplantation; patient 1 was in accelerated phase CML after relapse from his first BMT performed 5 years earlier. Only 2 patients received IFN-α before BMT. Ten patients were conditioned with cyclophosphamide and total body irradiation (TBI); patient 1 received busulfan and cyclophosphamide. Patients 2, 3, and 10 received splenic irradiation (750 cGy) just before conditioning. In each case, donor marrow was depleted of CD6+ T cells as previously described.21Phenotypic analysis of the marrow product revealed that CD3+ cells constituted 10% to 27% of mononuclear cells prior to T-cell depletion (mean, 2.35 × 10⁷ CD3+ cells/kg). Following T-cell depletion, marrows contained 0.1 to 1.5 × 10⁶ CD3+ cells/kg (mean, 0.78 × 10⁶). Patients received no other immunosuppressive therapy to prevent GVHD after BMT. Hematopoietic engraftment with donor cells was documented in each patient. After transplantation, 9 patients received low-dose interleukin-2 (IL-2) (3-6 × 10⁵ U/m2/d) for approximately 12 weeks beginning 3 months after BMT. None of the patients developed greater than grade 1 acute GVHD after BMT, and none received systemic immunosuppressive therapy after BMT. No patients received IFN-α after transplant. Patients 1 through 6 developed evidence of cytogenetic relapse 6 to 36 months after transplantation. Patients 7 through 11 have remained free of disease for 5 to 8 years after transplantation.
Comparison of TCR Vβ gene repertoire between normal individuals (donors) and CML patients
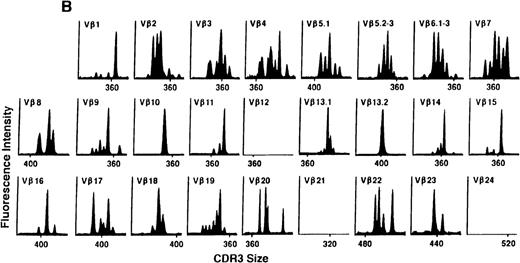
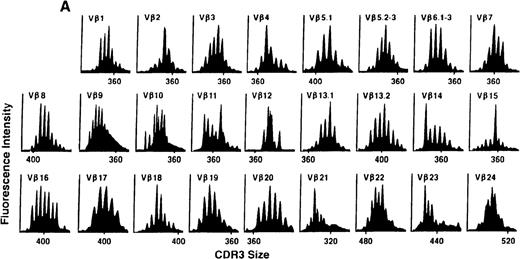
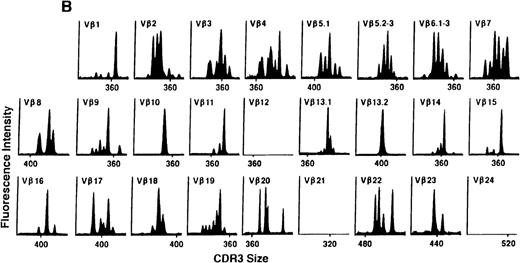
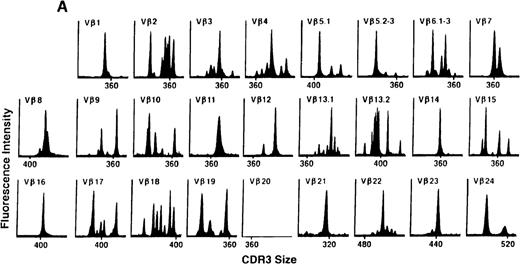
To determine if there were differences in TCR Vβ repertoire diversity between normal individuals and patients with CML before transplantation, the pretransplant profiles of both populations were compared. Profiles of 10 normal donors were examined, and consistent with our previous observations, 7 donors demonstrated a completely “normal” TCR repertoire profile based on the predominantly polyclonal distribution of spectratypes across every TCR Vβ gene family17 (Figure 1A). However, 2 of the 10 normal individuals demonstrated 4 to 6 oligoclonal subfamilies, and 1 donor had 4 monoclonal subfamilies. In reviewing the clinical histories of each donor, they had no known concurrent illnesses at the time of sample procurement. In contrast, the pretransplant profiles of the 8 CML patients with samples available were more heterogeneous. Some profiles appeared almost as complex and diverse as those of the normals, whereas others demonstrated numerous abnormalities. In the example shown in Figure 1B, Vβ subfamilies 12, 21, and 24 were absent; Vβ subfamilies 1, 10, 13.2, and 15 exhibited monoclonal spikes, and subfamilies 8, 11, 13.1, 14, 16, 18, 20, and 23 demonstrated oligoclonal patterns.
The pretransplant TCR Vβ repertoire of 1 donor (A) and recipient (B) pair.
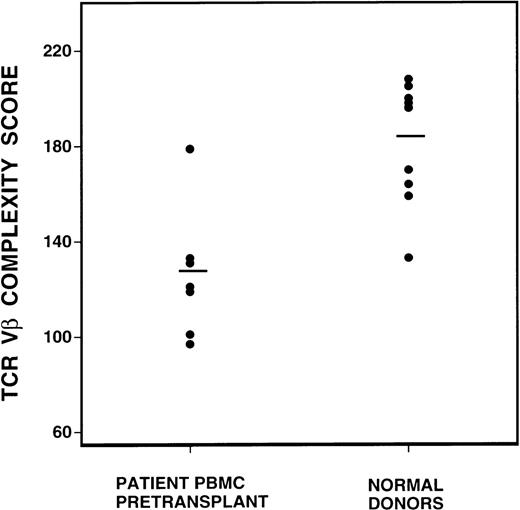
To quantify changes in the TCR Vβ gene repertoire, we created a complexity scoring system, calculated from the summation of the number of peaks visualized in each subfamily. The comparison of complexity scores for all normal donors and CML patients before BMT is shown in Figure 2. Of a maximum complexity score of 208, the mean score of 10 normal donors was 183 (SD 25), whereas the mean score of the CML patient samples was 131 (SD 25). This difference was highly statistically significant, P = 0.0007, by the Student t test.
Comparison of spectratype complexity scores of pretransplant recipients versus normal donors (P = 0.0007, Student t test).
Mean complexity scores are denoted by the bar lines.
Comparison of spectratype complexity scores of pretransplant recipients versus normal donors (P = 0.0007, Student t test).
Mean complexity scores are denoted by the bar lines.
Evolution of TCR Vβ spectratyping after transplantation
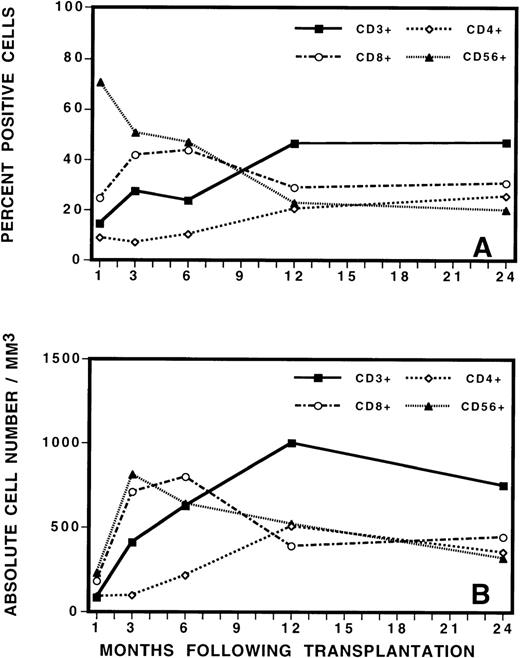
To guide the analysis of TCR repertoire, we initially evaluated the reconstitution of T, B, and natural killer (NK) cells by immunophenotypic analysis of PBMC after BMT (Figure3). This analysis revealed the gradual increase in total number of CD3+ T cells to a level of approximately 30% of PBMC by 3 to 6 months after BMT. The mean absolute number of CD3+ cells increased from 412/μL at 3 months after BMT to 624/μL at 6 months after BMT. This was a statistically significant increase in cell number (P = 0.03, Student t test). Closer examination of the mononuclear cell phenotype revealed that CD56+ NK cells contributed to the majority of the recovered lymphocytes during the immediate posttransplant period, followed by a gradual fall in the percentage of NK cells as the number of T cells increased. After transplantation, CD8+ cells were also proportionally increased in number, comprising approximately 40% of PBMC at 3 months after transplant. CD4+ cells were proportionally low at early as well as late time points and recovered slowly and gradually over time. At 3 months after BMT, the average CD8+/CD4+ ratio was 4:1. At 6 months, the ratio evolved to 3:1. At 12 months and thereafter, it was 1.5:1. No differences in recovery of cell numbers in the various lymphocyte subsets were noted between patients who later developed complete donor hematopoiesis (CDH) or mixed chimerism (MC) or who eventually relapsed or remained in continuous remission.
Phenotypic analysis of lymphocyte subsets by (A) percentage and (B) by absolute cell numbers at various times after transplant.
Phenotypic analysis of lymphocyte subsets by (A) percentage and (B) by absolute cell numbers at various times after transplant.
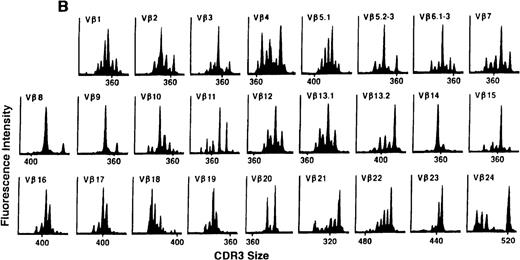
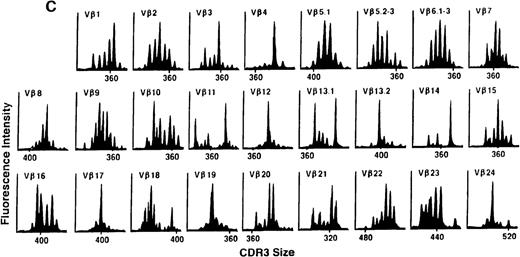
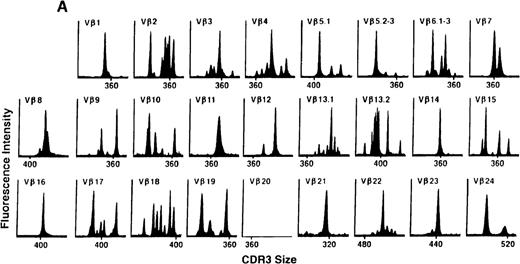
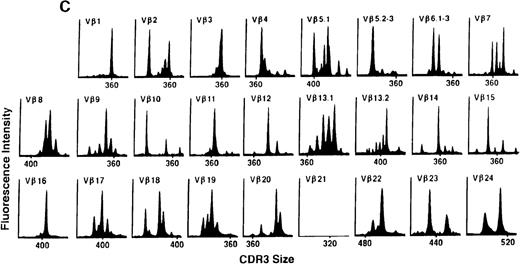
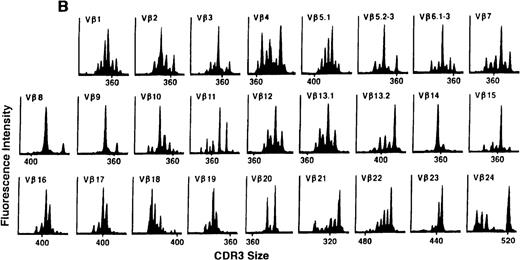
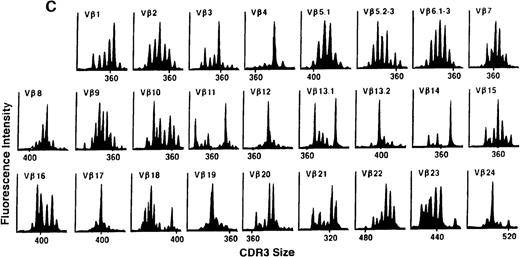
We next examined changes in TCR Vβ subfamily profiles at various times after allogeneic BMT. Examples of spectratypes obtained at 3, 6, and 36 months after BMT for 2 patients are shown in Figures 4 and5. These are representative of the 2 patterns of repertoire evolution that emerged in the analyses. In all patients, the early time points were remarkable for the predominance of many monoclonal and biclonal peaks as well as several absent subfamilies (see Figures 4A and 5A). At 6 months after BMT, 7 patients continued to possess remarkably skewed and limited repertoires (see Figure 5B), whereas 4 patients began to demonstrate restoration in the complexity of many Vβ subfamilies (see Figure 4B). The TCR profiles of these latter 4 patients continued to normalize over the course of 18 months (see Figure 4C). In contrast, 3 of the 7 patients of the former group continued to have evaluable samples at later time points (18, 24, and 36 months) and had persistently skewed repertoires at these later times (see Figure 5C).
TCR Vβ repertoire profiles for patient 7 at (A) 3 months, (B) 6 months, and (C) 3 years after transplant.
TCR Vβ repertoire profiles for patient 7 at (A) 3 months, (B) 6 months, and (C) 3 years after transplant.
TCR Vβ repertoire profiles of patient 3 at (A) 3 months, (B) 6 months, and (C) 3 years after transplant.
TCR Vβ repertoire profiles of patient 3 at (A) 3 months, (B) 6 months, and (C) 3 years after transplant.
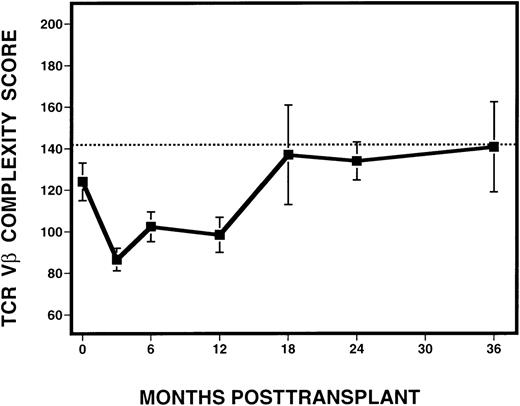
To quantify the changes in TCR Vβ subfamilies over time, complexity scores were assigned to each sample analyzed following transplantation (Figure 6). Excluded from the analysis were samples derived from time points after the diagnosis of relapse, as defined by the presence of detectable cytogenetic disease. Because the number of mature CD3+ cells in the infused marrow product or in the circulating blood might affect the degree of Vβ complexity, we examined whether Vβ complexity score was correlated with the number of circulating T cells in peripheral blood. By Spearman's rank correlation, no relationship between complexity and absolute CD3+ cell counts, calculated based on phenotypic analysis of PBMC from the same time point and patient, but obtained from a separate sample, was seen. Based on the analysis of 10 normal donors, we calculated a score of 142 to be the lower limit of the 95% confidence interval for the mean of the normals. At 3 months after BMT, there was a dramatic decrease in mean complexity score (87) in all patients, compared with pretransplant scores. At 6 and 12 months, there was an overall increase in mean complexity scores to 102 and 98, respectively. By 18 months after BMT and thereafter, mean complexity scores (range, 134-140) approached the score of 142, which was considered the lower limit of the normal range.
Evolution of spectratype complexity in 11 patients with CML, following T-cell–depleted allogeneic BMT.
The dotted line denotes the lower limit of the 95% confidence interval of normal range (142). The solid line represents the mean complexity scores calculated from all 11 patients at various time points, with the error bars representing the standard deviation.
Hematopoietic chimerism
To examine whether the reconstituted peripheral blood or marrow was derived from donors or recipients, we analyzed microsatellite regions of genomic DNA for the presence of male-specific markers to distinguish between hematopoiesis of donor and recipient origin at serial time points. Informative microsatellite regions were identified for 10 of 11 donor-recipient pairs. Chimerism for patient 6 was detected by PCR analysis using male-specific primers to testis-determining factor. The presence of a unique recipient microsatellite polymorphism or male cells in patient samples was evidence of continued recipient contribution to hematopoiesis. As summarized in Table3, Patients 1, 3, 4, 5, and 6 all demonstrated persistence of recipient-derived cells at each time point, beginning at 3 months after BMT, the first time point we analyzed. In contrast, patients 7, 9, 10, and 11 consistently demonstrated only donor hematopoiesis at all time points. Patients 2 and 8 demonstrated MC at 3 months, had no evidence of recipient cells at 6 months, but reverted to MC by 12 months after transplant.
TCR Vβ complexity scores are associated with chimeric status
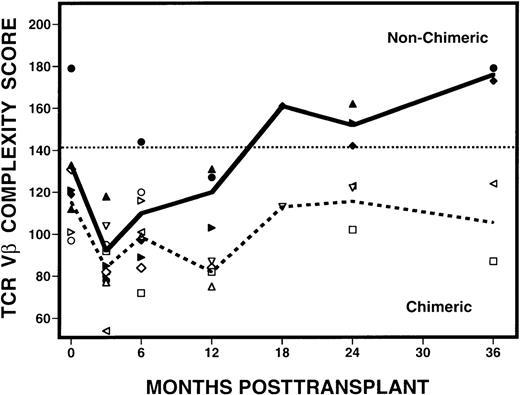
After determining that 4 patients (patients 7, 9, 10, 11) had CDH and 7 patients had MC following transplantation, we examined whether the presence of hematopoietic chimerism was associated with the reconstitution of TCR diversity. When patients with CDH were compared with those with MC, striking differences were seen in their complexity scores over time (Figure 7). At 3 months after transplant, samples from both groups of patients had abnormally low complexity scores. Scores remained low in the patients with MC, but scores began to improve at 6 months after BMT in the patients with CDH. By 24 months, the scores in CDH patients had normalized and they remained normal at 36 months after BMT. In contrast, complexity scores remained low in all MC patients who remained evaluable. Using the Fisher exact test, we determined that patients with CDH are statistically more likely to attain normalization of the Vβ repertoire than patients with MC (P = 0.003), with the differences becoming more evident 6 months or longer after transplantation. These changes in Vβ complexity scores were also associated with relapse, because none of the patients with CDH relapsed and 6 of 7 patients with MC relapsed after BMT. Of note, patient 8 is the only patient with MC who did not relapse, but has continued to have abnormally low complexity scores for 5 years after BMT (data not shown).
Evolution of spectratype complexity in patients with mixed hematopoietic chimerism or complete donor hematopoiesis.
Open symbols around the dashed line represent the MC mean complexity scores, and solid symbols around the solid line, the CDH mean complexity scores. The dotted line denotes the lower limit of normal range (142) of values defined by the 95% confidence interval of results from 10 normal donors.
Discussion
Previous studies have suggested that after myeloablative therapy reconstitution of the T-cell repertoire is derived primarily from expansion of mature T cells present within the stem cell graft. In the period of early reconstitution after autologous or allogeneic BMT, these T cells are predominately CD45RO+ and do not represent naı̈ve CD45RA+ T cells.3,22,23 The T-cell repertoire appears to be markedly abnormal within the first 3 months after transplant in all patients, but deficiency of the repertoire appears to be more extensive in patients who receive highly purified CD34+ progenitors or T-cell–depleted stem cells.24,25Reconstitution of the TCR repertoire with CD45RA+ cells appears to occur more rapidly in pediatric patients who likely retain more thymic function than adult patients.1 2 However, little is known about the mechanisms whereby the T-cell repertoire is reconstituted and the factors that influence the extent of reconstitution from undifferentiated lymphoid progenitors in either pediatric or adult patients.
We carried out the present studies to better define reconstitution of T-cell immunity after allogeneic BMT. This analysis was undertaken in a homogenous group of 11 adult patients with CML who received myeloablative therapy followed by transplantation of T-cell–depleted marrow from HLA-identical sibling donors. None of the patients received immune suppressive therapy after BMT and none developed clinically evident GVHD. We began by examining the kinetics of recovery of phenotypically mature lymphoid cells and the major T-cell subsets. These results are consistent with previously published reports from our group as well as others demonstrating that CD56+ CD3− NK cells are the first lymphoid cells to return, followed by CD8+ T cells.26,27 By 6 to12 months after transplantation, all patients attained relatively normal numbers of circulating CD3+ T cells. However, the CD4+ T-cell population returned slowly in these patients resulting in an inversion of the normal CD4/CD8 ratio for more than 1 year after BMT.28-30 Our analysis revealed a fairly uniform rate of recovery of phenotypically mature lymphocytes among this group of relatively homogenous patients, irrespective of their eventual clinical outcome.
Having observed the reconstitution of phenotypically mature T cells in peripheral blood, we next undertook an extensive analysis of CDR3 spectratypes to better characterize regeneration of TCR repertoire at various times after BMT. We developed a quantitative scoring schema to measure the degree of TCR repertoire deficiency in each sample and found that there was a statistically significant difference between normal donors and patients with CML before transplant (P = 0.007). As expected, normal donors possess complex and diverse spectratypes. In contrast, the spectratypes of the patients with CML before transplant were quite heterogeneous. We did not find this result surprising, because the patients presented with varying severity of illness and had received different therapies for varying periods of time before BMT. For example, patient 3 received IFN-α for 4 years before transplant. Patient 1 had already had a prior BMT and had a particularly low pretransplant complexity score of 97. Patient 7 had developed infectious hepatitis before transplant and also had a low score of 119. The other patients presented with good to intermediate prognosis stable phase CML and had pretransplant complexity scores ranging from 133 to 179. Although our results indicate a statistically significant difference between donors and patients with CML before transplant, our analysis of a limited cohort of patients does not clearly identify the cause of this difference. It is possible that the presence of leukemia alone causes derangements in T-cell repertoire. Alternately, the stage of disease, prior therapy, other concurrent illnesses, or any combination of these factors may influence T-cell repertoire. However, it is important to note that neither the degree of CDR3 complexity of the donors nor of the patients before transplant appeared to correlate with eventual clinical outcome or the reconstitution of T-cell repertoire after allogeneic BMT.
At 3 months after BMT, all patients had marked abnormalities in their spectratypes, with many Vβ subfamilies demonstrating monoclonal or oligoclonal profiles, consistent with clonal expansion of distinct T-cell populations. These clonally expanded cells may represent expansion of peripheral T-cell populations in response to a stimulating antigen, such as an infectious agent (although none of the patients had evidence of an obvious infection) or alloantigen. Alternatively, these may represent the peripheral clonal expansion of a limited number of T cells that remained present in the marrow graft despite T-cell depletion. By 6 months after transplant, 2 distinct patterns of reconstitution of TCR repertoire became evident. Seven patients continued to have markedly abnormal profiles and these abnormalities persisted at later time points (12, 18, 24, and 36 months). In contrast, 4 other patients began to demonstrate evidence of normal, polyclonal expanded Vβ subfamilies at 6 months after transplant, with continued normalization of complexity at later time points. In comparing these 2 groups of patients, clinical parameters such as age, gender, number of mature CD3+ cells infused in the bone marrow product, and presence of GVHD or cytomegalovirus infection could not account for these differences. Moreover, 9 of the 11 patients had received low-dose IL-2 for extended periods after BMT, but neither treatment with IL-2 nor duration of IL-2 exposure appeared to affect repertoire development (data not shown).
Although spectratyping allows the detection of subtle changes in the T-cell repertoire, this method cannot discern the origin of the T cells examined. We therefore complemented our analysis of TCR repertoire with an examination of hematopoietic chimerism. It has previously been established that patients can become mixed (donor/host) chimeras after BMT and that MC occurs more frequently after T-cell–depleted marrow transplants.31 When sensitive PCR-based methods are used, MC has been estimated to occur in 80% to 90% of patients after T-cell–depleted BMT.32 33 The presence of MC suggests that recipient hematopoietic elements frequently survive the myeloablative regimen. In our patients, PCR analysis of informative microsatellite polymorphisms or male-specific gene expression documented MC in 7 of 11 patients at 3 months after BMT. Although recipient cells were not detected in all subsequent samples in some of these patients, each of these individuals eventually developed stable MC. When the results of the chimerism assays were correlated with the spectratyping analysis, it became evident that none of the 7 patients with stable MC demonstrated reconstitution of a normal TCR repertoire. In contrast, normalization of the Vβ repertoire was noted in each of the 4 patients who converted to CDH and persistent recipient hematopoiesis could not be detected by PCR. This close correlation strongly suggests that the persistence of recipient hematopoiesis affected the reconstitution of a normal TCR repertoire after allogeneic BMT.
Although the persistence of recipient cells appears to influence the reconstitution of a normal TCR repertoire, it is not known whether this effect is due to the presence of either leukemic or normal hematopoietic cells. Six of the 7 patients with MC later developed cytogenetic relapse, and in these individuals, the presence of recipient cells detectable by PCR may have reflected the presence of leukemia cells rather than normal hematopoietic elements. Patient 8, however, has remained in cytogenetic remission for 8 years after BMT despite the persistence of recipient cells detected by microsatellite PCR. In this individual, recipient cells detected by PCR are not likely to be derived from the CML clone and yet this patient has also not demonstrated reconstitution of a normal TCR repertoire. The last sample examined for TCR repertoire in this patient was obtained 5 years after BMT and continued to demonstrate a markedly abnormal spectratype. Although this finding has only been demonstrated in a single individual, these results suggest that the presence of recipient cells, regardless of leukemic or non-CML origin, has an important influence on repertoire development after transplant.
In considering how the presence of recipient cells may affect T-cell repertoire development, we may extrapolate from the experience with well-defined murine models of peripheral T-cell repertoire development. In thymectomized mice, maintenance of mature T cells in the peripheral pool has been demonstrated to be an active process, requiring continuous TCR ligation by MHC molecules.34,35 Moreover, affinity and duration of exposure to antigen can determine whether the responding T-cell population is expanded or deleted.36,37In our patients, the persistence of recipient cells results in the continued presence of alloantigens (e.g., minor histocompatibility antigens [mHAgs]), unfamiliar to donor origin T-cell precursors. We hypothesize that the persistent expression and presentation of recipient mHAgs may exert a profound effect on repertoire development, perhaps by causing expansion or deletion of reactive T cells resulting in a collapsed repertoire. Evidence suggests that such mHAgs play an important role in the GVHD and graft-versus-leukemia responses.38,39 Increasing numbers of mHAgs have recently been identified, and though many mHAgs have ubiquitous tissue distribution, it has been shown that the expression of some mHAgs is restricted to hematopoietic cells and leukemia cells.40Importantly, it has been recently demonstrated that specific cytotoxic T lymphocytes can be generated against mHAgs from the blood of patients with hematologic malignancies.40 41 Taken together, these findings support the notion that mHAgs expressed in the recipient may be important immunologic targets of the donor immune system and may also influence the reconstitution of T-cell repertoire after allogeneic BMT.
Supported by National Institutes of Health Grant AI29530.
E.P.A. is a special fellow of the Leukemia Society of America; R.J.S. is a scholar in clinical research of the Leukemia Society of America; C.J.W. is a physician postdoctoral fellow of the Howard Hughes Medical Institute.
Reprints:Jerome Ritz, Dana-Farber Cancer Institute, 44 Binney St., Boston, MA 02115; e-mail: jerome_ritz@dfci.harvard.edu.
The publication costs of this article were defrayed in part by page charge payment. Therefore, and solely to indicate this fact, this article is hereby marked “advertisement” in accordance with 18 U.S.C. section 1734.


