Abstract
Paroxysmal nocturnal hemoglobinuria (PNH) is an acquired clonal disorder of the hematopoietic stem cell (HSC). Somatic mutations in thePIG-A gene result in the deficiency of several glycosylphosphatidylinositol-linked proteins from the surface of blood cells. This explains intravascular hemolysis but does not explain the mechanism of bone marrow failure that is almost invariably seen in PNH. In view of the close relationship between PNH and idiopathic aplastic anemia (IAA), it has been suggested that the 2 disorders might have a similar cellular pathogenesis, namely, that autoreactive T-cell clones are targeting HSCs. In this paper, we searched for abnormally expanded T-cell clones by size analysis of the complementarity-determining region 3 (CDR3) in the beta variable chain (BV) messenger RNA (mRNA) of the T-cell receptor (TCR) in 19 patients with PNH, in 7 multitransfused patients with hemoglobinopathy. and in 11 age-matched healthy individuals. We found a significantly higher degree of skewness in the TCR BV repertoire of patients with PNH, compared with controls (R2 values 0.82 vs 0.91,P < .001). The mean frequency of skewed families per individual was increased by more than 2-fold in patients with PNH, compared with controls (28% ± 19.6% vs 11.4% ± 6%,P = .002). In addition, several TCR BV families were significantly more frequently skewed in patients with PNH than in controls. These findings provide experimental support for the concept that PNH, like IAA, has an immune pathogenesis. In addition, the identification of expanded T-cell clones by CDR3 size analysis will help to investigate the effect of HSC-specific T cells on normal and PNH HSCs.
Introduction
Paroxysmal nocturnal hemoglobinuria (PNH) is an acquired hemolytic syndrome with 3 cardinal clinical features: intravascular hemolysis, tendency to venous thrombosis at unusual sites, and variable degrees of bone marrow failure with consequent cytopenias. The molecular and biochemical pathogenesis of PNH is now well characterized. Somatic mutations of the X-linked PIG-Agene in hematopoietic stem cells (HSCs) result in complete or partial deficiency of several glycosylphosphatidylinositol (GPI)-linked proteins from the surface of the blood cells progeny of the mutated HSCs.1-4 Deficiency of the complement regulating proteins CD59 and CD55 is responsible for the continuous intravascular hemolysis and probably has an important role in the prothrombotic diathesis.1-4 A contentious aspect of the pathogenesis of PNH has been the growth potential of the PNH HSCs. Clinical observations,1-4 data from in vitro hematopoietic colony studies,5 and data from PIG-A knock-out mice6-10 indicate that PNH HSCs have a conditional rather than absolute growth advantage.
The pathogenetic basis of the bone marrow failure that almost invariably accompanies PNH is another unresolved issue. However, the fact that as many as 50% of patients with idiopathic aplastic anemia (IAA) develop sizeable PNH clones11 at some stage in the course of their disease favors the view that the 2 disorders may share the same cellular pathogenetic mechanisms. In fact, severe IAA and hemolytic (“florid”) PNH can be considered as the 2 extremes of a spectrum in which the clinical phenotype is determined by the size of the PNH clone. When the PNH hematopoietic clone is small or undetectable, the patient has IAA; when the PNH hematopoietic clone is sizeable, then the clinical picture of PNH with hemolysis is evident.12 IAA itself is thought to be an autoimmune disease in which HSCs are the target of autoaggressive T lymphocytes.13-15 The autoantigen recognized by the autoreactive T cells remains unknown. It has been suggested that these autoaggressive T-cells are present also in patients with PNH and, although normal HSCs are targeted, PNH HSCs escape the T-cell attack, possibly because of their lack of GPI-linked proteins; as a result, PNH HSCs expand, contributing to various degrees to hematopoiesis.3,16,17 The observation that PNH HSCs have a relative and not an absolute growth advantage and the recent finding that even healthy individuals harbor granulocytes with the PNH phenotype, the progeny of mutated hematopoietic progenitors withPIG-A mutations, would be consistent with the above outlined model.18
Recently, expansions of certain T-cell clones were demonstrated in the bone marrow of Japanese patients with IAA possessing the HLA DRB1*1501 allele, by size analysis of the messenger RNA (mRNA) of the complementarity-determining region 3 (CDR3) of the T-cell receptor (TCR) beta variable (BV) chain genes.19 This approach has already been used extensively for the detection of expanded T-cell clones in autoimmune diseases,20,21 including rheumatoid arthritis 22,23and multiple sclerosis;24-26 as well as in some patients with tumors.27-29 Interestingly, persistent clonal T-cell expansions have also been demonstrated in apparently healthy subjects, especially in elderly humans.30-32
If autoreactive T cells played a role in the pathogenesis of PNH, the respective clones might cause skewing of the normal distribution of the T-cell repertoire. To test this notion we have systematically analyzed the T-cell repertoire in the blood from 19 patients with the hemolytic form of PNH and from 11 healthy control subjects by using CDR3 mRNA size analysis. To test for the possible effect of blood transfusion on the T-cell repertoire as a result of allosensitization,33 34 7 multitransfused patients with sickle cell disease or thalassemia were included in the study. There was no difference in the frequency of skewing of the T-cell repertoire between normal and transfused, non-PNH individuals. On the contrary, there was a significantly higher degree of skewness in the TCR BV repertoire of patients with PNH compared with controls (R2 values 0.82 vs 0.91, P < .001) and a higher than 2-fold increase in the mean frequency of skewed TCR BV families per individual in the patients with PNH compared with controls (28% vs 11.4%, P = .002). Furthermore, skewing of several individual BV families was also significantly higher in patients with PNH compared with controls. Four patients were studied longitudinally for up to 2.5 years. In 2 of them, the TCR BV CDR3 profiles remained unchanged; in the other 2, the changes in the CDR3 patterns correlated with response to immunosuppressive treatment.
Patients, materials, and methods
Patients
Nineteen patients with the hemolytic form of PNH were studied (median age 35 years). The median values of the sizes of the PNH clones in red blood cells (RBCs) and granulocytes were 55% (range 10%-92%) and 80% (range 23%-100%), respectively (Table1). In all patients, with the exception of patients MSK1 and HH54 on whom bone marrow smears were not available, bone marrow displayed moderate to marked erythroid hyperplasia. All patients, with the exception of MSK27, MSK28, and MSK47, had received regular or occasional blood transfusions before sampling. Patients MSK7, MSK11, MSK21, MSK32, and MSK 35 received immunosuppressive treatment (ATG/ALG ± cyclosporine) because of progressive cytopenia(s). Patient MSK42 received low-dose cyclophosphamide for large granular lymphocyte-associated neutropenia (manuscript in preparation), patient MSK17 received steroids for hemolysis, and patient MSK46 received one course of fludarabine because of an initial misdiagnosis of chronic lymphocytic leukemia. Eleven, apparently healthy individuals, age-matched (median age 34 years) with the patients, served as a control group. In addition, 7 multitransfused (more than 200 units of blood per patient) patients with sickle cell disease or thalassemia (median age 27.5 years) were studied. Samples were collected according to the appropriate institutional IRB-approved protocols.
Peripheral blood mononuclear cell isolation
Peripheral blood mononuclear cells (PBMCs) were isolated by centrifugation of peripheral blood over Ficoll-Hypaque (Pharmacia, Uppsala, Sweden).
RNA isolation and complementary DNA synthesis
Total RNA was extracted from one to 2 × 10⁶ PBMCs with the RNA isolator kit (Genosys, The Woodlands, TX). The GeneAmp RNA kit (Perkin-Elmer, Foster City, CA) was used for first strand complementary DNA (cDNA) synthesis. Briefly, 1 unit of murine leukemia virus reverse transcriptase was used in the presence of 1 μg of RNA, 50 μmol/L of oligo-dT at 42°C for 15 minutes and in a final volume of 20 μL.
Beta variable-family specific and “run-off” polymerase chain reactions
As a sensitive indicator of clonal/oligoclonal T-cell expansions, the TCR BV chain repertoire was analyzed35,36using a fluorophore-based polymerase chain reaction (PCR) assay in which all 24 TCR BV families can be amplified, and after being run on an acrylamide gel, can be visualized on an automated sequencer. This approach allows the amplification of part of the BV segment, the whole complementarity determining region 3, the BJ segment and part of the BC segment that constitute a given TCR beta chain transcript, hence the term CDR3 size analysis. On the basis of nucleotide homology of more than 70%, human TCR BV genes are grouped in 24 families of which BV10 and BV19 are not functional.37 After computer analysis, the repertoire profile of a given TCR family takes the form of a Gaussian or nearly Gaussian-like curve (diverse repertoire) consisting of multiple peaks (usually 6-8), 3 nucleotides apart from each other; any deviation from the Gaussian profile (skewed repertoire) would indicate clonally or oligoclonally expanded T-cell populations. These expansions can be further refined by using 13 primers corresponding to each of the BJ segments.
The CDR3 length analysis was conducted by using a 2-step PCR. First, in 24 separate PCRs and using as template equal amounts of PBMC cDNA, each TCR B family was specifically amplified by using a sense, TCR BV family-specific primer and an antisense, TCR BC common primer, as described by Schwab et al.32 The 5 μL of 10X buffer (Perkin-Elmer, Foster City, CA) containing 15 μmol/L of MgCl2, 5 μL of 2 mmol/L of each dNTP, 2.5 μL of 10 μmol/L of each primer, and 0.25 μL of 5 U/μL of AmpliTaq (Perkin-Elmer, Foster City, CA) were mixed in a final volume of 50 μL. The PCR was performed in a Perkin-Elmer GeneAmp 9700 thermocycler and under the following conditions: initial heating at 94°C for 30 seconds, followed by 40 cycles of amplification by denaturation at 94°C for 20 seconds, annealing of primers at 60°C for 30 seconds and extension at 72°C for 60 seconds, with a final extension of the primers at 72°C for 10 minutes. For each of the BV-BC amplifications, a negative control was included by omitting cDNA in the PCR mixture. Subsequently, 2 μL of the PCR product of each BV-BC amplification was subjected to a second round of a “run-off” amplification of only 10 cycles by using a common, FAM-labeled BC antisense primer, internal to the one used for the primary PCR (0.15 μmol/L final concentration of the FAM-labeled primer). The PCR conditions remained the same as for the primary PCR. For BJ “run-off” PCRs, the FAM-labeled BC primer was replaced by 13 FAM-labeled primers, each specific for the 13 BJ segments. The “run-off” products were visualized on 6% acrylamide sequencing gel on a 377ABI DNA sequencer (Perkin-Elmer, Foster City, CA) with fluorescent markers of the appropriate size. The Immunoscope software package35 36 was used for the analysis of the profiles of the fluorescent products.
Sequence analysis of the CDR3 region
For patients MSK42 and HH54, sequencing for the identification of the unique CDR3 region of the expanded T-cell clone was performed. BV7-BJ1.5 PCR products obtained from patients MSK42 and HH54 were cloned into a TA-cloning vector according to manufacturer's instructions (Invitrogen, Carlsbad, CA). Clones were screened by PCR using BV7 and BJ1.5 primers. Clones with an insert of the expected size (as determined from the BJ “run off” analysis) were sequenced on an automated sequencer (ABI 377, Perkin-Elmer, Foster City, CA). PCR products were purified by using the Wizard PCR Purification kit as described by the manufacturer (Promega, Madison, WI). Ten pmoles of the BV7 family primer were used for sequencing, in the presence of 80 to 100 ng of purified PCR products and 12 μL of Dye Terminator mix and in a final volume of 20 μL as described by the manufacturer (Perkin-Elmer, Foster City, CA). For patient MSK42, direct sequencing of the BV7-BC PCR product was also performed using the Sequenase kit according to manufacturer's instructions.38
Statistical analysis
Shapes of TCR BV profiles approximated Gaussian “bell-shaped” curves, with discrete peaks placed at multiples of 3 nucleotide positions. TCR BV10 and BV19 genes are now known to be pseudogenes and therefore they have been excluded from the analysis. Family BV20 was also excluded from analysis because acceptable profiles (ie, profiles with adequate signal-to-noise ratios) were only obtained in 11 subjects studied. In some cases, individual profiles had a very low signal-to-noise ratios and these were also excluded from analysis. The median number of profiles available for analysis per individual was the same in the patient (19.5, range 15-21) and control groups (19, range 15-21).
Quadratic regression was applied to log-fluorescent intensity values at locations within 5 multiples-of-3 nucleotides on each side of the center of the distribution for each BV family for each sample analyzed.R2 values from the regression were used as a measure of goodness-of-fit (ie, closeness of approximation to a Gaussian curve): a perfect fit would yieldR2 = 1. Distributions that deviate markedly from the norm, such as those that have extra peaks or plateaus, have lower R2 values than distributions that approximated a bell-shaped curve. Totally random profiles would yieldR2 values near 0. R2values were compared by 2-sample Student t test. Thus, quadratic regression analysis of R2 values provides a global assessment of the difference in skewing between patients and controls in single TCR BV families and across the whole repertoire.
To classify each individual profile as normal or abnormal (skewed), we adopted a set of numerical criteria. A profile was regarded as abnormal if it met any of the following 3 criteria: (1) peak withR2 < 0.55; (2) peak 40% above the median value of the fitted value; and (3) peak higher than double or lower than half of the corresponding point of the fitted curve. Otherwise, it was classified as normal. Because the cut-off values were somewhat arbitrary, we verified that slight variations yielded similar ratios of percent-abnormal between patients with PNH and controls. In addition to overall comparisons, nominal Fisher's exact test P-values are reported for the comparison of the frequency of skewed TCR BV family profiles. Finally, Student t test was used to compare differences in the frequency of skewed TCR BV families per individual between the studied groups.
Results
Screening for TCR BV families with expanded clones
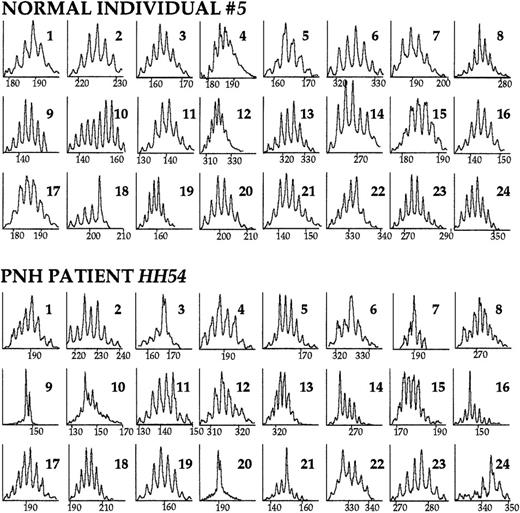
We studied 19 patients with the hemolytic form of PNH, median age 35 years. As controls, we studied 11 apparently healthy individuals with a median age of 34 years. Because the majority of the patients had received blood transfusions at some stage of their disease, we also studied 7 heavily transfused patients with sickle cell disease or thalassemia to assess the possible effect of the blood transfusion-mediated alloimmunization on the T-cell repertoire.33 34 Family-specific TCR BV sense primers and a common TCR BC antisense primer were first used to screen for TCR B families that would contain expanded clone(s). Typical CDR3 size analysis profiles are shown in Figure1.
The TCR BV repertoire analyzed by CDR3 size profiles.
PBMC cDNA was used as template in the primary BV-BC PCR reaction. Subsequently, a secondary, “run-off” PCR reaction with an internal, FAM-labeled BC primer was performed. The products were run on an acrylamide gel and displayed through the use of an automated sequencer. Immunoscope software analysis reveals the distribution of TCR BV mRNA sizes. Within each peak are represented mRNAs of the same length (horizontal axis); the vertical axis represents relative fluorescence intensity. The CDR3 size profiles of the 24 TCR BV families of a healthy individual and of a patient with PNH are shown. Numbers in the right upper corner indicate the corresponding BV family. A diverse (normal) repertoire consists of 6 to 9 peaks distanced from each other by exactly 3 nucleotides (1 codon), and distributed in a Gaussian or nearly Gaussian fashion. As determined by the 3-criteria analysis (see “Patients, materials, and methods”), in this healthy individual, TCR family BV18 is skewed. In the patient with PNH, families BV3, BV7, BV9, BV14, BV16, BV20, BV21, and BV24 are skewed.
R2 values computed for each profile by quadratic regression are a measure of the closeness of the profile to a Gaussian curve and provide an overall measurement of skewness of the TCR BV repertoire. Comparison of the mean R2 values of the 2 control groups, ie, healthy individuals and transfused hemoglobinopathy patients, revealed no significant difference (meanR2 value 0.91 vs 0.89, respectively,P > .50). Therefore, the 2 control groups were combined for further analyses. The overall mean R-square value of the TCR BV repertoire of patients with PNH was significantly lower than the overall mean R-square value of the control group (meanR2 0.825 vs 0.906, respectively,P < .001) (Table 2). In addition, 7 TCR BV families (BV7, 8, 9, 11, 12, 17, and 18) had significantly lower mean R2 values compared with the control group (Table 2).
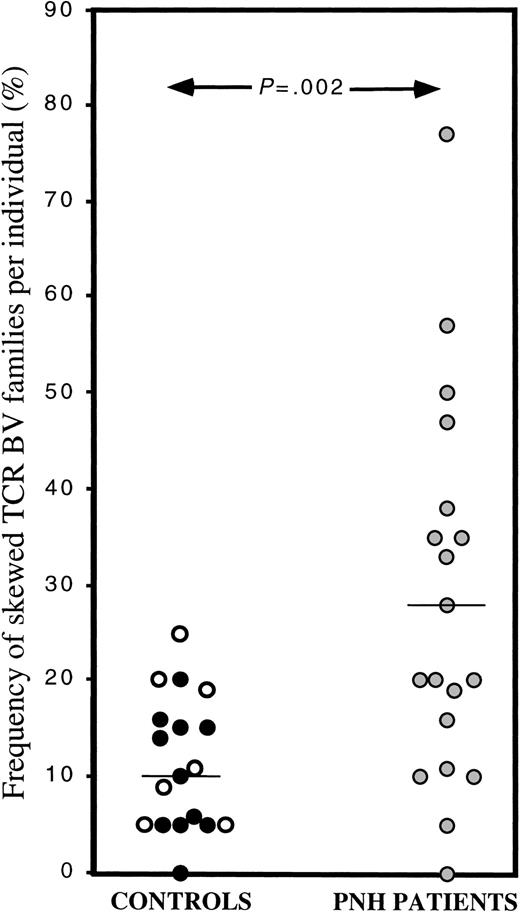
The 3-criteria analysis (see “Patients, materials, and methods”) enabled us to classify individual TCR BV CDR3 mRNA profiles as normal (diverse) or abnormal (skewed). Comparison of the frequency of skewed TCR BV families per individual between normal and transfused hemoglobinopathy controls by using the 3-criteria analysis revealed no significant difference (mean 10.1% ± 6.2% vs 13.4% ± 7.9%,P = .33) and therefore, again the 2 control groups were combined. The mean frequency of skewed TCR BV families per individual in the control group was 11.4% ± 6.9%, in agreement with previous reports.19 30-32 In contrast, the mean frequency of skewed TCR BV families per individual was significantly (P = .002) higher in the patients with PNH (28% ± 19.6%) compared with the control group (11.4% ± 6.9%). In 42% (8/19) of the patients with PNH, we studied, the frequency of skewed BV families lay 2 SD above the mean frequency of skewed BV families in the control group (Figure 2).
Skewing in individual TCR BV families as determined by the 3-criteria analysis.
In this scattergram, the frequency of skewing in individual TCR BV family in the control group (black circles: healthy individuals, white circles: transfused, sickle cell disease or thalassemia patients) and the PNH patient group (gray circles) is shown. The mean frequency of skewing in the control and patient groups are 11.4% and 28%, respectively, P = .002.
In addition, the overall proportion of individuals with skewed repertoire per TCR BV family was numerically higher in the PNH group than in the control group in all but one family (Table3). In the TCR BV families 4, 7, 23, and 24 the frequency of individuals with skewed repertoire was significantly higher in the PNH group compared with the control group (Table 3).
Clonal analysis within individual TCR BV families
An abnormally high peak in a TCR BV profile might be due to the accumulation of mRNA transcripts either of the same length but of a different sequence, reflecting a polyclonal T-cell expansion; or it might be due to the accumulation of transcripts that have not only the same length but also the same sequence, reflecting a clonal T-cell expansion. The use of BJ “run off” analysis (see “Patients, materials, and methods”) allows to discriminate between the 2 possibilities: If the respective peak is polyclonal, we would predict that all 13 BV-BJ profiles will be diverse. If the peak is monoclonal, one or possibly 2 BC-BJ profiles will be severely skewed. To establish that the TCR BV abnormalities we observed in the T-cell repertoire of our patients reflect indeed clonal expansions, we performed BJ “run off” reactions.
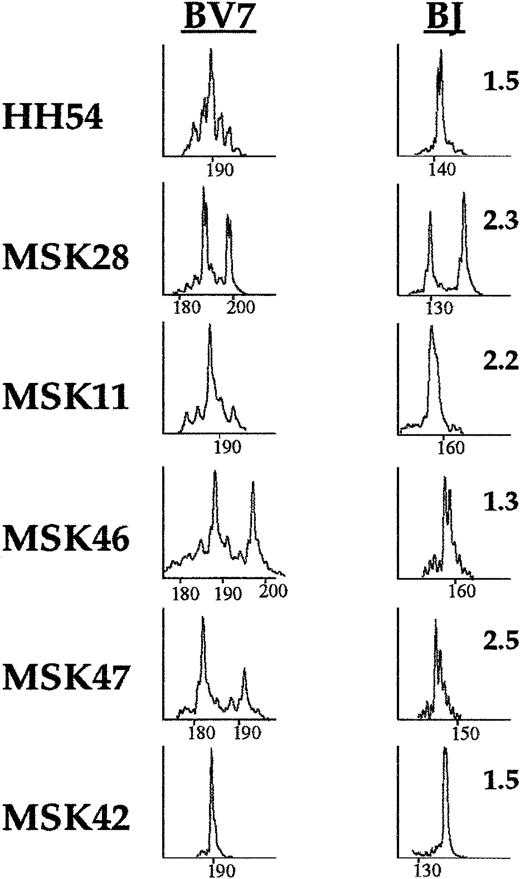
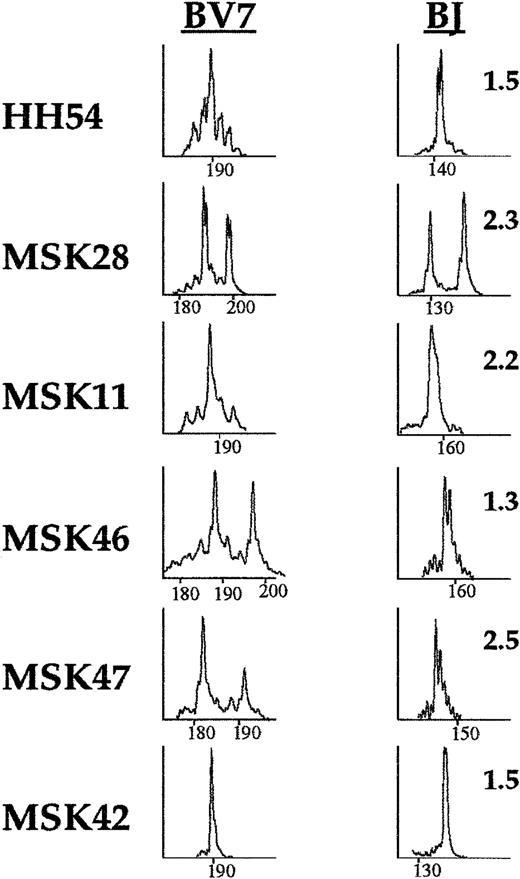
Family TCR BV7 was selected for further analysis of the TCR BJ usage because it was identified as the most frequently skewed during the TCR BV screening (see above). Of the 8 patients with family BV7 skewing, we performed TCR BJ “run-off” analysis in 6. In all 6, TCR BJ “run-off” analysis revealed single peaks, strongly suggesting the presence of clonal T-cell expansions underlying the TCR BV7 repertoire abnormalities (Figure 3).
Skewing of the TCR BV7 repertoire in patients with PNH and identification of the BJ gene segment used in the clonal BV7 T-cell expansion.
Eight PNH patients displayed skewing in the TCR family BV7. In 6 patients further refinement of the TCR family BV7 (left column) repertoire was performed by using FAM-labeled primers, specific for the 13 different BJ gene segments. The BJ segment used in the clonal expansion was identified as a single peak or in the case of patient MSK28, as 2 single peaks (right column).
In 2 cases, patients MSK42 and HH54 (Figure 3), the CDR3 region of the TCR BV7-BJ1.5 expanded T-cell population was sequenced. In patient MSK42, cloning and sequencing of the BV7-BJ1.5 PCR product revealed that, in all 4 clones, the predicted amino acid sequence of the respective segments of the V-NDN-J recombination of the CDR3 region was CASS-QGYI-SNQPQH. Moreover, the same amino acid sequence was confirmed by direct sequencing of the TCR BV7-BC PCR product, indicating that in this patient, a single T-cell clone was responsible for making up at least 80% of the repertoire of family TCR BV7. In line with this, the TCR BV7-BC profile consisted of an almost single peak (Figure 3). In patient HH54, after cloning and sequencing of the BV7-BJ1.5 PCR product, we found that in 10 of 13 clones, the V-NDN-J sequence was CASS-PLAG-SNQPQH. The identification of dominant T-cell clonotypes in these 2 patients confirms that the T-cell expansions identified by TCR BV-BC and BV-BJ analysis are truly clonal.
Long-term persistence of CDR3 profile abnormalities
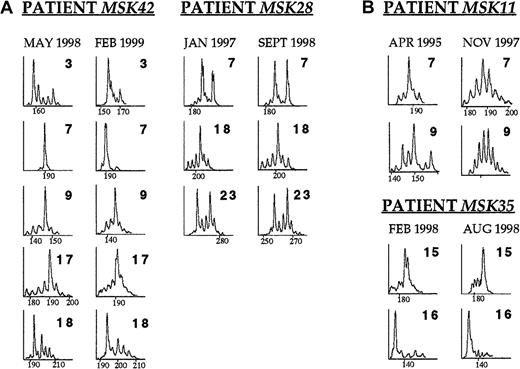
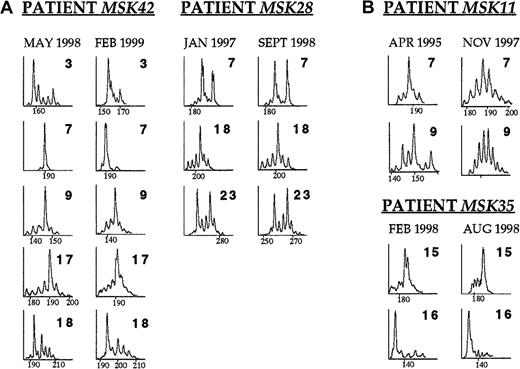
The TCR BV abnormalities of patients MSK42 and MSK28 remained unchanged over a period of 9 and 19 months, respectively (Figure4A). During this time, both patients were clinically and hematologically stable and did not require transfusion.
The time course of the TCR BV repertoire in selected patients with PNH.
(A) Patients MSK42 and MSK28 displayed skewing in several TCR BV families that remained unchanged over a period of 9 and 19 months, respectively. (B) Patient MSK11 received ATG in April 1995 because of worsening cytopenias. CDR3 profile analysis on blood sample taken just before the commencement of the treatment revealed skewing in families TCR BV7 and BV9. The patient responded to ATG with remarkable improvement of the hematologic parameters and CDR3 profile analysis on blood sample 2.5 years later showed diverse repertoire profiles in both families BV7 and BV9. Patient MSK35 received ALG in February 1998 because of severe hemolytic anemia. After a transient response, 6 months later the hematologic parameters were as before the commencement of the treatment. CDR3 size analysis performed on samples drawn before the initiation of treatment and 6 months later showed identical skewing patterns in TCR families BV15 and BV16.
Effect of immunosuppressive treatment on the TCR BV profiles
In 2 patients, we had an opportunity to obtain serial data on TCR BV profiles before and after immunosuppressive treatment. Patient MSK11, having had antithymocyte globulin (ATG) in 1985 with good response, was given a second course of ATG in 1995 because of progressing thrombocytopenia and neutropenia. CDR3 size analysis just before the administration of the second ATG course showed skewing, among others, in TCR families BV7 and BV9. The patient responded to ATG with significant improvement of the platelet and neutrophil count, sustained to date. Analysis of a sample from 2 years later, showed an almost Gaussian distribution in families BV7 and BV9 (Figure 4B). In contrast, patient MSK35 showed only a partial and short-lived response to antilymphocyte globulin (ALG) treatment and TCR BV mRNA size analysis before and after therapy showed little change (Figure4B).
Discussion
Autoreactive T cells may play an important role in the cellular pathogenesis of PNH3,16 17; however, direct evidence for this mechanism has been scarce. In this study, based on the skewing of the TCR BV mRNA size profiles, we have established that there is a high frequency of clonal T-cell expansions in the peripheral blood of patients with PNH.
By using 2 complementary approaches, we found (i) a significantly higher degree of overall skewness of the T-cell repertoire in patients with PNH than in appropriate control groups (meanR2 0.91 vs 0.82, respectively,P < .001; Table 2) and (ii) patients with PNH compared with controls displayed a more than 2-fold increase in the frequency of skewed families per individual (28% ± 19.6% vs 11.4% ± 6.9%, respectively, P = .002; Figure 2). Depending on which of these 2 criteria we adopt, from 4 to 7 TCR BV families were significantly more frequently skewed in patients PNH than in control individuals at a nominal level of P < .05 (Tables 2 and3).
In 6 patients who had a skewed TCR BV7 family profile, the usage of various BJ segments was determined by using primers specific to each of the 13 BJ segments. This analysis revealed that in each case a single, severely skewed BJ gene used in association with the BV7 gene accounted for the observed skewness; in addition, sequencing of the CDR3 region in patients MSK42 and HH54 revealed dominant T-cell clonotypes. These findings provide direct evidence that clonal T-cell expansions underlie the skewed repertoires identified by TCR BV-BC analysis.
Although the correlation between response to immunosuppressive treatment and the dynamics of the TCR BV CDR3 size profiles in patients MSK11 and MSK35 may have been fortuitous, it is tempting to speculate that this correlation has biologic significance. If so, it could be that, in patient MSK11, ATG was effective in reducing the frequency or size of the pathogenic T-cell clones identified by CDR3 size analysis. In contrast, in patient MSK35, who failed to respond to treatment, ATG was ineffective so that the T-cell expansions identified before ATG were unchanged 6 months later.
Because it has been postulated that PNH and IAA share the same T-cell–mediated immunopathogenesis, analysis of the TCR repertoire might reveal abnormalities common to the 2 diseases. “Immunoscope” study of the TCR BV CDR3 mRNA size analysis in patients with IAA has been reported by 2 groups. In an earlier report, Manz et al39 failed to identify significant skewing in the peripheral blood T-cell repertoire of 4 patients with IAA. However, in a recent study of 18 Japanese patients with IAA, Zeng et al19 reported increased frequency of T-cell repertoire skewing in the bone marrow T cells of 18 patients with IAA. The scoring of the T-cell repertoire abnormalities was not based on a mathematical analysis, as it was in our work, but on visual inspection. Based on this approach, Zeng at al19 found that patients with IAA compared with healthy controls had a 2-fold increase in the mean frequency of TCR BV family abnormalities. We demonstrated a similar increase in the mean frequency of abnormal TCR BV families in the patients with PNH, using either visual scoring (3-fold increase, data not shown) or the more objective analysis described in “Patients, materials and methods” (2.5-fold increase, Figure 2), indicating that the 2 scoring approaches yield comparable results. This is further supported by the fact that the mean frequency of skewed TCR BV families per control individual was very similar when visual (Zeng et al19: 11.0% ± 6.4%, this study: 9% ± 10.4%) and objective (11.4% ± 6.9%: this study) scoring was applied. Another common finding between the 2 studies of patients with IAA and patients with PNH is the emergence of subgroups of patients with distinctly higher mean frequency of skewed TCR BV families. In a subgroup of 5 of 5 cyclosporine A-dependent patients who had the HLA-DRB1*1501 allele, Zeng at al19 found that the mean frequency of skewing was more than 40%. In our study, in a proportion (42%, 8 of 19) of the patients with PNH, the frequency of skewed TCR BV families lay 2 SD above the mean frequency of skewed TCR BV families in the control group (Figure 2). Whether this finding reflects clinical heterogeneity of PNH, as it does in Japanese patients with IAA, and/or pathogenetic heterogeneity, remains to be seen. Finally, it is of interest, that 38% (7 of 18) of all patients with IAA reported by Zeng et al19 (including 3 of the 5 HLA-DRB1*1501 positive patients) had skewing in TCR family BV7. Again, this frequency is very close to what we observed with respect to family BV7 in our patients (42%; Table 3).
In conclusion, we found an increased frequency of clonal T-cell expansions, at least in a proportion of patients PNH, and long-term persistence of such expansions in selected patients; these findings would support a T-cell–mediated mechanism for the pathogenesis of PNH. In addition, the presence of similar immune perturbations in patients with PNH and patients with IAA would be in line with the notion that the 2 disorders share a common, immune pathogenesis. Finally, because relevant in vitro experiments have yielded conflicting results,40-43 the identification of certain TCR BV families with higher frequency of skewing (for example, TCR family BV7) makes the ex vivo isolation and functional assaying of potentially pathogenic T cells possible. This, in turn, could facilitate studies aiming at identifying the basis of the survival advantage that the PNH HSCs possess compared with their normal counterparts, in the context of a T-cell response directed against HSCs.
Acknowledgments
We thank Dr Jianlin Xu and Jason Angell for help with the use of the ABI 377 automated sequencer, and Dr Joel Le Maoult for advice and helpful discussions. We also thank Dr Bruno Rotoli and all colleagues who referred patients to our PNH clinic and/or provided us with blood samples.
Supported by grants from the National Institutes of Health (no. ROI HL56778-04 to L.L. and no. AG-14669 to M.E.W.).
The publication costs of this article were defrayed in part by page charge payment. Therefore, and solely to indicate this fact, this article is hereby marked “advertisement” in accordance with 18 U.S.C. section 1734.
References
Author notes
Lucio Luzzatto, Direzione Scientifica, Istituto Nazionale per la Ricerca sul Cancro, Largo Rosanna Benzi, 10, 16132 Genova, Italy; e-mail: luzzatto@hp380.ist.unige.it.

