Differences in engraftment potential of hematopoietic stem cells (HSCs) in distinct phases of cell cycle may result from the inability of cycling cells to home to the bone marrow (BM) and may be influenced by the rate of entry of BM-homed HSCs into cell cycle. Alternatively, preferential apoptosis of cycling cells may contribute to their low engraftment potential. This study examined homing, cell cycle progression, and survival of human hematopoietic cells transplanted into nonobese diabetic severe combined immunodeficient (NOD/SCID) recipients. At 40 hours after transplantation (AT), only 1% of CD34+ cells, or their G0(G0CD34+) or G1(G1CD34+) subfractions, was detected in the BM of recipient mice, suggesting that homing of engrafting cells to the BM was not specific. BM of NOD/SCID mice receiving grafts containing approximately 50% CD34+ cells harbored similar numbers of CD34+ and CD34− cells, indicating that CD34+ cells did not preferentially traffic to the BM. Although more than 64% of human hematopoietic cells cycled in culture at 40 hours, more than 92% of cells recovered from NOD/SCID marrow were quiescent. Interestingly, more apoptotic human cells were detected at 40 hours AT in the BM of mice that received xenografts of expanded cells in S/G2+M than in recipients of G0/G1 cells (34.6% ± 5.9% and 17.1% ± 6.3%, respectively; P < .01). These results suggest that active proliferation inhibition in the BM of irradiated recipients maintains mitotic quiescence of transplanted HSCs early AT and may trigger apoptosis of cycling cells. These data also illustrate that trafficking of transplanted cells to the BM is not selective, but lodgment of BM-homed cells may be specific.
Introduction
Homing of transplanted hematopoietic stem cells (HSCs) to the bone marrow (BM) of recipient animals is an essential step in engraftment and maintenance of hematopoiesis. It is believed that homing, a process defined as migration of cells to target tissues, directs cells during ontogeny from the yolk sac and/or para-aortic splanchnopleura to the fetal liver and finally to fetal BM1-4 where hematopoiesis is maintained throughout adult life. However, processes governing trafficking, migration, and homing of HSC, both at the molecular and cellular levels, remain poorly understood. Although some studies lend support to the involvement of particular adhesion molecules in both homing and egress of HSCs to and from the BM,5-10 other studies challenge the concept of directed homing to the BM and maintain that homing is a nonspecific process.11,12 Under such circumstances, it is believed that transplanted HSCs are distributed in the host on the basis of organ mass and complexity of the capillary bed of each organ.11 Nonetheless, directed trafficking to the BM of certain phenotypes of hematopoietic progenitor cells (HPCs), but not others, has been documented.13 Similarly, enhanced engraftment potential of candidate HSCs expressing a particular repertoire of adhesion molecules has been demonstrated.14 15
On trafficking to the marrow, HSCs lodge specifically in and become anchored to specialized niches of the marrow microenvironment where they undergo massive cell proliferation, resulting in the establishment and maintenance of a new hematopoietic system. Murine studies examining the fate of transplanted cells in nonablated hosts documented that as early as 12 hours after transplantation (AT) in excess of 50% of long-term engrafting cells enter active phases of cell cycle.16 Together, homing studies and those examining the fate of transplanted HSCs suggest that cells incapable of supporting long-term engraftment may suffer from 2 distinct, but not mutually exclusive, defects, precluding them from either homing to the BM or entering active phases of cell cycle. The latter potential defect is rather intriguing in light of our previous demonstration that engrafting mobilized peripheral blood cells (those capable of sustaining hematopoiesis in an appropriate host) are predominantly found in the G0 phase of cell cycle, whereas those in G1 are almost devoid of marrow repopulating potential.17 This finding suggests that following transplantation, cells in G0 begin to divide after homing to the BM, whereas proliferation of BM-homed G1 cells is halted. Alternatively, it is perceivable that, when examined head to head, engrafting cells home to the BM where they can be detected, while nonengrafting cells fail to traffic to the marrow and initiate hematopoiesis.
Although these hypotheses may be theoretically easy to examine in a transplantation model, realistically, technical difficulties involved in tracking and isolating small numbers of candidate HSCs in recipient animals contributed to the near complete absence of such studies. However, recent advances in the use of xenogeneic transplantation models11,18 or tracking of transplanted cells with fluorescent dyes19-21 made such investigations possible. Only one recent study21 examined proliferation kinetics of transplanted murine cells shortly after transplantation and assessed comparatively the homing efficiency of engrafting versus nonengrafting phenotypes.
In the absence of direct and conclusive measurements of these parameters for human HSCs, we designed a series of experiments to evaluate the homing efficiency, cell cycle kinetics, and survival of quiescent and cycling human CD34+ cells transplanted into conditioned nonobese diabetic severe combined immunodeficient (NOD/SCID) recipients. To better understand the dynamics of HSC homing and engraftment under different transplantation conditions, the fate of freshly isolated and ex vivo–expanded BM and mobilized peripheral blood (MPB) CD34+ cells or fractions of CD34+ cells was examined. We report that homing of fresh or ex vivo–expanded cells to the BM microenvironment is not specific and that immediately after transplantation BM-homed cells remain quiescent for a considerable period of time regardless of the phenotype or cell cycle status of these cells.
Materials and methods
Collection, purification, and fractionation of human CD34+ cells
BM and MPB samples were collected from healthy adult volunteers after obtaining informed consent according to the guidelines of the Investigational Review Board of Indiana University School of Medicine. None of the BM or MPB samples were derived from the same donor. Mobilization was achieved by daily granulocyte colony-stimulating factor administration at 5 μg/kg (maximum of 480 μg/day) for 4 consecutive days. MPB cells were collected by apheresis on day 5. MPB CD34+ cells were isolated by immunomagnetic selection with the use of an Isolex 300i system (Nexell, Irvine, CA). BM CD34+ cells were isolated by magnetic-activated cell sorting according to the manufacturer's directions (Miltenyi Biotec GmbH, Bergisch Gladbach, Germany).
Cell staining and sorting
Selected CD34+ cells were either sorted for further purification of CD34+ cells or for the isolation of cells in G0 or G1 phases of cell cycle. Selected CD34+ cells were stained with phycoerythrin (PE)–conjugated CD34 monoclonal antibodies (Becton Dickinson Immunocytometry Systems [BDIS], San Jose, CA) and fluorescein isothiocyanate (FITC)–conjugated CD38 (Immunotech, Westbrook, ME) to facilitate identification of total CD34+ cells that were sorted on either a FACStar plus or a FACS Vantage (BDIS). Cells isolated in different phases of cell cycle were first stained with Hoechst 33342 (Hst; Molecular Probes, Eugene, OR) and Pyronin Y (PY; Polysciences, Warrington, PA) as previously described.22Briefly, Hst was prepared at 1.6 μM in Hst buffer consisting of Hanks balanced salt solution (HBSS; BioWhittaker, Walkersville, MD) supplemented with 20 mM HEPES (BioWhittaker), 1 g/L glucose, 10% fetal calf serum (FCS; Hyclone, Logan, UT), and verapamil at 50 μM (Sigma, St Louis, MO) with the pH adjusted to 7.2. PY was prepared in the same buffer to deliver a final concentration of 1 μg/mL. Test cells were washed twice in Hst buffer and resuspended in 1.5 mL 1.6 μM Hst solution (up to 5 × 10⁶ cells) at 37°C for 45 minutes at which time PY was added (without prior washing) to a final concentration of 1 μg/mL. Incubation was continued for another 45 minutes. Cells were washed once in chilled Hst buffer and either allophycocyanin (APC)– or FITC-conjugated CD34 monoclonal antibodies (Caltag Laboratories, Burlingame, CA) were added to the cells that were incubated on ice for 20 minutes then washed. Viability of sorted cells always exceeded 98%. Purity of sorted G0 and G1 cells always exceeded 90%.
Short-term culture and staining with CFSE
Selected (not purified) CD34+ cells were cultured in complete medium consisting of Iscoves modified Dulbecco medium (BioWhittaker) supplemented with 10% FCS, 2 mM L-glutamine (BioWhittaker), and antibiotics (penicillin 100 U/mL and streptomycin 100 μg/mL; BioWhittaker). Cells were cultured at 0.5 × 10⁶ cells/mL and were supplemented with a 6-cytokine combination containing human stem cell factor (SCF) at 100 ng/mL, Flt-3 ligand at 50 ng/mL, megakaryocyte growth and development factor (MGDF) at 50 ng/mL, interleukin-3 (IL-3) at 100 ng/mL, IL-6 at 100 ng/mL, and granulocyte-macrophage colony-stimulating factor (GM-CSF) at 20 ng/mL. All cytokines were a kind gift from Amgen (Thousand Oaks, CA). Cytokines were added at the initiation of the culture and every 48 hours thereafter. Between days 5 and 7, cells were harvested, washed, and counted. A sample was immunophenotyped to determine the percentage of CD34+ cells. When needed, cells were stained with Hst only as described above and sorted to yield cells in G0/G1 or in S/G2+M as previously described.15
Fresh or cultured cells were stained with the protein dye CFSE before transplantation. Cells were washed and resuspended at less than 5 × 10⁶ cells/mL in serum-free HBSS. CFSE (Molecular Probes) was added at 1 μM, and the cells were incubated for 10 minutes at 37°C. Uptake of the dye was stopped by the addition of chilled HBSS containing 10% FCS, and the cells were washed in this medium 3 times. Cells were resuspended in complete medium and, when possible, were incubated 2 to 4 hours at 37°C to allow excess dye to efflux. Cells were then washed and resuspended for transplantation.
Transplantation of test cells into NOD/SCID mice
NOD/LtSz-scid/scid (NOD/SCID) mice23 were bred and housed at Indiana University and were kindly provided by Dr D. A. Williams (Indianapolis, IN). Mice were housed in microisolators under pathogen-free conditions and received autoclaved food and acidified water ad libitum. Animal experiments were performed in accordance with institutional guidelines approved by the Animal Care Committee of Indiana University School of Medicine. Nine- to 12-week-old NOD/SCID mice were sublethally irradiated with 3 Gy from a 137Cs source. Mice received by intravenous injection as accessory cells between 8 and 12 × 106 nonadherent CD34−adult BM or MPB cells irradiated with 80 Gy and were transplanted 2 to 24 hours later. Between 6 × 10⁵ and 3 × 10⁶ cells were transplanted per recipient, depending on the availability of cells. All mice in the same experiment received grafts containing equal numbers of cells. At specific time points AT (up to 72 hours AT), blood was collected from the retro-orbital plexus. Mice were killed by cervical dislocation, and the spleen and BM were collected. Single-cell suspensions were prepared from these tissues, and red blood cells were lysed in 0.155 M NH4Cl, 0.01 M KHC03, and 0.1 mM EDTA. Cell suspensions were washed twice and resuspended in Iscoves modified Dulbecco medium with 10% FCS for further analysis. Because of the effect of radiation, cellularity of recipient BM and spleen declined 48 hours AT to 10% to 25% of that observed in nonirradiated mice.
Analysis of homing and isolation of human chimeric cells
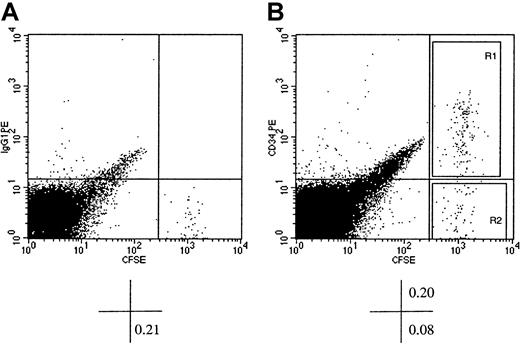
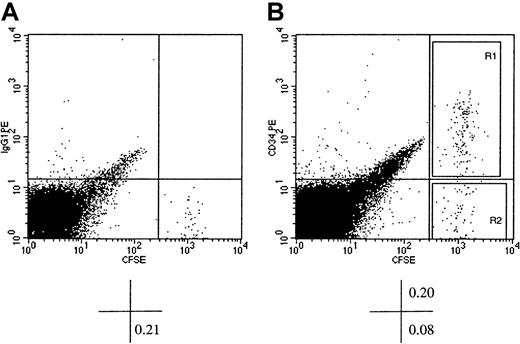
Human cells in the BM, spleen, or blood of recipient mice were detected flow cytometrically by visualization of CFSE-stained cells over a background of unlabeled murine cells (Figure1). The bright fluorescence of CFSE was sufficient to separate labeled human cells from unlabeled murine cells by at least 1 log. When required, murine BM or spleen cells were stained with PE- or APC-conjugated antihuman CD34 monoclonal antibodies to permit the isolation of CFSE+CD34+ and CFSE+CD34− cells by cell sorting (Figure 1). Percentages of CFSE+ cells were used to calculate total numbers of human cells recovered by using cell counts from the spleen and adjusted cell counts from the BM, depending on the bones harvested for analysis.24 Percentage of CFSE+ cells was calculated from listmode files containing between 105 and 5 × 10⁵ events after light scatter gating of small and large cells and exclusion of debris and red cells. For cell sorting, all the cells from an individual tissue were sorted when needed, or sorting was halted when enough donor-derived cells were collected for further analysis.
Flow cytometric analysis of murine BM cells of NOD/SCID recipients of CFSE-stained xenografts of human CD34+ cells.
Human BM CD34+ cells were stained with CFSE and transplanted into conditioned NOD/SCID recipients. At 40 hours AT, mice were killed, and BM cells were stained with PE-conjugated immunoglobulin G1 (isotype control, dot plot A) or PE-conjugated CD34 (dot plot B) and analyzed flow cytometrically. CFSE fluorescence was detected on the x-axis and that of PE on the y-axis. Dot plot A shows CFSE+ cells with background level of PE fluorescence (identified by the horizontal cursor) clearly distinguishable from murine CFSE− BM cells. In dot plot B, which displays light scatter gated events from a listmode file containing 1.5 × 10⁵ events, a prominent population of CFSE+CD34+ cells can be identified. The percentage of cells contained in pertinent quadrants is given below each dot plot. Sort windows R1 and R2 in dot plot B were used to isolate CFSE+CD34+ and CFSE+CD34− cells, respectively. Please note that the width of the sorting windows R1 and R2 was sufficient to include all detectable CFSE+ cells regardless of their proliferative history in the BM of recipient mice.
Cell cycle analysis
Cell cycle status of test cells was determined by the analysis of propidium iodide (PI)–stained cells as previously described.25 Cell pellets were stained for 30 minutes with equal volumes of phosphate-buffered saline (PBS) containing 0.1 mg/mL PI (Behring Diagnostics, La Jolla, CA) and 0.6% Nonidet P-40 and 2 mg/mL RNAse (both from Sigma) prepared in PBS. Cell cycle analysis was performed on a FACScan (BDIS), and data were analyzed by using CellQuest software (BDIS).
Assessment of apoptosis
Various cell fractions (CFSE+ cells isolated from recipients or cells cultured with or without cytokine supplementation) were evaluated for apoptosis by the analysis of Annexin V–positive cells. Cell pellets were stained with APC-conjugated CD34 when needed and PE-conjugated Annexin V (BDIS) at 4°C for 20 minutes. Cells were washed once in DMEM (BioWhittaker) supplemented with 15% FCS. Cells were resuspended in 200 μL DMEM and 10 μL PBS containing 10 μg/mL PI for assessment of dead cells. Analysis was performed on a FACSCalibur (BDIS), and data were analyzed by using Cellquest software. Only CFSE+PI− cells were considered for analysis of CD34 and Annexin V.
Statistical analysis
Data are reported as mean ± SD and were analyzed by using a Student t test. Differences yielding P values < .01 were considered statistically significant.
Results
Preliminary studies indicated that the highest degree of cell recovery from the BM and spleen of transplantation recipients was between 36 and 48 hours AT (data not shown). This observation is consistent with that of Lanzkron et al21 who determined that percentage of PKH26-labeled murine cells from syngeneic recipients was maximal at 48 hours AT. As such, all subsequent analyses (unless indicated otherwise) were performed between 40 and 48 hours AT and are reported as 40 hours. A very small number of CFSE+ cells was detected in the peripheral blood of recipient animals 24 hours AT (< 0.05%), and at 40 hours AT transplanted cells were almost undetectable in the blood. Therefore, data from the analysis of peripheral blood will not be presented. A total of 34 experiments using 1 to 3 animals per group were performed. Data from like experiments were pooled.
Cell cycle status of BM- and spleen-homed CD34+cells
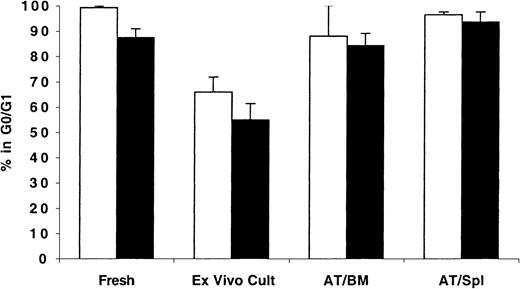
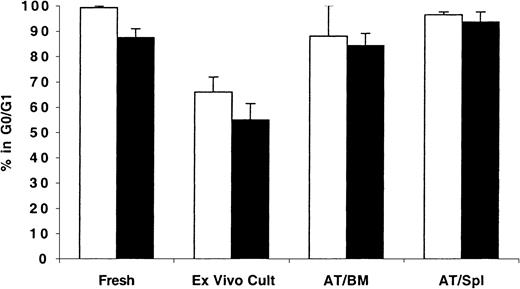
As expected, freshly isolated MPB and BM CD34+ cells were predominantly in G0/G1 phases of cell cycle (99.2% ± 0.6% and 88.4% ± 3.7%, respectively; Figure2). When maintained in short-term culture for up to 48 hours, these cells exited G0/G1efficiently, and less than 66% of either population was in G0/G1. However, cells recovered from NOD/SCID mice 40 hours AT were quiescent with more than 82% of either population in the BM or spleen of these recipients detected in G0/G1 (Figure 2).
Cell cycle analysis of fresh, ex vivo–cultured and BM- and spleen-homed MPB and BM CD34+ cells.
CD34+ cells from fresh MPB (light bars) or BM (dark bars) were enriched by immunomagnetic selection and stained with CFSE as described in “Materials and methods.” A sample was retained for cell cycle analysis at time zero and for initiating short-term ex vivo cultures. Cells in culture were maintained with a 6-cytokine cocktail containing human SCF at 100 ng/mL, Flt-3 ligand at 50 ng/mL, MGDF at 50 ng/mL, IL-3 at 100 ng/mL, IL-6 at 100 ng/mL, and GM-CSF at 20 ng/mL. Remaining cells were transplanted into conditioned NOD/SCID mice, and 40 hours AT bone marrow (AT/BM) and spleen (AT/Spl) cells were recovered from individual mice and human CFSE+ cells were isolated by flow cytometric cell sorting. Sorted cells and cells maintained in culture were stained with PI and analyzed for cell cycle status. Each bar represents the mean ± SD of 2 to 6 measurements for MPB samples (from 3 independent experiments) and 4 to 5 measurements for BM samples (from 5 independent experiments). Differences between fresh and cultured BM and MPB cells,P < .01; differences between ex vivo–cultured BM and MPB and BM- or spleen-homed cells, P < .01; differences between fresh and BM- or spleen-homed BM and MPB cells,P > .01.
Effect of in vivo administration of cytokines on cell cycle kinetics of transplanted cells
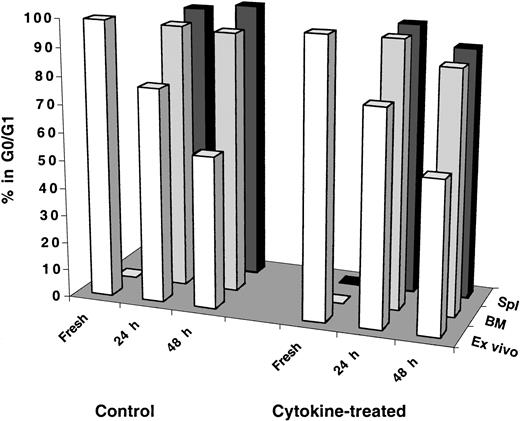
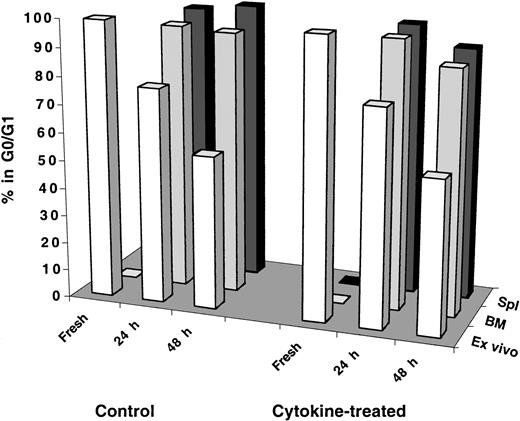
Results shown in Figure 2 provoked the question of whether transplanted human cells receive adequate cytokine stimulation in the mouse microenvironment to induce proliferation shortly after transplantation. To investigate this question, recipient mice were injected intraperitoneally with a cocktail of 7 human cytokines (see legend of Figure 3 for details) on days −2, −1, 0, and +1 relative to the transplantation of test cells that was performed, according to this schema, on day 0. Mice were killed, and BM and spleen cells were collected for analysis 24 and 48 hours AT. As can be seen in Figure 3 regardless of the tissue analyzed, transplanted cells remained quiescent in cytokine-treated recipients to the same level observed in control mice even at 48 hours AT. It is important to point out that cells maintained in vitro for 48 hours with a similar cytokine cocktail mixture (with adjusted concentrations for in vitro culture) were capable of exiting G0/G1and progressing normally through active phases of cell cycle (Figure 3).
Cell cycle analysis of fresh, ex vivo–cultured and BM- and spleen-homed MPB and BM CD34+ cells recovered from control and cytokine-treated NOD/SCID recipients.
CD34+ cells were isolated from fresh MPB or BM and stained with CFSE as described in “Materials and methods.” A sample was retained for cell cycle analysis at time zero and for initiating short-term ex vivo cultures maintained as described in the legend of Figure 2. Remaining cells were transplanted into control and cytokine-treated, conditioned NOD/SCID mice. Cytokine treatment of recipient mice consisted of 4 daily intraperitoneal injections on days −2, −1, 0 (day of transplantation), and +1 of a cytokine cocktail delivering per mouse 10 μg SCF, 5 μg Flt-3 ligand, 5 μg MGDF, 6 μg IL-3, 2 μg IL-6, 6 μg GM-CSF, and 10 U erythropoietin. At 24 and 48 hours AT, BM and spleen (Spl) cells were recovered from individual mice, and human CFSE+ cells were isolated by flow cytometric cell sorting. Cell cycle status of all groups of cells was determined by PI staining. Each bar represents the mean of 1 to 3 measurements of MPB or BM samples at the 24-hour time point and 2 to 3 measurements at the 48-hour time point from 3 independent experiments. Statistical analysis of measurements made at 48 hours between control and cytokine-treated recipients was not significant (P > .2).
Cell cycle status of BM- and spleen-homed ex vivo–expanded CD34+ cells
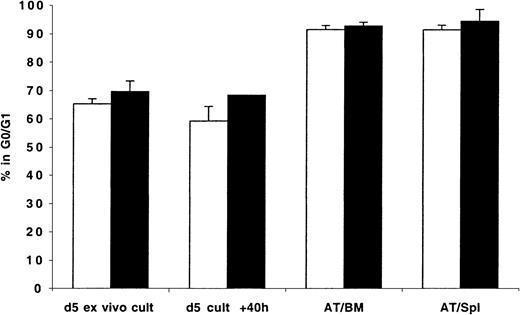
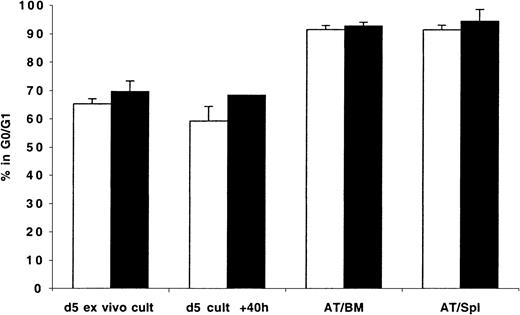
That transplanted CD34+ cells, even when stimulated with exogenously administered cytokines, do not enter into active phases of cell cycle in recipient mice prompted us to examine whether transplanted cycling cells continue their cell cycle progression after lodgment in the BM. To that effect, MPB and BM CD34+ cells were first cultured in vitro for 5 to 6 days in the presence of 6 cytokines. These expanded cells were harvested, stained with CFSE, and transplanted into conditioned NOD/SCID mice. As can be seen in Figure4, expanded MPB and BM CD34+cells were actively cycling by day 5 with 65% and 70% in G0/G1, respectively. In contrast, in excess of 91% of either MPB- or BM-expanded CD34+ cells isolated from either the BM or spleen of recipient mice 40 hours AT were in G0/G1 (Figure 4), suggesting that cycling of these cells was arrested after their lodgment in these organs. Cells maintained in culture continued to cycle normally (Figure 4). Whether in vivo administration of exogenous cytokines prevents cell cycle arrest of transplanted ex vivo–expanded cells was not investigated.
Cell cycle analysis of ex vivo–expanded MPB and BM CD34+ cells recovered from the BM and spleen of NOD/SCID transplantation recipients 40 hours AT.
CD34+ cells were isolated from fresh MPB (light bars) and BM (dark bars) and cultured in vitro as described in “Materials and methods” and in the legend of Figure 2. On day 5, cells were harvested, washed, stained with CFSE, and transplanted into conditioned NOD/SCID mice. A sample was retained for cell cycle analysis of day 5 cells (d 5 ex vivo cult), while another was maintained in culture for an additional 40 hours (d 5 cult + 40 h). Human CFSE+cells were isolated by flow cytometric cell sorting 40 hours AT from BM (AT/BM) and spleen (AT/Spl) cells. Cell cycle status of all groups of cells was determined by PI staining. Each bar represents the mean ± SD of 2 measurements for MPB and 3 to 4 measurements for BM samples from 4 independent experiments.
Cell cycle status of BM- and spleen-homed ex vivo–expanded CD34+ cells in different phases of cell cycle
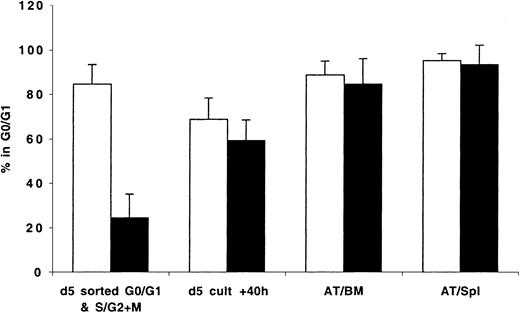
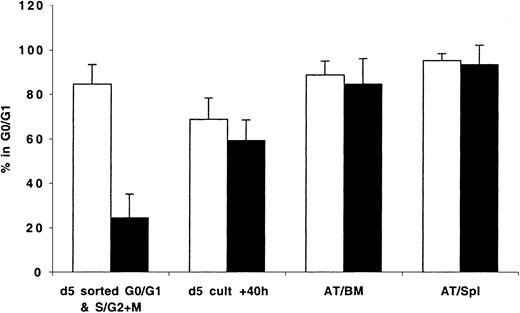
Because transplanted expanded cells contained cells in different phases of cell cycle, it was not possible to determine whether cycling cells trafficked to the BM and to what degree the cell cycle status of BM-homed cells reflected that of cycling or quiescent cells initially contained in the graft. To circumvent these limitations, expanded cells were stained with Hst on days 5 to 7 and sorted to yield cells in G0/G1 or in S/G2+M that were then transplanted and assayed 40 hours later. Data generated from these studies are shown in Figure 5. Cultured cells isolated in G0/G1 or S/G2+M (purities = 85.0% and 76.0%, respectively; Figure 5) progressed through cell cycle as expected when maintained in vitro. Only 69% of sorted G0/G1 cells remained in G0/G1 at 40 hours later (P < .01, between sorted G0/G1 cells and same cells in culture 40 hours later). Cells in S/G2+M continued their cycle such that at 40 hours 59% of these cells were in G0/G1 (P < .01, between sorted S/G2+M cells and same cells in culture 40 hours later). However, between 84.7% ± 11.3% and 95.1% ± 3.2% of cells recovered from the BM and spleen of recipient mice 40 hours AT were in G0/G1 (Figure 5), including those which 40 hours earlier were predominantly in S/G2+M phases of cell cycle (P < .01, between sorted S/G2+M cells and cells recovered from BM and spleen 40 hours AT). Of interest is that there was no difference in the percentage of cells in G0/G1 among sorted G0/G1 cells before transplantation (84.7%) and AT (88.7% and 95.1% in BM and spleen, respectively).
Cell cycle analysis of mitotically defined groups of ex vivo–expanded MPB and BM CD34+ cells recovered from the BM and spleen of NOD/SCID transplant recipients 40 hours AT.
CD34+ cells were isolated from fresh MPB and BM and cultured in vitro as described in “Materials and methods.” On day 5, cells were harvested, washed, stained with Hst, and sorted to obtain cells in G0/G1 and S/G2+M. These fractions were stained with CFSE and transplanted into conditioned NOD/SCID mice. A sample was retained to confirm, with PI staining, the cell cycle status of sorted G0/G1 (light bars) and S/G2+M (dark bars) cells prior to transplantation (d 5 sorted G0/G1 & S/G2+M), while another was maintained in culture for an additional 40 hours (d 5 cult + 40h). Human CFSE+ cells were isolated by flow cytometric cell sorting 40 hours AT from BM (AT/BM) and spleen (AT/Spl) cells. Cell cycle status of all groups of cells was determined by PI staining. Each bar represents the mean ± SD of 3 to 7 G0/G1 and 3 to 6 S/G2+M measurements from MPB and BM samples from 6 independent experiments.
To follow more closely cell cycle progression of transplanted cells in G0/G1 or S/G2+M, experiments designed to assay cell cycle status of transplanted cells at 3, 16, and 40 hours AT were conducted (Table1). In a design similar to that described above, expanded BM cells in G0/G1 or S/G2+M were transplanted and recovered from the BM of NOD/SCID mice at 3 time points. As expected, G0/G1 cells remained quiescent in the BM of recipient mice throughout the observation period while in culture these cells progressed into S/G2+M normally. However, in the absence of exogenous cytokines in vitro, these cells remained dormant (Table 1). Surprisingly, although a fair number of S/G2+M cells maintained in culture with cytokines progressed into G0/G1 16 hours later and most likely traversed again into S/G2+M by 40 hours (63.7% in G0/G1), similar cells in vivo were unable to reenter S/G2+M and were found predominantly in G0/G1 at 40 hours AT. Of interest is that S/G2+M cells maintained in vitro without cytokines progressed normally into G0/G1 (Table 1), confirming that cells that had progressed beyond the G1checkpoint are capable of going into mitosis in the absence of mitogenic signals.
Cell cycle status of BM- and spleen-homed G0CD34+ and G1CD34+cells
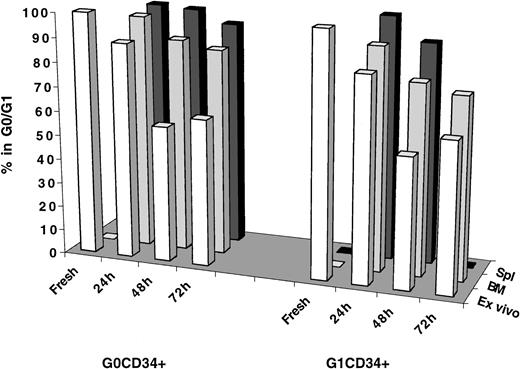
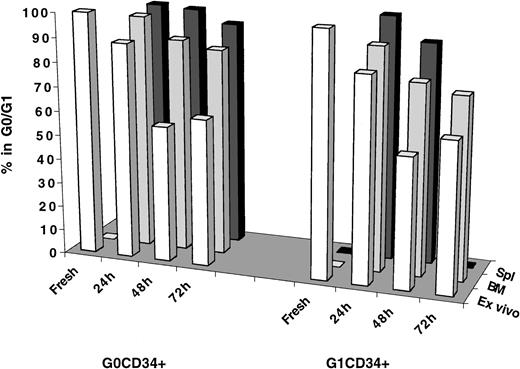
Investigations into cell cycle progression of transplanted cells residing in either G0/G1 or S/G2+M did not establish whether cell cycle arrest of these cells was a specific phenomenon restricted to the behavior of expanded cells. Thus, these studies left unanswered the question of whether freshly isolated CD34+ cells in different phases of cell cycle behaved similarly in vivo. G0CD34+ and G1CD34+ cells from MPB were isolated as previously described17 and transplanted into conditioned NOD/SCID recipients. Because of the lack of substantial numbers of cells in S/G2+M in MPB26-28 and to the limited number of these cells that can be isolated from fresh BM CD34+ cells, these analyses were restricted to MPB G0 and G1CD34+ cells (Figure6). Not only do G0 and G1 fractions of MPB CD34+ cells represent 2 mitotically distinct groups of cells, they also segregate CD34+ cells into NOD/SCID mice engrafting (G0CD34+ cells) and nonengrafting (G1CD34+ cells).17 In addition, such a separation provides a sizable enrichment for CD34+CD38− cells within G0CD34+ cells.29 To follow cell cycle progression more closely, cells were analyzed at 24, 48, and 72 hours AT, when possible. As can be seen in Figure 6, both G0 and G1CD34+ cells began to exit G0/G1 at 24 hours (88.5% and 83.7% in G0/G1, respectively) and cycled effectively after 48 hours of in vitro culture such that between 53.4% and 61.3% of these cells were in G0/G1 between 48 and 72 hours. However, most G0CD34+ cells recovered from the BM of recipient mice persisted in G0/G1 especially 24 hours AT (96.4%), and, by 48 hours, 87.8% remained in G0/G1. Interestingly, a higher percentage of G0CD34+cells trafficking to the spleen remained in G0/G1 at all time points examined (Figure 6). The difference between the percentage of transplanted G0cells remaining in G0/G1 48 hours AT (87.8%) and that among similar cells maintained in culture (56.0%) was statistically significant (P < .01). Although a smaller fraction of G1CD34+ cells homing to the BM remained in G0/G1 48 hours AT (78.1%), the difference in percentage of quiescent cells contained in this group and the corresponding fraction among cells maintained in culture was significant (P < .01).
Cell cycle analysis of fresh, ex vivo–cultured and BM- and spleen-homed MPB G0CD34+ and G1CD34+ cells.
Immunomagnetically selected MPB CD34+ cells were stained with Hst and PY, and CD34+ cells in G0 or G1 were isolated by cell sorting as described in “Materials and methods.” A sample from each sorted group was retained for cell cycle analysis at time zero (Fresh) and for initiating a short-term ex vivo culture (Ex vivo) that was maintained as described in the legend of Figure 2. Remaining cells from each group were transplanted into conditioned NOD/SCID mice, and 24, 48, and 72 hours AT, marrow (BM) and spleen (Spl) cells were recovered from individual mice, and human CFSE+ cells were isolated by flow cytometric cell sorting. Cell cycle status of all groups of cells was determined by PI staining. Number of measurements from 6 independent experiments for fresh samples is 4, for G0CD34+ cells at 24 hours is 3, and for G1CD34+ is 2; for G0 and G1CD34+ cells at 48 hours is 8 and for both groups at 72 hours is 1. Insufficient cell recovery (because of low cellularity after irradiation) precluded obtaining a measurement for spleen-homed G1CD34+ cells 72 hours AT.
Trafficking of CD34+ cells to the BM of recipient mice
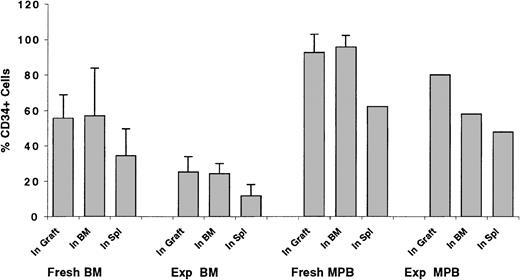
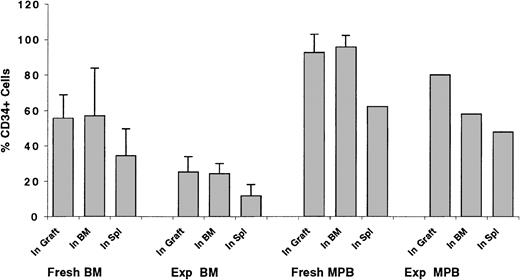
Transplantation of grafts composed of enriched, but not purified, CD34+ cells allowed for the determination of the percentage of CD34+ cells, among total transplanted cells, trafficking to the BM and spleen of recipient mice. This percentage was compared with that detected in the graft to assess whether CD34+cells preferentially homed to the BM or spleen of recipient mice (Figure 7). On average, 55.4% ± 13.3% of transplanted fresh BM cells were CD34+. Cells collected from the BM of recipient mice contained 56.9% ± 27.0% CD34+, whereas those trafficking to the spleen were composed of 34.3% ± 15.4% CD34+ cells (Figure 7). These results suggest that trafficking of CD34+ cells to the BM is not specific, but that a substantially larger percentage of CD34+ cells home to the BM compared with the spleen. To investigate whether homing of ex vivo–expanded CD34+ cells is compromised because of biologic and/or physiologic changes of CD34+ cells in vitro, similar analyses were performed on transplanted ex vivo–expanded cells. Grafts of expanded CD34+ cells contained 25.2% ± 8.6% CD34+ cells. BM-homed cells contained 24.3% ± 5.7% CD34+ cells, whereas 11.8% ± 6.3% CD34+ cells were detected in spleen-homed cells (Figure 7). These data illustrate that homing of expanded CD34+ cells, measured as the relative percentage of cells detected in the BM at a given time point AT, is not compromised compared with fresh cells.
Percentage of CD34+ cells contained in fresh and ex vivo–expanded BM and MPB grafts and that detected in BM- and spleen-homed cells 40 hours AT.
BM and MPB cells partially immunomagnetically enriched for CD34+ cells (to prepare grafts containing approximately 50% CD34+ cells) were either stained with CFSE and transplanted fresh into conditioned NOD/SCID recipients or expanded in vitro as described in the legend of Figure 2. Expanded cells were then stained with CFSE on day 5 and transplanted into conditioned NOD/SCID recipients. Percentage of CD34+ cells was determined in fresh (Fresh BM and Fresh MPB) and ex vivo–expanded (Exp BM and Exp MPB) grafts before transplantation (In Graft) and as a percentage of human CFSE+ cells detected flow cytometrically in the marrow (In BM) and spleen (In Spl) of transplant recipients 40 hours later. Each bar represents the mean ± SD (where applicable) of 3 to 4 measurements for fresh BM and MPB and expanded BM cells and one measurement for expanded MPB cells. Data were collected from 8 separate experiments.
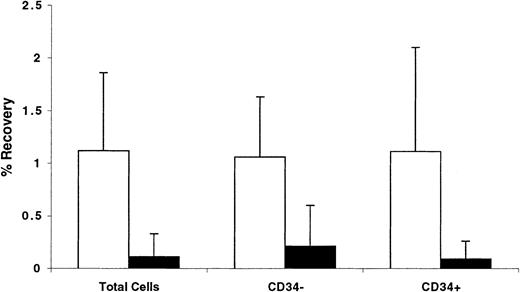
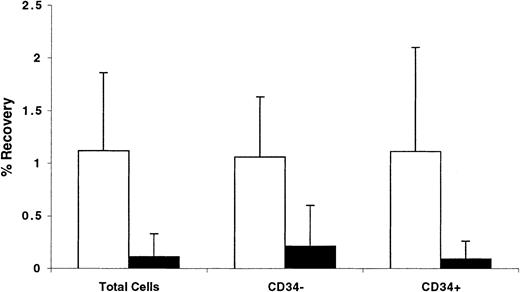
Trafficking of CD34+ cells AT was also analyzed by calculating the number of cells recovered in the BM and spleen of recipient mice as a percentage of the original number contained in the graft. Data shown in Figure 8 illustrate that between 1.0% and 1.1% of transplanted total, or CD34+, or CD34− cells were recovered from the BM of NOD/SCID mice, whereas only between 0.1% and 0.2% of these cells were retrieved from the spleen. These data demonstrate that, relative to other cells in the graft, CD34+ cells do not preferentially home to the BM. However, whether homing of CD34+ cells or engrafting fractions of CD34+cells to the BM is specific compared with homing of these cells to other tissues was not investigated.
Percentage of recovery of total, CD34+, and CD34− cells from the BM and spleen of NOD/SCID recipients 40 hours AT.
BM cells partially immunomagnetically enriched for CD34+cells (to prepare grafts containing approximately 50% CD34+ cells) were stained with CFSE and transplanted into conditioned NOD/SCID recipients. Percentage of CD34+ cells was determined in the graft and among CFSE+ cells recovered from the BM (light bars) and spleens (dark bars) of recipient mice 40 hours AT. These percentages, the number of cells in the graft, and the number of cells recovered from each tissue were used to calculate the percentage of recovery of total, CD34+, and CD34− cells. Each bar represents the mean ± SD of 5 to 7 independent measurements in 6 experiments. No statistically significant differences were detected in any comparison between all 3 measurements from each tissue.
Fate of BM-homed graft cells in different phases of cell cycle
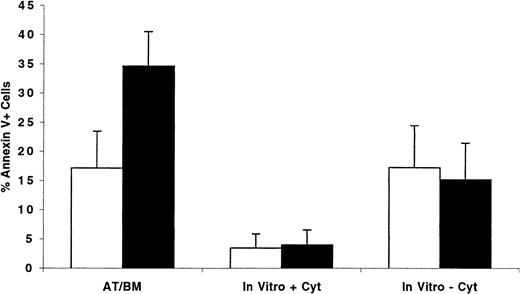
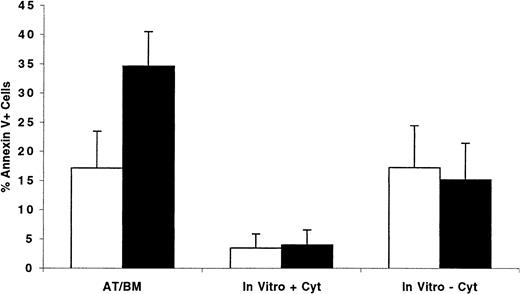
Having observed that cycling as well as quiescent cells were predominantly in G0/G1 phases of cell cycle 40 hours AT, we hypothesized that cycling cells might be more adversely affected by an unscheduled cell cycle arrest than quiescent cells. Under these circumstances, cells in G0 and early G1 may remain quiescent in the BM microenvironment until appropriate signals and conditions are conducive for their proliferation, whereas interruption of cell cycle progression of cycling cells may lead to apoptosis. We examined this hypothesis by transplanting into conditioned NOD/SCID recipients CFSE-stained ex vivo–expanded MPB or BM CD34+ cells separated, before transplantation, into cells in G0/G1 or in S/G2+M. BM-homed cells were recovered 40 hours AT, and the percentage of Annexin V–positive cells was determined. Results from 3 separate experiments are shown in Figure9. While only 17.1% ± 6.3% of cells recovered from recipients of xenografts containing G0/G1 cells displayed signs of programmed cell death, more than one third of transplanted S/G2+M cells (34.6% ± 5.9%, P < .01) were apoptotic, demonstrating that cell cycle arrest of these cells in the BM of recipient mice was detrimental to their long-term survival. Of interest is that only 15.1% ± 6.3% of S/G2+M cells maintained in complete medium for 40 hours without cytokine supplementation were apoptotic, a percentage similar to that observed for cells in G0/G1 when treated similarly (17.2% ± 7.2%, P = .7). When supplemented with cytokines, less than 4% of both phenotypes of cells were apoptotic 40 hours later.
Percentage of BM-homed G0/G1 or S/G2+M cells undergoing apoptosis 40 hours AT compared with the level of programmed cell death in ex vivo cultures maintained with and without cytokine supplementation.
CD34+ cells were isolated from one fresh MPB and 2 BM samples and cultured in vitro as described in “Materials and methods.” Between days 5 and 7, cells were harvested, washed, stained with Hst, and sorted to obtain cells in G0/G1(light bars) and S/G2+M (dark bars). Both G0/G1 (87.5 ± 5.3 in G0/G1, n = 3) and S/G2+M (28.5 ± 4.5 in G0/G1, n = 3) fractions were stained with CFSE and transplanted into conditioned NOD/SCID mice. Samples of G0/G1 and S/G2+M cells were maintained in culture with or without cytokine supplementation as described in the legend of Figure 2 for an additional 40 hours. BM cells were recovered from individual mice and stained with Annexin V as described in “Materials and methods.” CFSE+, PI− cells expressing Annexin V were considered apoptotic, and their percentage was calculated from total CFSE+ cells. Each bar represents the mean ± SD of 4 measurements for transplanted cells and 3 for cells maintained in vitro in 3 separate experiments.
Discussion
Engraftment and initiation of hematopoiesis by transplanted HSCs depend on 3 important criteria. First, transplanted cells must home to the BM microenvironment. Second, HSCs must lodge in the appropriate niches of the microenvironment, and, third, these cells must possess both the proliferative and multilineage differentiation potentials required for establishment of hematopoiesis. Many aspects of all 3 phases of engraftment of human stem and progenitor cells are poorly explored and ill defined. To shed some light on the first and third phases of this paradigm of hematopoietic engraftment, we examined homing patterns of transplanted human hematopoietic cells in a xenogeneic transplantation model and investigated cell cycle status of these cells shortly after their lodgment in the BM microenvironment. Our observations suggest that homing of transplanted hematopoietic cells to the BM is not specific but that subsequent lodgment in the BM microenvironment of engrafting cells may be selective. Furthermore, we documented that HPCs retained in the BM remain quiescent for the first 40 hours AT possibly due to an active proliferation inhibition mechanism that is yet to be investigated.
Determination of whether homing of engrafting cells to the BM microenvironment is specific would have been best examined by assessing the marrow repopulating potential of BM-homed cells in secondary recipients. However, the scarcity of cells recovered from the BM of primary recipients relative to what may be required to sustain measurable engraftment precluded such investigations. Nevertheless, our conclusion regarding nonspecificity of homing was inferred from the collective behavior of different fractions of CD34+ and CD34− cells. The fact that CD34− cells and the nonengrafting G1CD34+ fraction of CD34+ cells17 trafficked to the BM of conditioned NOD/SCID recipients in numbers similar to those of CD34+ and engrafting G0CD34+ cells suggest that transplanted cells arrive at the BM nonspecifically and perhaps in a process based on the complexity of the capillary bed of the BM as previously suggested.11 That homing is not specific as our present results demonstrate may be in conflict with previous studies demonstrating the ability of single transplanted HSCs to engraft conditioned recipients,30,31 suggesting, therefore, specific and efficient homing of individual cells to the BM. However, inefficient or nonspecific homing of putative stem cells in addition to other factors may explain why only a fraction of mice that received single cells engrafted.30 31 Also important in this regard is the difference between the homing efficiency of transplanted cells in a syngeneic system relative to that observed in a xenogeneic transplantation setting such as the one described here.
Whereas in mouse-to-mouse transplantation studies,11,19-21,32,33 between 5% and 20% of total cells or different classes of progenitors contained in the graft were detected in the BM of recipient animals shortly AT, studies examining homing of human cells to the marrow of NOD/SCID recipients11,34 reported substantially lower recoveries. Although data describing recovery of total cells as those we report here are limited,11 recovery of specific classes of progenitor cells has been examined more closely.11,34 van Hennik et al11 reported that only 2.3% of cord blood (CB) CD34+ xenografts could be detected in the marrow of NOD/SCID recipients and demonstrated that, on average, the seeding efficiency of CB progenitors was higher than that of BM and MPB.11 Assuming similar seeding efficiencies between total cells and assayable progenitors, it is plausible that fewer than 2.3% of transplanted BM and MPB CD34+ cells home to the BM of NOD/SCID recipients, a figure in agreement with the 1% to 1.1% recovery rate reported in the present studies. Numbers of cells homing to the BM were 5- to 10-fold higher than those homing to the spleen, similar to previous observations.11 Given the relative mass of the BM and spleen, a higher percentage of transplanted cells would be expected to home to these tissues if homing was a specific and directed event. In fact, a higher percentage of human cells detected in the BM 40 hours AT were CD34+ compared with those present in the spleen (Figure 7), suggesting a more directed homing of these cells to the BM. Many factors, however, including preferential maintenance of CD34 expression in the BM or down-regulation of CD34 expression in the spleen, may explain these differences. Interestingly, human cells detected in the BM of recipient mice reflected the same phenotypic profile of donor cells as previously reported for prenatally transplanted BM cells in a mouse model.35
A recent report by Cashman and Eaves34 indicated that only 7% and 5% of transplanted human cord blood– and fetal liver–derived competitive repopulating units, respectively, could be detected in the BM of NOD/SCID recipients 24 hours AT, suggesting that approximately 19 of every 20 primitive HPCs do not home specifically to the BM. When more mature progenitors were assessed, only 1 in 50 cells homed to the BM within the first 24 hours AT.34 These and similar results demonstrating that only 4% to 5% of human cord blood cobblestone area-forming cells (and a smaller percentage of these cells derived from BM or MPB) home to the marrow of NOD/SCID recipients11 suggest that homing of primitive HPCs to the BM is nonspecific and/or inefficient.
Cell cycle activation and proliferation of syngeneic-transplanted cells has been examined in few previous studies with contradicting results. While some studies documented proliferation of transplanted cells shortly after transplantation,16,19 others reported that most of BM-homed hematopoietic cells remained dormant 24 to 48 hours AT.21,33 Our present studies demonstrate that, in both BM and spleen, transplanted human cells remain mitotically quiescent beyond what is required to induce cell cycle activation in vitro. Our results concerning onset of proliferation of transplanted cells are in agreement with some previous studies21,33 and in conflict with others.16 19 The nature of this discrepancy could not be gleaned from our experimental design, although lack of suitable mitogenic signals in the murine marrow microenvironment was ruled out in studies in which human cytokines were administered before, during, and after transplantation of human cells. Whether persistent mitotic quiescence of transplanted cells is a unique characteristic of human progenitor cells or whether the observed behavior of human HPCs resulted from their lodgment in a xenogeneic microenvironment requires further investigation in more physiologic settings.
The precise position in the cell cycle in which transplanted cells are arrested could not be determined given the paucity of cells available for such studies. However, data from Table 1 infer that late G1 is a possibility since progression of S/G2+M cells through mitosis was documented followed by accumulation of these cells in what was collectively measured by PI staining as G0/G1. In addition, cells isolated in G0/G1 (Figure 5) or in G1 (Figure6) also remained in G0/G1, suggesting that late G1 was the stage in cell cycle in which proliferation of these cells was halted. Under this proposal, cells homing to the BM while in G0 phase of cell cycle remain in G0and may be immune to this late G1 arrest once their proliferation is initiated. Proliferation inhibition observed in these studies may play an important role in determining the fate of transplanted cells and their eventual contribution to hematopoietic reconstitution. On the basis of apoptosis studies, we believe that proliferation inhibition in the BM of recipient animals may serve as a selection mechanism whereby progression through cell cycle of transplanted cycling cells is halted, leading to their demise, whereas their mitotically quiescent counterparts can remain dormant in the marrow without adverse effects on their survival. This hypothesis may explain why ex vivo–expanded cells, composed predominantly of cycling cells, fail to efficiently engraft conditioned animals and may account for why we previously observed that MPB CD34+ cells traversing in short-term culture from G0 into G1 fail to engraft NOD/SCID recipients.17Certainly, other changes in the functional capacity of expanded cells, including differences in the degree and stage of maturity of cells composing each fraction, alterations in homing and seeding capacities, and diminution in proliferative potential, may contribute to the loss of hematopoietic potential documented for these cells.
It remains to be noted that, because the hematopoietic potential of BM-homed cells was not formally proven, our claim that stem cells homing to the BM of transplant recipients remain quiescent for at least 40 hours AT is not entirely conclusive. However, it is unlikely that true repopulating stem cells home to the marrow later than 40 hours AT as was previously demonstrated by other groups.11,16,32 34It is thus plausible to conclude that transplanted human hematopoietic cells, possibly including stem cells, as examined in the NOD/SCID xenogeneic transplantation model, do not preferentially home to the BM and remain quiescent for a considerable period of time after transplantation. Although this proliferation inhibition may have no deleterious effects on the engraftment of quiescent cells, it may substantially curtail the hematopoietic potential of cycling cells. These studies serve as a first step in elucidating the fate of transplanted hematopoietic cells shortly after their homing to the BM and provide an experimental model suitable for further investigations in this field.
We thank Susan Rice and Jeffrey Lay for their assistance in all the flow cytometric procedures and Dr Mervin Yoder for his critical review of this manuscript.
Supported by National Institutes of Health grants RO1 HL55716 and RO1 HL62200 to E.F.S. and National Institute of Diabetes and Digestive and Kidney Diseases Center for Excellence in Molecular Hematology grant P50 DK49218.
The publication costs of this article were defrayed in part by page charge payment. Therefore, and solely to indicate this fact, this article is hereby marked “advertisement” in accordance with 18 U.S.C. section 1734.
References
Author notes
E. F. Srour, Indiana University School of Medicine, 1044 W Walnut St, R4-202, Indianapolis, IN 46202-5121; e-mail: esrour@iupui.edu.

