Abstract
Enteropathy-associated T-cell lymphoma, an often fatal complication of celiac disease, can result from expansion of aberrant intraepithelial lymphocytes in refractory celiac disease type II (RCD II). Aberrant intraepithelial lymphocytes and lymphoma cells are intracellularly CD3ϵ+ but lack expression of the T-cell receptor (TCR)–CD3 complex on the cell surface. It is unknown what causes the loss of TCR-CD3 expression. We report the isolation of a cell line from an RCD II patient with the characteristic phenotype of enteropathy-associated T-cell lymphoma. We demonstrate that in this cell line the TCR-α and -β chains as well as the CD3γ, CD3δ, CD3ϵ, and ζ-chains are present intracellularly and that assembly of the CD3γϵ, CD3δϵ, and ζζ-dimers is normal. However, dimerization of the TCR chains and proper assembly of the TCR-CD3 complex are defective. On introduction of exogenous TCR-β chains, but not of TCR-α chains, assembly and functional cell surface expression of the TCR-CD3 complex were restored. Defective synthesis of both TCR chains was found to underlie loss of TCR expression in similar cell lines isolated from 2 additional patients. (Pre)malignant transformation in RCD II thus correlates with defective synthesis or defective association of the TCR chains, resulting in loss of surface TCR-CD3 expression.
Introduction
Celiac disease (CD) is an inflammatory disorder of the small intestine caused by a dysregulated immune response to ingested wheat gluten, which typically leads to villous atrophy and increased numbers of intraepithelial lymphocytes (IELs) in the intestinal mucosa. Whereas most patients recover on a gluten-free diet, a small proportion of patients fails to improve and develops a condition called refractory celiac disease (RCD). RCD is characterized by persisting or recurring villous atrophy with crypt hyperplasia and an increase of IELs despite a gluten-free diet. Two types of RCD are currently recognized: RCD I, without aberrant IELs; and RCD II, with aberrant IELs.1-3 The aberrant IELs in RCD II lack CD3, CD4, CD8, and the T-cell receptor (TCR) on the surface but express CD3 intracellularly and display monoclonal TCR-γ gene rearrangement.2,4,5 Furthermore, it has been shown that interleukin-15 (IL-15) is up-regulated in the lamina propria and epithelial cells of RCD patients, which induces growth and activation of these clonal IELs.6,7 Because an expansion of IELs under the influence of IL-15 may eventually give rise to overt enteropathy-associated T-cell lymphoma (EATL), the presence of such a clonal IEL population is thought to be a premalignant condition.1,2,6,8 It is not known what drives lymphoma development and the associated loss of TCR expression in RCD II. In the present study, we report the isolation of a cell line from a duodenal biopsy of a patient with RCD II. This cell line has the characteristic CD4−, CD8−, intracellular CD3ϵ+, surface TCR-CD3− phenotype of RCD II-associated IELs and proliferates in the presence of IL-15. In addition, these IELs express CD30 on the cell surface, as is typically seen in EATL.9 We have used this cell line and subunit-specific antibodies to analyze the expression and assembly of the TCR and CD3 subunits. The results indicate that, whereas all TCR-CD3 subunits were present intracellularly, proper assembly of the TCR-αβ dimer was defective. Functional cell surface expression of the complex could be restored by the introduction of an exogenous TCR-β chain. A similar analysis of cell lines isolated from 2 additional RCD II patients indicated defects in the synthesis of the TCR chains. Defective synthesis or defective association of TCR chains thus causes loss of functional surface TCR-CD3 expression on IELs in RCD II, a process that is probably important in escape from immune regulation and progression into EATL.
Methods
Patient histories
Patient 1 (P1) was typed as human leukocyte antigen (HLA)–A1/A2, -B8, -Cw7/Cw12, DR3/7, DQ2 and developed CD at the age of 51 years. At age 67, RCD type II with aberrant IELs was diagnosed. Until the present study, no EATL has developed.10 Patient 2 (P2) was typed as HLA-A3/32, -B8, -Cw7, DR3, DQ2 and patient 3 (P3) as HLA-A1, -B8, -Cw7, DR3, DQ2. Both P2 and P3 were RCD II patients with aberrant IELs and without EATL.
Cell lines
Small intestinal biopsy specimens
During upper endoscopy, large spike forceps biopsy specimens (Medi-Globe, Tempe, Arizona) were taken from the second part of the duodenum.13 Biopsy specimens were taken for direct flow cytometric analysis, TCR gene rearrangement assessment, and T-cell culture. All biopsy specimens were obtained after informed consent was given in accordance with the local ethical guidelines of the Free University Medical Center, Amsterdam and the Declaration of Helsinki.
Isolation of intestinal lymphocytes and flow cytometry
IELs were isolated from duodenal biopsies as described by Madrigal et al14 with minor modifications. Briefly, biopsies were vigorously shaken at 37°C for 60 minutes in phosphate-buffered saline (PBS) supplemented with 1 mM dithiothreitol (Fluka, Buchs, Switzerland) and 1 mM ethylenediaminetetraacetic acid (Merck, Darmstadt, Germany). The released IELs were washed twice with PBS supplemented with 0.1% bovine serum albumin (BSA; Roche Diagnostics, Mannheim, Germany) and subsequently stained for 30 minutes on ice, with fluorochrome-labeled monoclonal antibodies directed against CD3, CD4, CD8, CD7, CD45, γδTCR (all from BD Biosciences, San Jose, CA) as previously described.15 Cytoplasmic staining of CD3 was performed after cell permeabilization (Cytofix/CytoPerm Plus kit; BD Biosciences). Flow cytometric acquisition was performed using CellQuest software on a fluorescence-activated cell sorter (FACS; FACSCalibur; BD Biosciences). The data were analyzed using CellQuest software (BD Biosciences). All analyses were performed on lymphocytes, based on CD45bright staining and low sideward scatter.
Assessment of T-cell clonality
TCR-γ gene rearrangements were analyzed on 2 cryopreserved biopsy specimens and on cell line P1 (see “T-cell culture”). DNA was extracted from cryosections using proteinase-K digestion and ethanol precipitation of the genomic DNA. TCR-γ gene rearrangements were subsequently analyzed by multiplex polymerase chain reaction (PCR) amplification, using the primers and probes provided by the BIOMED-2 Consortium according to their guidelines.16
T-cell culture
Intraepithelial and lamina propria T-lymphocytes were isolated from a duodenal biopsy from an RCD II patient. After treatment with 1 mM dithiothreitol (2 times for 10 minutes at room temperature) and 0.75 mM ethylenediaminetetraacetic acid (60 minutes at 37°C) the biopsy was cultured in Iscove's modified Dulbecco's medium (IMDM; Lonza Verviers, Verviers, Belgium) supplemented with 10% normal human serum (NHS), 10 ng/mL recombinant IL-15 (R&D Systems Europe, Abingdon, United Kingdom), gliadin, and gliadin treated with tissue transglutaminase. From day 5, cells were further expanded in IMDM with 10% NHS containing 10 ng/mL IL-15. Staining of cells from T-cell culture was performed with fluorochrome-labeled monoclonal antibodies directed against CD3, CD4, CD8, TCR-αβ, TCR-γδ, CD103, integrin β7, CD30 (all from BD Biosciences), NKG2D (R&D Systems Europe), and KIR2DL2/KIR2DL3/KIR2DS2 (monoclonal antibody GL183; Beckman Coulter, Fullerton, CA). The predominant cell population consisting of TCR-αβ−, CD3−, CD4−, CD8−, CD30+ cells was purified by FACS and cultured in IMDM with 10% NHS containing 10 ng/mL IL-15. Cells were restimulated approximately every 6 to 7 weeks with 1 μg/mL phytohemagglutinin, 10 ng/mL IL-15, and 1 × 10⁶/mL irradiated allogenous peripheral blood mononuclear cells as feeder cells. Stability of the aberrant IEL phenotype of the P1 line was checked with flow cytometry at least once between every 2 restimulations.
Proliferation assay
Cells from RCD cell line P1 were rested by culturing them in the absence of IL-15 for 4 days. Cells (10 000 cells per well) were subsequently cultured in triplicate in 96-well plates in the presence or absence of IL-15 and/or IL-2 for 2 to 5 days at 37°C, after which 0.5 μCi 3H-thymidine was added to every well. After overnight incubation at 37°C, cells were harvested (Tomtec Harvester; Tomtec, Hamden, CT) and 3H-thymidine incorporation was determined.
Antisera and antibodies
The antisera against TCR-α chain, TCR-β chain, CD3γ chain, CD3δ chain, and CD3ϵ chain were rabbit antipeptide antisera. As described previously,17,18 the antiserum against the TCR-α chain was raised against a sequence in the extracellular constant region, whereas antisera against TCR-β chain, CD3γ chain, CD3δ chain, and CD3ϵ chain were raised against peptides corresponding to the carboxy termini of these chains. The anti–ζ-chain monoclonal antibody was obtained from BD PharMingen (San Diego, CA). The anti-CD3 antibody OKT3 used in the stimulation assay was obtained from Orthobiotech (Bridgewater, NJ).
35S metabolic labeling and cell surface iodination
Metabolic labeling and cell surface iodination were performed as previously described.19 For 35S metabolic labeling, 10 × 106 cells were washed 3 times in PBS and resuspended in 5 mL methionine- and cysteine-free RPMI (Sigma-Aldrich, Zwij̈ndrecht, The Netherlands) containing 0.5% fetal calf serum (FCS), and 10 ng/mL recombinant human IL-15; 1 mCi 35S-methionine/cysteine was added and cells were incubated overnight at 37°C. After incubation, cells were washed in PBS and lysed overnight at 4°C in 1 to 2 mL lysis buffer containing either 0.5% Nonidet P40 (NP40; Pierce Chemical, Rockford, IL) or 1% digitonin (Sigma Chemie). For iodination, approximately 6 × 10⁶ cells were washed in PBS and resuspended in 30 μL lactoperoxidase solution (2 mg/mL; Sigma Chemie); 1 mCi 125I Na was added to the cells followed by the addition of 10 μL 0.05% H2O2/PBS solution. During frequent mixing, 0.05% H2O2/PBS solution was added after 5 minutes (15 μL) and after 15 minutes (20 μL). After 30 minutes, free iodine was removed by washing with PBS. Cells were lysed overnight at 4°C in 250 to 500 μL lysis buffer containing 1% digitonin.
Immunoprecipitation and SDS-PAGE analysis
125I or 35S lysates were centrifuged at maximum speed for 20 minutes in an Eppendorf centrifuge at 4°C. Lysates were precleared twice, first with 100 μL protein A Sepharose beads and 50 μL normal rabbit serum and second with 100 μL protein A Sepharose beads only, both under rotation for 1 hour at room temperature. After removal of the beads, 5 μL antiserum (TCR-α, TCR-β, CD3γ, CD3δ, CD3ϵ antisera, anti-ζ antibody, or normal rabbit serum) was added to 100 μL precleared lysate and rotated for 1 hour at room temperature. Antigen-antibody complexes were isolated with 12.5 μL protein A Sepharose beads during 1 hour rotation at room temperature. Beads were washed 4 times in lysis buffer and analyzed under either reducing or nonreducing conditions on a one-dimensional 13.5% sodium dodecyl sulfate-polyacrylamide gel electrophoresis (SDS-PAGE) gel. After drying of the gels, autoradiography was performed at −80°C using Fuji scientific imaging films (Fuji, Düsseldorf, Germany).
Retroviral transduction
The TCR-α and TCR-β chains isolated from T-cell clone N10 (TCRAV14, TCRBV4) were cloned into a bicistronic vector as described before.20 The vector containing the TCR-α chain was combined with the marker green fluorescent protein (GFP), the vector containing the TCR-β chain was combined with truncated nerve growth factor receptor (tNGFR). Both α- and β-chain constructs were transfected into Phoenix packaging cells.21 Retroviral supernatant was produced and used to transduce cells from RCD cell lines P1, P2, and P3 with either TCR-α, TCR-β, or both. For transduction, non–tissue-culture–treated 24-well plates (Falcon; BD Biosciences) were treated 2 hours with 25 μg/mL Retronectin (Takara, Kyoto, Japan) and blocked 30 minutes with 2% human serum albumin. After 30 minutes of incubation with the cells, retroviral supernatant was added and cells were placed overnight at 37°C. The presence of the TCR-α chain (GFP) and TCR-β chain (tNGFR) and cell surface expression of the TCR was analyzed with flow cytometry. TCR-αβ+, NGFR+ cells were purified by FACS.
T-cell stimulation with anti-CD3
Ninety-six–well non–tissue-culture–treated plates (Falcon; BD Biosciences) were coated overnight in triplicate with various concentrations of anti-CD3 (OKT3). After coating, plates were blocked with 10% fetal calf serum/PBS and washed 3 times with PBS. Per well, 15 000 nontransduced P1 cells, P1 cells transduced with the TCR-β chain from T-cell clone N10, or cells from T-cell clone N10 were added. Plates were incubated at 37°C for 2 days, after which 0.5 μCi 3H-thymidine was added. After overnight incubation at 37°C, cells were harvested and 3H-thymidine incorporation was determined.
Results
The majority of IELs in the small intestine of RCD II patient P1 are aberrant and monoclonal
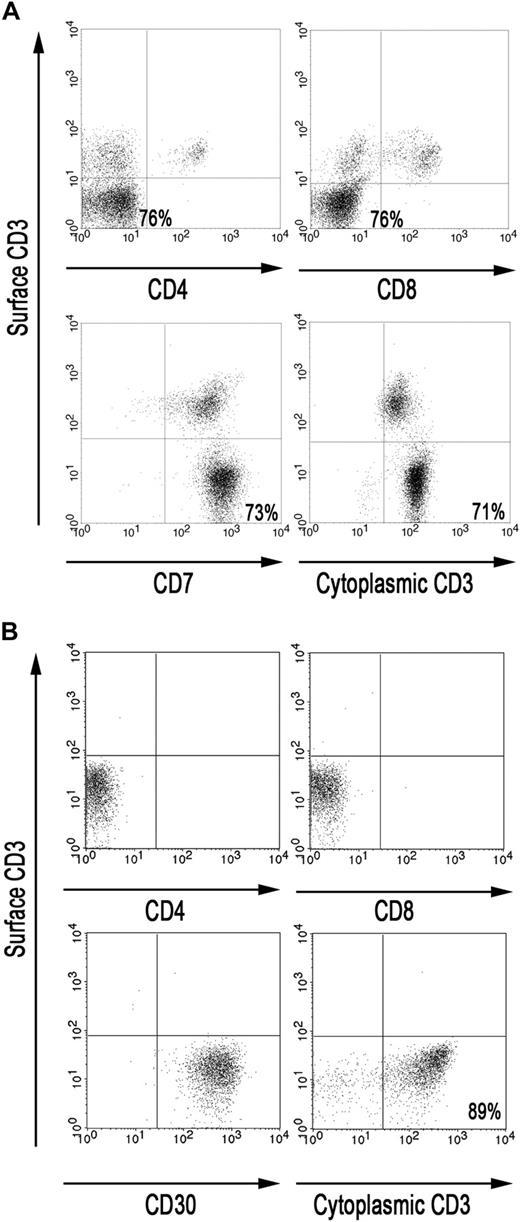
RCD II is associated with aberrant IELs lacking CD3, CD4, CD8, and the TCR on the cell surface but expressing CD3 intracellularly. To gain insight in the phenotype of the IELs in the small intestine of RCD II patient P1, FACS analysis was performed on IELs directly isolated from a freshly taken duodenal biopsy of patient P1. Analysis of the CD45bright IEL population showed that the majority (71%-76%) were CD3−, CD4−, CD8−, CD7+ but cytoplasmic CD3+, and may thus be defined as aberrant (Figure 1A). Furthermore, PCR analysis demonstrated the presence of monoclonal TCR-γ gene rearrangement in 2 cryopreserved biopsy specimens of patient P1 (data not shown).
The majority of IELs in the small intestine of RCD II patient P1 are aberrant. (A) FACS analysis of IELs, directly isolated from duodenal biopsies from patient P1. (B) FACS analysis of RCD cell line P1, cultured from duodenal biopsies from patient P1. Analyses were performed on CD45bright cells within a live lymphocyte gate.
The majority of IELs in the small intestine of RCD II patient P1 are aberrant. (A) FACS analysis of IELs, directly isolated from duodenal biopsies from patient P1. (B) FACS analysis of RCD cell line P1, cultured from duodenal biopsies from patient P1. Analyses were performed on CD45bright cells within a live lymphocyte gate.
RCD cell line P1: a model for aberrant IEL in RCD II and EATL
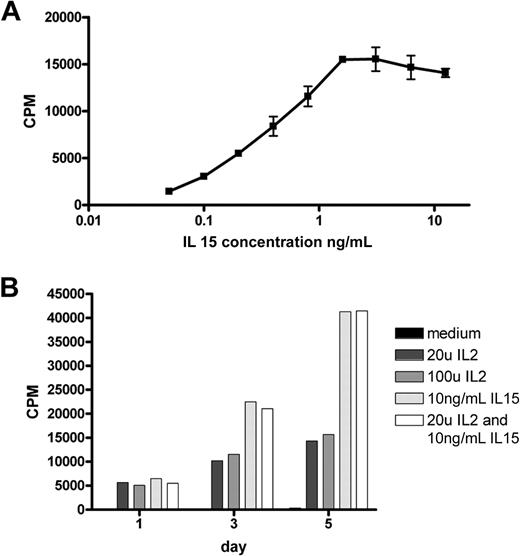
Culture of a duodenal biopsy from RCD II patient P1 with IL-15 resulted in outgrowth of a cell line in which the predominant population, similar to the freshly isolated IELs, was found to be CD3−, TCR-αβ−, CD4−, CD8−, and cytoplasmic CD3+ (Figure 1B). In addition, these cells were CD30+, which is a characteristic feature of EATL9 (Figure 1B). Furthermore, the cells displayed the same monoclonal TCR-γ gene rearrangement as the 2 cryopreserved biopsy specimens of patient P1 (data not shown). The predominant population, hereafter called RCD cell line P1, was purified by FACS and subsequently used as a model for aberrant IELs in RCD II and EATL. As IL-15 is up-regulated in the lamina propria and epithelial cells of RCD patients and induces growth and activation of clonal IEL,6,22 the effect of IL-15 on the proliferation of RCD cell line P1 was assessed. Figure 2A shows dose-dependent proliferation of RCD cell line P1. Proliferation in response to high doses of IL-2 was much lower than proliferation in response to IL-15 (Figure 2B). Furthermore, combining IL-15 and IL-2 had no additional effect on proliferation compared with IL-15 alone (Figure 2B). The specific response of RCD cell line P1 to IL-15 further supported the notion that this cell line can serve as a model for aberrant IELs in RCD II and EATL.
IELs from RCD cell line P1 proliferate in response to IL-15 in a dose-dependent manner. (A) Proliferation in response to various doses of IL-15. (B) Five-day follow-up of proliferation in response to IL-2, IL-15, and a combination of both. CPM indicates 3H-thymidine incorporation.
IELs from RCD cell line P1 proliferate in response to IL-15 in a dose-dependent manner. (A) Proliferation in response to various doses of IL-15. (B) Five-day follow-up of proliferation in response to IL-2, IL-15, and a combination of both. CPM indicates 3H-thymidine incorporation.
Defective association of the TCR chains underlies the loss of surface TCR-CD3 expression in RCD cell line P1
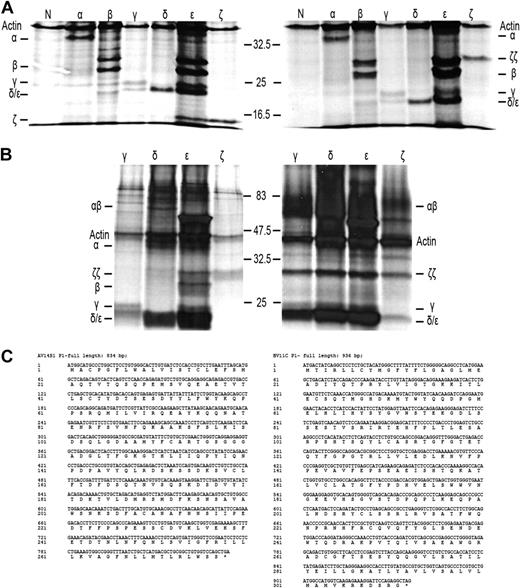
As a first step to understand why TCR-CD3 surface expression is lost on IELs in RCD II, we investigated the presence or absence of the specific TCR-CD3 chains in RCD cell line P1. For this purpose, cells were labeled with 35S methionine/cysteine and lysed, after which immunoprecipitations with antibodies specific for TCR-α, TCR-β, CD3γ, CD3δ, CD3ϵ, and ζ were performed, followed by SDS-PAGE analysis. For comparison, metabolic labeling and immunoprecipitations were performed on cells from unrelated T-cell clone N10, which expresses a normal TCR-CD3 complex on the surface. It is known that in digitonin lysis buffer all components of the TCR-CD3 complex remain complexed, whereas in NP40 lysis buffer the TCR-CD3 complex dissociates into the TCR-αβ heterodimer, ζ-homodimer, a CD3γϵ heterodimer, and a CD3δϵ heterodimer.17,19 RCD cell line P1 was found to express all TCR-CD3 subunits intracellularly (Figure 3A). The TCR-β antibody immunoprecipitated 2 specific bands that appeared to be glycosylation variants of each other as, in agreement with previous observations,23 on deglycosylation with N-glycanase, the upper band merged with the lower band (results not shown). Furthermore, the dimerization of ζ appeared normal because under nonreducing conditions ζζ was seen as a protein band of approximately 30 kDa, which was reduced to a protein band of approximately 15 kDa under reducing conditions (Figure 3A). In addition, several other subunit interactions were observed as indicated by the presence of CD3ϵ in the CD3γ- and CD3δ-specific immunoprecipitates and vice versa. Under nonreducing conditions, however, there was no evidence for proper formation of a TCR-αβ dimer because only separate TCR-α and -β chains were observed in the TCR-α– and TCR-β–specific immunoprecipitates. This suggests the lack of formation of a disulfide bridge between the TCR chains (Figure 3A). The lack of proper formation of a TCR-αβ dimer was further substantiated by analysis of CD3- and ζ-specific immunoprecipitations performed on digitonin lysates of RCD cell line P1 and, as a control, surface TCR+ T-cell clone N10. In RCD cell line P1 only separate TCR-α and TCR-β chains were observed in association with CD3ϵ, whereas in T-cell clone N10 a TCR-αβ dimer was observed and separate TCR-α and TCR-β chains were absent (Figure 3B). Furthermore, although in all 3 CD3 subunit-specific immunoprecipitates of T-cell clone N10 the ζζ-dimer was present, no evidence for incorporation of the ζζ-dimer into the TCR-CD3 complex was obtained for RCD cell line P1 (Figure 3B). Sequencing of the TCR-α and TCR-β transcripts of RCD cell line P1 revealed that both chains were in frame and encoded full-length TCR chains (Figure 3C). In conclusion, all TCR-CD3 subunits are present in RCD cell line P1, but proper assembly of the complex is disturbed.
Defective association of the TCR chains underlies the loss of surface TCR-CD3 expression in RCD cell line P1. SDS-PAGE analysis of immunoprecipitates of RCD cell line P1 and T-cell clone N10 after 35S metabolic labeling. Antisera used were normal rabbit serum as negative control (N), anti–TCR-α (α), anti–TCR-β (β), anti-CD3γ (γ), anti-CD3δ (δ), anti-CD3ϵ (ϵ), and anti-ζ (ζ). (A) Immunoprecipitates obtained from NP40 lysates of RCD cell line P1 were analyzed under reducing (left) and nonreducing (right) conditions. (B) Immunoprecipitates obtained from digitonin lysates of RCD cell line P1 (left) and T-cell clone N10 (right) were analyzed under nonreducing conditions. Positions of individual chains and molecular mass markers (kilodaltons) are indicated. (C) Sequences of the TCR-α and TCR-β chain of cell line P1 (TCRAV14S1, TCRBV11c).
Defective association of the TCR chains underlies the loss of surface TCR-CD3 expression in RCD cell line P1. SDS-PAGE analysis of immunoprecipitates of RCD cell line P1 and T-cell clone N10 after 35S metabolic labeling. Antisera used were normal rabbit serum as negative control (N), anti–TCR-α (α), anti–TCR-β (β), anti-CD3γ (γ), anti-CD3δ (δ), anti-CD3ϵ (ϵ), and anti-ζ (ζ). (A) Immunoprecipitates obtained from NP40 lysates of RCD cell line P1 were analyzed under reducing (left) and nonreducing (right) conditions. (B) Immunoprecipitates obtained from digitonin lysates of RCD cell line P1 (left) and T-cell clone N10 (right) were analyzed under nonreducing conditions. Positions of individual chains and molecular mass markers (kilodaltons) are indicated. (C) Sequences of the TCR-α and TCR-β chain of cell line P1 (TCRAV14S1, TCRBV11c).
Retroviral introduction of exogenous TCR-β chains in RCD cell line P1 restores TCR-αβ dimer formation and cell surface expression
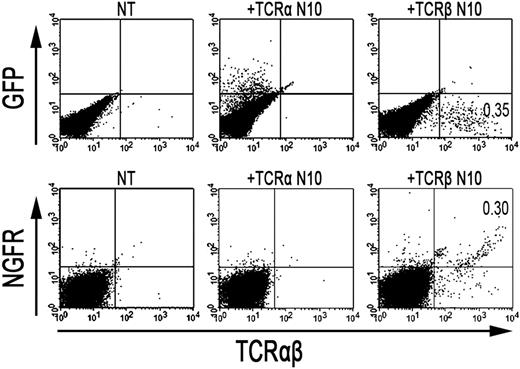
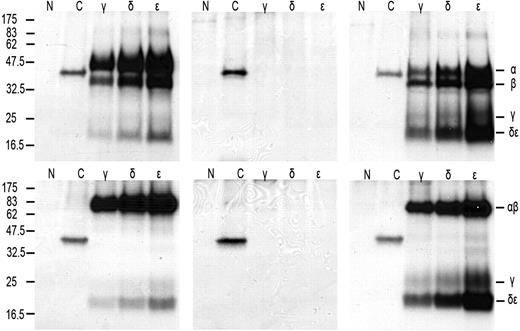
As the formation of TCR-αβ dimers was found to be disturbed in RCD cell line P1, we next investigated whether the introduction of an exogenous TCR-α and/or TCR-β chain could restore cell surface expression of the TCR-CD3 complex. To this end, a TCR-α and/or TCR-β chain (TCRAV14, TCRBV4), obtained from T-cell clone N10, was introduced into RCD cell line P1 by retroviral transduction. For comparison, the exogenous TCR-α or TCR-β chains were also retrovirally transduced into Jurkat clones deficient for TCR-α (α−/−) or TCR-β (β−/−). Cell surface expression of the TCR after transduction was determined with FACS analysis, where GFP positivity represented proper transduction of the TCR-α chain and NGFR positivity proper transduction of the TCR-β chain (Figure 4). TCR-CD3 expression was restored on TCR-α–negative Jurkat cells after transduction with the TCR-α chain (Figure S1, available on the Blood website; see the Supplemental Materials link at the top of the online article). Similarly, TCR-CD3 expression was restored on TCR-β–negative Jurkat cells after transduction with the TCR-β chain (data not shown), indicating that both constructs are functional. Although introduction of the TCR-α chain did not restore TCR-CD3 expression on the cell surface of RCD cell line P1, cells transduced with the TCR-β chain did express the TCR-CD3 complex on the cell surface (Figure 4). Similarly, the introduction of 2 additional TCR-α chains (Figure S1) failed to restore TCR-CD3 expression on the P1 cells, whereas the introduction of another TCR-β chain (data not shown) did restore TCR-CD3 expression. To further substantiate that the introduction of an exogenous TCR-β chain resulted in proper assembly and cell surface expression of a TCR-CD3 complex, TCR-αβ+, NGFR+ cells were purified by FACS from P1 cells transduced with the TCR-β from N10 (Figure 4). Subsequently, T-cell clone N10, RCD cell line P1, and RCD cell line P1 transduced with TCR-β from N10 were either cell surface labeled with 125I or metabolically labeled with 35S methionine/cysteine. Thereafter, cells were lysed in digitonin buffer to preserve subunit interactions followed by immunoprecipitations and SDS-PAGE analysis. In the metabolically labeled cells, the introduction of the TCR-β chain resulted in the formation of a TCR-αβ dimer and proper assembly of a TCR-CD3 complex, including incorporation of the ζζ-dimer into the complex (data not shown). Similarly, a CD3-associated TCR-αβ dimer was observed after cell surface labeling on T-cell clone N10 as well as on RCD cell line P1 transduced with the TCR-β chain but not on RCD cell line P1 itself (Figure 5). Proper assembly was further indicated by the presence of a TCR-αβ dimer in the CD3γ, CD3δ, and CD3ϵ immunoprecipitates and by dissociation of the TCR-αβ dimer into its subunits under reducing conditions (Figure 5). Together, these results indicate that impaired dimerization with the endogenous TCR-β chain results in the loss of a functional TCR-CD3 complex on RCD cell line P1.
Retroviral introduction of exogenous TCR-β chains in RCD cell line P1 restores surface TCR-αβ expression. FACS analysis after retroviral transduction of cells from RCD cell line P1 with the TCR-α or TCR-β chain from T-cell clone N10. (Top panel) GFP- (TCR-α from N10) and TCR-αβ expression on nontransduced P1 cells (NT), P1 cells transduced with the TCR-α chain from T-cell clone N10 (+TCR-α N10), and on P1 cells transduced with the TCR-β chain from T-cell clone N10 (+TCR-β N10). (Bottom panel) NGFR- (TCR-β from N10) and TCR-αβ expression, also on nontransduced P1 cells (NT), P1 cells transduced with the TCR-α chain from T-cell clone N10 (+TCR-α N10), and on P1 cells transduced with the TCR-β chain from T-cell clone N10 (+TCR-β N10).
Retroviral introduction of exogenous TCR-β chains in RCD cell line P1 restores surface TCR-αβ expression. FACS analysis after retroviral transduction of cells from RCD cell line P1 with the TCR-α or TCR-β chain from T-cell clone N10. (Top panel) GFP- (TCR-α from N10) and TCR-αβ expression on nontransduced P1 cells (NT), P1 cells transduced with the TCR-α chain from T-cell clone N10 (+TCR-α N10), and on P1 cells transduced with the TCR-β chain from T-cell clone N10 (+TCR-β N10). (Bottom panel) NGFR- (TCR-β from N10) and TCR-αβ expression, also on nontransduced P1 cells (NT), P1 cells transduced with the TCR-α chain from T-cell clone N10 (+TCR-α N10), and on P1 cells transduced with the TCR-β chain from T-cell clone N10 (+TCR-β N10).
Retroviral introduction of exogenous TCR-β chains in RCD cell line P1 restores TCR-αβ dimer formation and surface expression. SDS-PAGE analysis of immunoprecipitates obtained from digitonin lysates of T-cell clone N10 (left), RCD cell line P1 (middle), and RCD cell line P1 transduced with TCR-β from N10 (right) after cell surface iodination. Antisera used were normal rabbit serum as negative control (N), anti-HLA class I (C), anti-CD3γ (γ), anti-CD3δ (δ), and anti-CD3ϵ (ϵ). (Top panel) Reducing conditions. (Bottom panel) Nonreducing conditions. Positions of individual chains and molecular mass markers (kilodaltons) are indicated.
Retroviral introduction of exogenous TCR-β chains in RCD cell line P1 restores TCR-αβ dimer formation and surface expression. SDS-PAGE analysis of immunoprecipitates obtained from digitonin lysates of T-cell clone N10 (left), RCD cell line P1 (middle), and RCD cell line P1 transduced with TCR-β from N10 (right) after cell surface iodination. Antisera used were normal rabbit serum as negative control (N), anti-HLA class I (C), anti-CD3γ (γ), anti-CD3δ (δ), and anti-CD3ϵ (ϵ). (Top panel) Reducing conditions. (Bottom panel) Nonreducing conditions. Positions of individual chains and molecular mass markers (kilodaltons) are indicated.
Restoration of TCR functionality on introduction of an exogenous TCR-β chain in RCD cell line P1
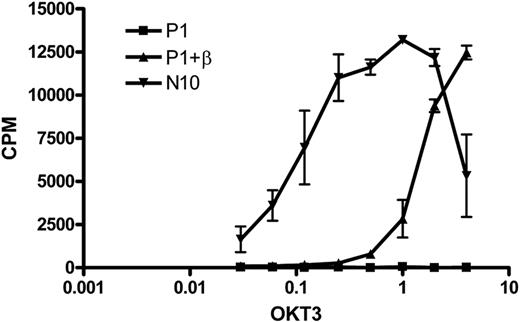
To investigate whether the TCR-CD3 complex expressed on the cell surface after introduction of an exogenous TCR-β chain was functional, we stimulated T-cell clone N10, RCD cell line P1, and the RCD cell line P1 transduced with the TCR-β chain from N10 with a plate-bound anti-CD3 antibody (OKT3) and determined the proliferative response. As expected, the nontransduced cells did not respond to anti-CD3 stimulation, whereas the TCR-β–transduced cells proliferated in response to anti-CD3 stimulation, although to a lower extent than control cell line N10 (Figure 6). These results show that functional cell surface expression of a TCR-CD3 complex can be restored by introduction of an exogenous TCR-β chain.
Restoration of TCR functionality on introduction of an exogenous TCR-β chain in RCD cell line P1. Cells from T-cell clone N10, nontransduced P1 cells, and P1 cells transduced with the TCR-β chain from T-cell clone N10 were stimulated with various amounts of anti-CD3 antibody (OKT3).
Restoration of TCR functionality on introduction of an exogenous TCR-β chain in RCD cell line P1. Cells from T-cell clone N10, nontransduced P1 cells, and P1 cells transduced with the TCR-β chain from T-cell clone N10 were stimulated with various amounts of anti-CD3 antibody (OKT3).
Additional RCD cell lines show impaired TCR-α and TCR-β dimerization as well
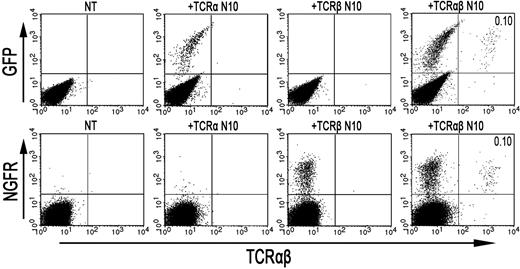
In 2 additional surface TCR-CD3–negative cell lines isolated from duodenal biopsies from RCD II patients (P2 and P3), the TCR-CD3 complex was studied. Similar to RCD cell line P1, cells from cell line P2 and P3 proliferated specifically in response to IL-15 and 35S metabolic labeling experiments indicated proper assembly of the CD3γϵ, CD3δϵ, and ζζ-dimers, whereas no evidence for the presence of a TCR-αβ dimer was obtained (data not shown). Whereas transduction with either the TCR-α or TCR-β chain of T-cell clone N10 did not restore cell surface expression of the TCR, simultaneous introduction of both TCR chains did restore TCR surface expression (Figure 7), confirming that the CD3 complex assembles properly in these cell lines. In contrast to cell line P1, no transcripts coding for either a TCR-α- or a TCR-β chain could be detected in cell lines P2 and P3 (results not shown). These results indicate that loss of surface TCR-CD3 expression in RCD II cell line P2 and P3 is the result of defects in the synthesis of both TCR chains.
Retroviral introduction of both an exogenous TCR-α and TCR-β chain in RCD cell lines P2 and P3 restores TCR-αβ surface expression. FACS analysis after retroviral transduction of cells from RCD cell line P3 with the TCR-α and/or TCR-β chain from T-cell clone N10. (Top panel) GFP- (TCR-α from N10) and TCR-αβ expression on nontransduced P3 cells (NT), P3 cells transduced with the TCR-α chain from T-cell clone N10 (+TCR-α N10), P3 cells transduced with the TCR-β chain from T-cell clone N10 (+TCR-β N10), and P3 cells with both the TCR-α and TCR-β chain from T-cell clone N10 (+TCR-αβ N10). (Bottom panel) NGFR- (TCR-β from N10) and TCR-αβ expression, also on nontransduced P3 cells (NT), P3 cells transduced with the TCR-α chain from T-cell clone N10 (+TCR-α N10), P3 cells transduced with the TCR-β chain from T-cell clone N10 (+TCR-β N10), and P3 cells with both the TCR-α and TCR-β chain from T-cell clone N10 (+TCR-αβ N10). Percentages of double-positive cells are indicated. FACS analysis after retroviral transduction of cells from RCD cell line P2 with the TCR-α and/or TCR-βchain from T-cell clone N10 showed similar results.
Retroviral introduction of both an exogenous TCR-α and TCR-β chain in RCD cell lines P2 and P3 restores TCR-αβ surface expression. FACS analysis after retroviral transduction of cells from RCD cell line P3 with the TCR-α and/or TCR-β chain from T-cell clone N10. (Top panel) GFP- (TCR-α from N10) and TCR-αβ expression on nontransduced P3 cells (NT), P3 cells transduced with the TCR-α chain from T-cell clone N10 (+TCR-α N10), P3 cells transduced with the TCR-β chain from T-cell clone N10 (+TCR-β N10), and P3 cells with both the TCR-α and TCR-β chain from T-cell clone N10 (+TCR-αβ N10). (Bottom panel) NGFR- (TCR-β from N10) and TCR-αβ expression, also on nontransduced P3 cells (NT), P3 cells transduced with the TCR-α chain from T-cell clone N10 (+TCR-α N10), P3 cells transduced with the TCR-β chain from T-cell clone N10 (+TCR-β N10), and P3 cells with both the TCR-α and TCR-β chain from T-cell clone N10 (+TCR-αβ N10). Percentages of double-positive cells are indicated. FACS analysis after retroviral transduction of cells from RCD cell line P2 with the TCR-α and/or TCR-βchain from T-cell clone N10 showed similar results.
Discussion
CD is a common gastrointestinal disorder that afflicts 1 in 200 persons in Europe24 ; 2% to 5% of CD patients diagnosed as adults develop a refractory state of CD characterized by persisting villous atrophy and an increase of IELs despite a gluten-free diet.2 The 2 types of RCD (RCD I and RCD II) are distinguished by the respective absence or presence of an aberrant IEL population lacking surface TCR-CD3 expression. In all patients with RCD II, this abnormal IEL population may be observed, which besides lack of T-cell markers such as CD3, CD4, CD8, and TCR-αβ is also associated with clonal TCR-γ gene rearrangement.1,2 Moreover, the aberrant IEL population is not restricted to the small intestine but may also be observed in gastric and colonic epithelium.1,25 The same aberrant IELs and clonal TCR-γ gene rearrangements found in patients with RCD II may be subsequently observed in EATL specimens from these patients, suggesting that RCD II precedes development of EATL.5 EATL has a very poor 5-year survival rate of 11% to 20%.2 Improved understanding of the events leading to RCD II and subsequent EATL development is therefore needed. Until now, aberrant IELs have been investigated mainly in situ, and this limits the type of experiments that can be performed to investigate molecular events that are linked to malignant transformation.15
In the present study, we report the isolation of 3 cell lines from small intestinal biopsies of RCD II patients (P1-P3). These cell lines displayed the characteristic intracellular CD3ϵ+, surface CD3−, CD4−, CD8−, and TCR-αβ− phenotype. Moreover, the observed proliferative response of the cell lines to stimulation with IL-15 supports the notion that these cell lines represent a model for aberrant IEL. Strikingly, and in contrast to aberrant IELs in RCD II, the cell lines also expressed CD30, which is typically found on EATL. The latter suggests that, although clinically there was no evidence for EATL in these 3 patients, cells with the characteristic EATL phenotype are already present in the small intestine of these patients and can be propagated in vitro. These cell lines offered the unique opportunity to study the cause for loss of surface expression of the TCR-CD3 complex, an event that is typically associated with (pre)malignant transformation. It is well established that in a functional TCR-CD3 complex the TCR-α and TCR-β chain are associated with the CD3γ, CD3δ, CD3ϵ, and ζ-chains, which enable signal transduction.18,26 Therefore, we hypothesized that loss of TCR-CD3 expression might be the result of defects in one of these chains resulting in deficient assembly of the complex. We demonstrate that, in RCD II cell line P1, the TCR-α and -β chains as well as the CD3γ, CD3δ, CD3ϵ, and ζ-chains were present intracellularly, the CD3γϵ, CD3δϵ, and ζζ-dimers assembled normally, but dimerization of the TCR-α and -β chains and incorporation of ζζ in the TCR-CD3 complex was defective. Furthermore, we demonstrate that, through the introduction of exogenous TCR-β chains, but not of TCR-α chains, the assembly and functional cell surface expression of the TCR-CD3 complex could be restored, indicating that the defect lies with the TCR-β chain. Sequencing of the cDNA encoding the endogenous TCR-α and TCR-β chain from RCD cell line P1 showed both chains to be in frame and according to the consensus sequence (Figure 3C), which correlates with the observed presence of a TCR-β protein in metabolically labeled P1 cells (Figure 3A). In contrast, our results indicate that a lack of expression of both TCR chains underlies the loss of surface TCR-CD3 expression in cell lines P2 and P3. Therefore, our results indicate that the loss of TCR-CD3 expression in patients with RCD can be mediated by several mechanisms. At present, it cannot be excluded that cell lines P2 and P3, in which both TCR chains are lost, represent a more advanced stage of (pre)malignant transformation, whereas the absence of association despite the presence of wild-type TCR chains in P1, might represent an earlier phase. This possibility and the exact mechanism underlying defective assembly in RCD cell line P1 will be the subject of future investigations. Preliminary experiments indicate that the half-lives of the TCR-α and TCR-β chains of cell line P1 are comparable with those in a T-cell clone with normal TCR surface expression. Together, our results indicate that (pre)malignant transformation of IEL in RCD II correlates with abnormal expression or association of the TCR chains, resulting in defective TCR-CD3 surface expression.
As the loss of TCR-CD3 expression is typically observed in RCD II and EATL, one must assume that this is linked to (pre)malignant transformation.5,27 An important question, therefore, is what drives the down-regulation of the TCR-CD3 complex. Down-regulation of TCR expression has been linked to extensive stimulation with antigen presented by antigen-presenting cells and serves to prevent apoptosis induction.28,29 Possibly, the aberrant IELs in RCD II express autoreactive TCR or TCR reactive with (peptides from) stress-induced ligands. Down-regulation of the TCR might then be a way to escape from immune-regulatory processes aimed at the elimination of autoreactive cells. Alternatively, aberrant IELs might arise from gluten-specific, HLA class I–restricted CD8+ IELs,30 which escape from immune regulation by down-regulation of their gluten-specific TCR. The availability of the IEL cell lines established in the present study now allows an in-depth analysis of these possibilities, and this will be the topic of future research.
In conclusion, the present study provides the first evidence that loss of TCR-CD3 surface expression on IELs in RCD II is the result of defects in the synthesis or assembly of TCR chains providing a first step in understanding the process leading to the development of RCD II and subsequent progression into EATL.
The online version of this article contains a data supplement.
The publication costs of this article were defrayed in part by page charge payment. Therefore, and solely to indicate this fact, this article is hereby marked “advertisement” in accordance with 18 USC section 1734.
Acknowledgments
This work was supported by the Celiac Disease Consortium, an Innovative Cluster approved by The Netherlands Genomics Initiative and partially funded by the Dutch government (BSIK03009).
Authorship
Contribution: J.M.L.T. performed the research, analyzed the data, and wrote the paper; W.H.M.V. performed experiments and wrote the paper; Y.M.C.K.-W., B.H.N., A.R.v.d.S., A.T., M.W.J.S., and L.H.A.D. performed experiments; C.J.M. contributed the duodenal biopsies; M.H.M.H. and J.v.B. designed the research; and F.K. designed the research and wrote the paper.
Conflict-of-interest disclosure: The authors declare no competing financial interests.
Correspondence: Jennifer M. L. Tjon, Department of Immunohematology and Blood Transfusion, Leiden University Medical Center, E3-Q, PO Box 9600, 2300 RC Leiden, The Netherlands; e-mail: j.m.l.tjon@lumc.nl.

This feature is available to Subscribers Only
Sign In or Create an Account Close Modal