Abstract
High expression of BMI1 in acute myeloid leukemia (AML) cells is associated with an unfavorable prognosis. Therefore, the effects of down-modulation of BMI1 in normal and leukemic CD34+ AML cells were studied using a lentiviral RNA interference approach. We demonstrate that down-modulation of BMI1 in cord blood CD34+ cells impaired long-term expansion and progenitor-forming capacity, both in cytokine-driven liquid cultures as well as in bone marrow stromal cocultures. In addition, long-term culture-initiating cell frequencies were dramatically decreased upon knockdown of BMI1, indicating an impaired maintenance of stem and progenitor cells. The reduced progenitor and stem cell frequencies were associated with increased expression of p14ARF and p16INK4A and enhanced apoptosis, which coincided with increased levels of intracellular reactive oxygen species and reduced FOXO3A expression. In AML CD34+ cells, down-modulation of BMI1 impaired long-term expansion, whereby self-renewal capacity was lost, as determined by the loss of replating capacity of the cultures. These phenotypes were also associated with increased expression levels of p14ARF and p16INK4A. Together our data indicate that BMI1 expression is required for maintenance and self-renewal of normal and leukemic stem and progenitor cells, and that expression of BMI1 protects cells against oxidative stress.
Introduction
BMI1 is a member of the Polycomb group (PcG) genes, which are transcriptional repressors that play essential roles in the maintenance of appropriate gene expression during development.1-5 Two distinct multiprotein PcG complexes have been identified, the Polycomb repression complex (PRC) 1 and PRC2.1 The PRC2 complex is involved in initiation of silencing and contains histone deacetylases and methyltransferases that can methylate H3 lysine 9 and 27.6 Deletion of PRC2 genes in mice results in embryonic lethality, emphasizing their importance in development.7-9 PRC1 is implicated in stable maintenance of gene repression and recognizes the methylation marks set by PRC2.10,11 Mice mutant for most PRC1 genes survive until birth as a result of partial functional redundancy provided by their homologues, but developmental defects do arise thereafter, as is, for example, the case in the hematopoietic compartment after deletion of BMI1.12-14 Targeted deletion of Bmi1 has shown that although the numbers of fetal liver–derived hematopoietic stem cells (HSCs) are normal in these mice, their proliferative and self-renewal capacity is severely impaired.15,16 In adult Bmi1-deficient mice, the HSCs are less frequent and display an impaired competitive repopulation capacity.16,17 Gain-of-function studies demonstrated enhanced self-renewal of murine HSCs and with a shift in balance toward more symmetric stem cell divisions.17 We have demonstrated that constitutive expression of BMI1 in human cord blood (CB) cells results in prolonged maintenance of the stem cell pool and enhances self-renewal of human stem and progenitor cells.18 BMI1 is a potent negative regulator of the INK4A/ARF locus in embryonic fibroblasts.19 This locus encodes the cell-cycle regulators and tumor suppressor p16 and p19/p14. Increased expression of these genes was observed in the Bmi1-deficient mice.12,16,19,20 However, INK4A/ARF-independent BMI1 targets must exist as well because overexpression of BMI1 in p16/p19-deficient cells still altered HSC self-renewal phenotypes.21
In addition to functions in normal hematopoiesis, BMI1 has been suggested to play a role in leukemogenesis as well.15,22 In a murine model of leukemia, self-renewal of HSCs by expression of HOXA9 and MEIS1 was severely impaired in Bmi1−/− cells.15 Although functional studies have not been performed in primary human leukemic cells, we and others have shown that BMI1 expression is elevated in a variety of hematologic tumors, including non-Hodgkin lymphomas and acute myeloid leukemias (AML).23-26 In chronic myeloid leukemia, BMI1 expression increases with disease progression, and high levels of BMI1 correlate with reduced overall survival.27 A small study performed on AML and myelodysplastic syndrome patients demonstrated that high BMI1 expression correlated with poor overall survival.28 These data suggest that (epigenetic) changes induced by BMI1 in the hematopoietic stem cell likely contribute to the development or maintenance of the leukemic phenotype and require further studies to determine whether pharmaceutical targeting of BMI1 will have beneficial effects on the treatment of patients with acute leukemia.
In this study, we provide evidence that down-modulation of BMI1 using a lentiviral RNA interference (RNAi) approach impairs self-renewal of both normal human CB CD34+ cells as well as primary AML CD34+ cells from patients. Impaired HSC self-renewal was associated with increased expression of the INK4A/ARF locus, increased apoptosis in conjunction with increased levels of reactive oxygen species (ROS), and reduced FOXO3A expression.
Methods
Primary cell isolation
Neonatal CB was obtained after informed consent from healthy full-term pregnancies from the obstetrics departments of the University Medical Center in Groningen (UMCG), Martini Hospital Groningen, and Sophia Hospital in Zwolle. Peripheral blood and bone marrow from untreated patients diagnosed with AML at the UMCG were studied after informed consent and protocol approval by the Medical Ethical Committee of the UMCG, in accordance with the Declaration of Helsinki. After Ficoll separation of mononuclear cells, CD34+ cells were enriched using a magnetically activated cell-sorting CD34 progenitor kit (Miltenyi Biotec).
Lentiviral virus production and infection
Lentiviral vector expressing short hairpins against human BMI1 (CS-H1-shRNA-EF-1α-EGFP) and scrambled lentiviral vectors were a gift from Dr A. Iwama (Chiba University).29 Lentiviral particles were produced by cotransfection of 293T cells with 0.7 μg pcDNA3-VSVg-REV, 3 μg pMDLg-RRE, and 3 μg CS-H1-scrambled (scr) RNAi or CS-H1-BMI1-RNAi. The lentiviral supernatants were collected 24 hours later and were either used directly or stored at −80°C until further use. CB CD34+ cells were cultured for 16 hours in hematopoietic progenitor cell growth medium (HPGM) supplemented with stem cell factor (SCF; 100 ng/mL), Flt3 ligand (Flt3L; 100 ng/mL; both from Amgen), and thrombopoietin (TPO; 100 ng/mL; Kirin), and subsequently transduced on retronectin-coated plates (Takara) in 2 consecutive rounds of 8 and 12 hours with lentiviral supernatant supplemented with the same cytokines and 4 μg/mL polybrene. AML CD34+ blasts were transduced, as previously described.30-33 Briefly, the cells were prestimulated for 4 hours in RPMI supplemented with 10% fetal calf serum (FCS), 20 ng/mL interleukin 3 (IL-3; Gist-Brocades), granulocyte–colony-stimulating factor (Rhone-Poulenc Rorer), and TPO, and afterward transduced on retronectin-coated plates in 3 consecutive rounds of 8 and 12 hours with lentiviral supernatants containing cytokines and polybrene, as indicated above.
Ex vivo culture of primary cells, and colony-forming cell and long-term culture-initiating cell assays
CB stroma-free cultures were propagated in either serum-free HPGM supplemented with SCF, Flt3L, and TPO (all 100 ng/mL), or Iscove modified Dulbecco medium (IMDM) supplemented with 10% FCS, IL-3 (10 ng/mL), and SCF (100 ng/mL). For the CB MS-5 coculture experiments and long-term culture-initiating cell (LTC-IC) assays, cells were grown in α minimum essential medium (BioWhittaker) supplemented with 12.5% heat-inactivated FCS, 12.5% heat-inactivated horse serum (Sigma-Aldrich), penicillin and streptomycin, 2 mM glutamine, 57.2 μM β-mercaptoethanol, and 1 μM hydrocortisone (Sigma-Aldrich). AML blast cells were expanded on MS5 cells using the same coculture medium as for the CB cells, but supplemented with 20 ng/mL IL-3, granulocyte–colony-stimulating factor, and TPO, as described previously.23 The cultures were kept on 37°C and in 5% CO2.
Colony-forming cell (CFC) and LTC-IC assays on MS-5 stromal cells were performed, as previously described.33 Briefly, for the CFC assays, 1000 green fluorescent protein–positive (GFP+) sorted cells were plated in methylcellulose directly after transduction, and 10 000 GFP+ cells were used at later time points. For the LTC-IC assays, GFP+ cells were sorted on MS5 stromal cells in limiting dilutions from 90 to 7290 cells per well in 96-well plates. Five weeks later, the wells containing cobblestone areas were scored, after which the medium from the wells was aspirated and replaced with methylcellulose-containing cytokines. After an additional 2 weeks of culture, wells were scored as positive or negative to yield the LTC-IC frequency.
Western blotting, immunohistochemistry, quantitative real-time polymerase chain reaction, and flow cytometric analysis
Western blot analysis was performed using standard protocols. Antibody against BMI1 (Upstate Biotechnology) was used in a 1/1000 dilution, and anti-GFP antibody (Santa Cruz Biotechnology) was used in a 1/300 dilution. Antibody against FOXO3 (Cell Signaling Technology) was used in 1/200 dilution, and antiactin (C4; ICN Biomedical) in 1/1000 dilution. Anti–rabbit Cy3 (Jackson ImmunoResearch Laboratories) secondary antibody was used in 1/1000 dilution. Slides were analyzed on a Leica DM RXA microscope.
Total RNA was isolated from 105 cells using the RNeasy kit from Qiagen and was reverse transcribed using Moloney murine leukemia virus reverse transcriptase (Fermentas), according to the manufacturer's instructions. Aliquots of cDNA were then real-time amplified using iQ SYBR Green mix (Bio-Rad) on a MyIQ thermocycler (Bio-Rad) and quantified using MyIQ software (Bio-Rad). Hypoxanthine phosphoribosyltransferase expression was used to calculate relative expression levels. Sequences and conditions are available on request.
The fluorescence-activated cell-sorting analyses were performed on a FACSCalibur (BD Biosciences), and sorting of the cells was performed on MoFlow (DakoCytomation). Data were analyzed using WinList 3D (Topsham) and FlowJo (TreeStar) software. Antibodies were obtained from BD Biosciences, and staining of the cells was performed by standard procedures.
Measurement of intracellular ROS levels
Intracellular ROS levels were determined by staining with the probe for 2′,7′-dichlorodihydro-fluorescein diacetate (H2DCFDA; Invitrogen). H2DCFDA was added to the cell suspension of transduced cells to a final concentration of 10 μM, followed by incubation at 37°C for 20 minutes. The cell pellet was resuspended in 500 μL cold phosphate-buffered saline and kept on ice until analyzed on an LSR-II (BD Biosciences). Where indicated, cells were treated with 100 μM N-acetyl cysteine (NAC; A9165; Sigma-Aldrich).
Results
Down-modulation of BMI1 expression in CB CD34+ cells impairs long-term expansion and reduces progenitor and stem cell frequencies
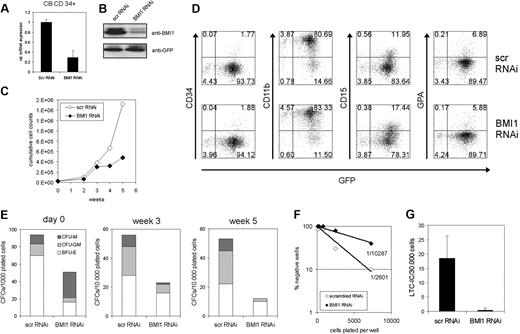
To further elucidate the role of BMI1 in human stem and progenitor cells, we used a lentiviral transduction approach to down-modulate the expression of BMI1. CB CD34+ cells were transduced with efficiencies ranging from 20% to 45% (data not shown), which resulted in a decrease in BMI1 expression of approximately 75% at the RNA level (Figure 1A) and protein level (Figure 1B). Transduced cells were cultured on MS5 bone marrow stroma to study expansion and hematopoietic differentiation. As shown in Figure 1C, the expansion was severely impaired in BMI1-RNAi cells over a culture period of 5 weeks. No effects were observed on the hematopoietic differentiation program (Figure 1D). The presence of progenitor cells was evaluated by plating suspension cells from MS5 cocultures in CFC assays in methylcellulose. Down-modulation of BMI1 resulted in a significant reduction in the number of progenitors already immediately after transduction (Figure 1E, day 0). Upon expansion on MS5, the reduction in progenitors was even further pronounced (Figure 1E). Stem cell frequencies were determined by LTC-IC assays. Both in limiting dilution assays (Figure 1F) as well as assays in bulk in which 30 000 transduced cells were plated on T25 flasks (Figure 1G), a strong reduction in stem cell frequency was observed upon down-modulation of BMI1.
Down-modulation of BMI1 by lentiviral RNAi in human CB CD34+ cells impairs proliferation and reduces CFC and LTC-IC frequencies. (A) CB CD34+ cells were transduced with control (scrambled) scr-RNAi or BMI1-RNAi particles and sorted; mRNA was isolated; and BMI1 expression was analyzed by quantitative reverse transcription (RT)–PCR analysis. (B) As in panel A, but now total lysates were prepared and analyzed by Western blotting. (C) Transduced CB cells were grown in long-term cocultures on MS5 bone marrow stromal cells. Cultures were weekly analyzed, and the growth curve represents cumulative cell numbers during the culture period. A representative experiment of 3 independent experiments is shown. (D) Hematopoietic differentiation was analyzed by FACS on suspension cells from MS5 cocultures at week 1. (E) Suspension cells were harvested from MS5 cocultures, as described in panel C, and progenitor content was determined by CFC assays in methylcellulose. (F-G) Lentiviral transductions as in panel A, but now stem cell frequencies were determined in limiting dilution (F) or in bulk T25 flasks (G).
Down-modulation of BMI1 by lentiviral RNAi in human CB CD34+ cells impairs proliferation and reduces CFC and LTC-IC frequencies. (A) CB CD34+ cells were transduced with control (scrambled) scr-RNAi or BMI1-RNAi particles and sorted; mRNA was isolated; and BMI1 expression was analyzed by quantitative reverse transcription (RT)–PCR analysis. (B) As in panel A, but now total lysates were prepared and analyzed by Western blotting. (C) Transduced CB cells were grown in long-term cocultures on MS5 bone marrow stromal cells. Cultures were weekly analyzed, and the growth curve represents cumulative cell numbers during the culture period. A representative experiment of 3 independent experiments is shown. (D) Hematopoietic differentiation was analyzed by FACS on suspension cells from MS5 cocultures at week 1. (E) Suspension cells were harvested from MS5 cocultures, as described in panel C, and progenitor content was determined by CFC assays in methylcellulose. (F-G) Lentiviral transductions as in panel A, but now stem cell frequencies were determined in limiting dilution (F) or in bulk T25 flasks (G).
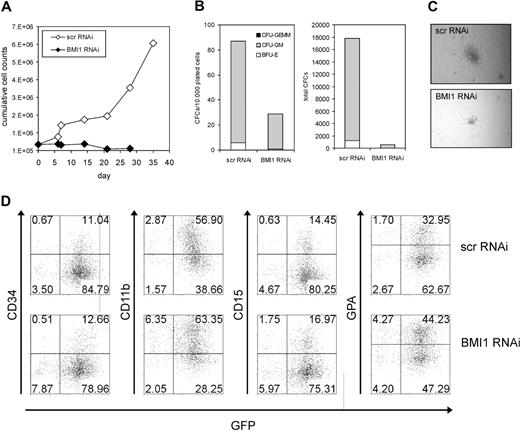
Besides MS5 bone marrow stromal cocultures, stroma-independent cultures were also initiated. Similar results were obtained, whereby down-modulation of BMI1 resulted in an even more dramatic decrease in expansion in cytokine-driven liquid cultures (Figure 2A) and progenitor frequencies (Figure 2B). Not only was the number of CFCs strongly reduced, the size of colonies also was reduced upon BMI1 down-modulation (Figure 2C). No significant effects were observed on hematopoietic differentiation upon down-modulation of BMI1 (Figure 2D).
Knockdown of BMI1 reduces cell growth and CFC formation in liquid culture conditions. (A) CB CD34+ cells were transduced with control (scrambled) scr-RNAi or BMI1-RNAi particles, sorted, and plated in stroma-free liquid conditions (IMDM supplemented with 10% FCS, 10 ng/mL IL-3, and 100 ng/mL TPO). Cumulative expansion is shown of a representative experiment of 3 independent experiments. (B) Progenitor content was determined by CFC assays in methylcellulose at week 2 of liquid culture. CFCs per 10 000 cells (left panel) as well as the total amount of generated CFCs (right panel) are shown. (C) Representative micrographs of colonies in methylcellulose displaying a reduction in colony size after BMI1 knockdown in cells from week 2 liquid cultures. (D) Hematopoietic differentiation was analyzed by FACS on suspension cells from MS5 cocultures at week 1.
Knockdown of BMI1 reduces cell growth and CFC formation in liquid culture conditions. (A) CB CD34+ cells were transduced with control (scrambled) scr-RNAi or BMI1-RNAi particles, sorted, and plated in stroma-free liquid conditions (IMDM supplemented with 10% FCS, 10 ng/mL IL-3, and 100 ng/mL TPO). Cumulative expansion is shown of a representative experiment of 3 independent experiments. (B) Progenitor content was determined by CFC assays in methylcellulose at week 2 of liquid culture. CFCs per 10 000 cells (left panel) as well as the total amount of generated CFCs (right panel) are shown. (C) Representative micrographs of colonies in methylcellulose displaying a reduction in colony size after BMI1 knockdown in cells from week 2 liquid cultures. (D) Hematopoietic differentiation was analyzed by FACS on suspension cells from MS5 cocultures at week 1.
Taken together, these data indicate that down-modulation of BMI1 in human CD34+ cells reduces their proliferative capacity and leads to impaired maintenance of stem and progenitor cells.
BMI1 down-modulation increases apoptosis and ROS accumulation
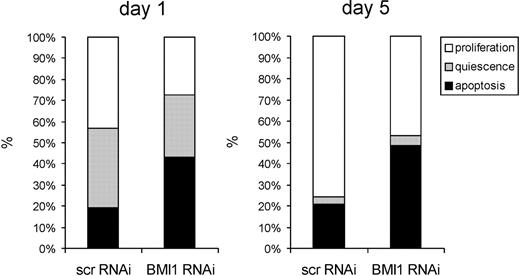
Because both in stroma-free and coculture experiments BMI1 knockdown resulted in impaired proliferation and reduced progenitor and stem cell frequencies, we wanted to determine whether these effects were due to increased apoptosis. To address this question, we first single cell sorted CD34+/CD38−-transduced scr-RNAi and BMI1-RNAi cells in 96-well plates in liquid culture supplemented with SCF and IL-3 and monitored each well microscopically. The number of cells per well was enumerated after 1 and 5 days of culture. If a well contained a single cell, it was classified as quiescence; if multiple cells were observed, it was classified as proliferation; and if no cells were seen, it was classified as apoptosis. Within 24 hours after plating, the number of apoptotic cells was significantly higher in BMI1-RNAi–transduced cells, whereas fewer proliferating and quiescent cells were observed (Figure 3). After 5 days, the majority of quiescent cells had started to proliferate in both scr-RNAi– as well as BMI1-RNAi–transduced cells, whereby the number of apoptotic wells remained significantly higher in the cells in which BMI1 was down-modulated. These data suggest that under stringent stroma-free conditions in human HSCs, apoptosis is more dominantly affected than quiescence upon depletion of BMI1.
BMI1 knockdown induces apoptosis in CD34+38− cells. CB CD34+ cells were transduced with control (scrambled) scr-RNAi or BMI1-RNAi particles and sorted, and single cells were deposited in 96-well plates and cultured in stroma-free conditions (IMDM supplemented with 10% FCS, 10 ng/mL IL-3, and 100 ng/mL TPO). Wells were evaluated microscopically 1 day and 5 days after plating, and wells were classified as quiescence if 1 live cell was observed; if multiple cells were observed, they were classified as proliferation; and if no cells were seen, they were classified as apoptosis. A representative experiment of 3 independent experiments is shown, whereby individual 96 wells per group were analyzed.
BMI1 knockdown induces apoptosis in CD34+38− cells. CB CD34+ cells were transduced with control (scrambled) scr-RNAi or BMI1-RNAi particles and sorted, and single cells were deposited in 96-well plates and cultured in stroma-free conditions (IMDM supplemented with 10% FCS, 10 ng/mL IL-3, and 100 ng/mL TPO). Wells were evaluated microscopically 1 day and 5 days after plating, and wells were classified as quiescence if 1 live cell was observed; if multiple cells were observed, they were classified as proliferation; and if no cells were seen, they were classified as apoptosis. A representative experiment of 3 independent experiments is shown, whereby individual 96 wells per group were analyzed.
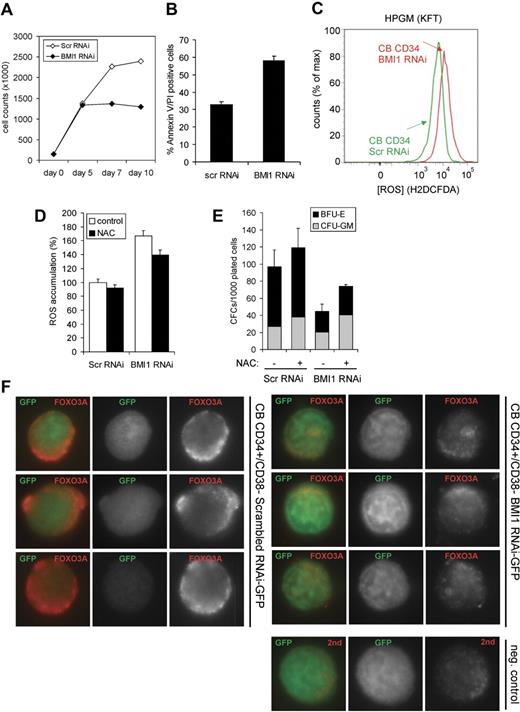
Next, we cultured scr-RNAi– and BMI1-RNAi–transduced CB CD34+ cells in serum-free conditions (HPGM supplemented with SCF, Flt3L, and SCF) for 10 days. A strongly reduced expansion was observed upon down-modulation of BMI1 (Figure 4A), which was associated with increased levels of apoptosis as determined by propidium iodide (PI)/annexinV staining (Figure 4B). Furthermore, intracellular ROS levels were determined by FACS using H2DCFDA, and these studies revealed that down-modulation of BMI1 in CB CD34+ cells results in increased ROS accumulation (Figure 4C). Elevated ROS levels in BMI1-RNAi–transduced cells could be partially restored by treatment with 100 μM NAC (Figure 4D). This coincided with a partial, but not complete, restored progenitor frequency, as determined by methylcellulose assays (Figure 4E). Because ROS production and the regulation of apoptosis have been tightly associated with FOXO3A signaling in murine HSCs, we studied FOXO3A expression levels in transduced CB cells. Scr-RNAi– and BMI1-RNAi–transduced CD34+/CD38− cells were sorted onto microscopy slides and stained for FOXO3A expression. As shown in Figure 4F, CB CD34+/CD38− cells expressed FOXO3A, which was mostly localized in the cytoplasm after 4 days of prestimulation and transduction in HPGM supplemented with SCF, Flt3L, and TPO. Down-modulation of BMI1 resulted in a strongly reduced expression of FOXO3A (Figure 4F).
Apoptosis induced by BMI1 down-modulation coincides with elevated ROS accumulation and reduced FOXO3A expression. (A) Transduced CB CD34+ cells were cultured in serum-free conditions (HPGM supplemented with SCF and Flt3L) for 10 days, and expansion was monitored. (B) The percentage of apoptotic cells at day 10 was determined by FACS staining for annexin V and PI. (C) Transduced cells were cultured in conditions described in (A), and at day 10 were stained with H2DCFDA to determine the intracellular levels of ROS by FACS. (D) Transduced cells were cultured in the absence or presence of 100 μM NAC for 9 days, after which ROS accumulation was determined by FACS. (E) CFC assays were performed with transduced cells in methylcellulose cultures in the absence or presence of 100 μM NAC. (F) CB CD34+ cells were transduced with control (scrambled) scr-RNAi or BMI1-RNAi, and CD34+38− GFP+ cells were sorted on glass slides. Immunohistochemical staining was performed using antibodies against FOXO3A.
Apoptosis induced by BMI1 down-modulation coincides with elevated ROS accumulation and reduced FOXO3A expression. (A) Transduced CB CD34+ cells were cultured in serum-free conditions (HPGM supplemented with SCF and Flt3L) for 10 days, and expansion was monitored. (B) The percentage of apoptotic cells at day 10 was determined by FACS staining for annexin V and PI. (C) Transduced cells were cultured in conditions described in (A), and at day 10 were stained with H2DCFDA to determine the intracellular levels of ROS by FACS. (D) Transduced cells were cultured in the absence or presence of 100 μM NAC for 9 days, after which ROS accumulation was determined by FACS. (E) CFC assays were performed with transduced cells in methylcellulose cultures in the absence or presence of 100 μM NAC. (F) CB CD34+ cells were transduced with control (scrambled) scr-RNAi or BMI1-RNAi, and CD34+38− GFP+ cells were sorted on glass slides. Immunohistochemical staining was performed using antibodies against FOXO3A.
Down-modulation of BMI1 in AML CD34+ cells impairs their long-term expansion
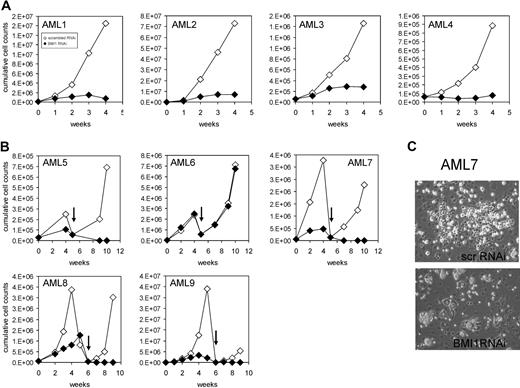
Previous experiments by us and others have revealed an increased expression of BMI1 within CD34+ cells in the peripheral blood and bone marrow from AML patients.23,24 We were interested in the effects of down-modulation of BMI1 on proliferation and self-renewal in this population. CD34+ cells were isolated from the peripheral blood or bone marrow of AML patients of various French-American-British classifications and risk groups (n = 9, Table 1) because this fraction is enriched for leukemia-initiating cells, followed by transduction with Scr-RNAi or BMI1-RNAi vectors. Transduction efficiencies ranged from 25% to 50% for both groups (data not shown). Real-time polymerase chain reaction (PCR) analysis was performed to determine BMI1 expression levels in transduced cells, and efficient down-modulation of BMI1 was established in almost all cases (see Figure 6 and data not shown). Proliferation of transduced cells was determined in long-term MS5 cocultures. In all but one case, expansion was severely impaired upon down-modulation of BMI1 (Figure 5A-B). In AML 6, we were not able to efficiently down-regulate BMI1 expression levels (data not shown). Within these MS5 cocultures, we typically observe the formation of cobblestone areas underneath the stroma within 2 to 5 weeks after plating, and these leukemic cobblestone areas (L-CAs) contain self-renewing properties and can be harvested and replated to give rise to new long-term expanding cultures and L-CAs.23 As depicted in Figure 5B and C, scr-RNAi–transduced cultures could be harvested and replated to give rise to long-term expanding second cocultures and L-CAs, indicative for self-renewal properties. In contrast, no second cultures could be established from the BMI1-RNAi–transduced AML CD34+ cultures, indicating that self-renewal was severely impaired (Figure 5B-C). Replating could be established in the transduced AML 6, but as mentioned above, we did not succeed in efficient down-modulation of BMI1 in this AML case.
Patient characteristics
| Patient ID . | % CD34 . | BM/PB . | FLT3 ITD . | Karyotype . | Risk group . |
|---|---|---|---|---|---|
| 1 | 70 | PB | − | +3q;−7;−10 | Poor |
| 2 | 26 | PB | − | bcr-abl, inv16 | Poor |
| 3 | 5 | BM | + | Normal | Intermediate |
| 4 | 70 | BM | − | 5q−; trisomy 6 | Poor |
| 5 | 86 | BM | + | Normal | Intermediate |
| 6 | 54 | BM | + | Normal | Intermediate |
| 7 | 30 | BM | − | Normal | Intermediate |
| 8 | 91 | BM | − | Normal | Intermediate |
| 9 | 85 | PB | + | Normal | Intermediate |
BM indicates bone marrow; PB, peripheral blood; and ITD, internal tandem duplication.
BMI1 is required for long-term growth and self-renewal of AML CD34+ cells. (A) AML CD34+ cells from different FAB subclassification were transduced with scrambled RNAi or BMI1-RNAi lentiviral vectors, and long-term cultures on MS5 bone marrow stromal cells were performed. Expansion was monitored weekly, and cumulative cell counts are shown. (B) Experiment as in panel A, but now transduced AML CD34+ cells were cultured on MS5 for a period of 5 to 6 weeks, after which human CD45+ cells were harvested and replated onto new MS5 cells, followed by an additional culturing period of 4 to 5 weeks. (C) Representative micrographs of cobblestone area-forming cells present in MS5 cocultures at week 4 initiated with AML CD34+ cells transduced with scrambled RNAi or BMI1-RNAi lentiviral vectors. Pictures were taken with a Leica DM-IL microscope (Leica Microsystems) with a 20×/0.30 objective.
BMI1 is required for long-term growth and self-renewal of AML CD34+ cells. (A) AML CD34+ cells from different FAB subclassification were transduced with scrambled RNAi or BMI1-RNAi lentiviral vectors, and long-term cultures on MS5 bone marrow stromal cells were performed. Expansion was monitored weekly, and cumulative cell counts are shown. (B) Experiment as in panel A, but now transduced AML CD34+ cells were cultured on MS5 for a period of 5 to 6 weeks, after which human CD45+ cells were harvested and replated onto new MS5 cells, followed by an additional culturing period of 4 to 5 weeks. (C) Representative micrographs of cobblestone area-forming cells present in MS5 cocultures at week 4 initiated with AML CD34+ cells transduced with scrambled RNAi or BMI1-RNAi lentiviral vectors. Pictures were taken with a Leica DM-IL microscope (Leica Microsystems) with a 20×/0.30 objective.
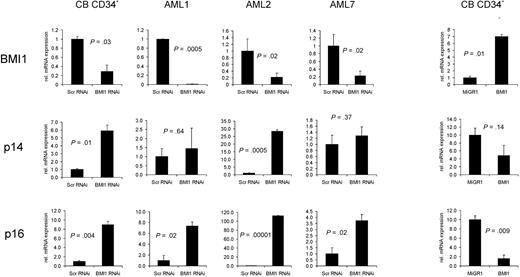
Down-regulation of BMI1 expression in CB or AML CD34+ cells results in derepression of p14ARF and p16INK4a. CB or AML CD34+ cells were transduced with scrambled RNAi or BMI1-RNAi lentiviral vectors and sorted, and RNA was isolated. Quantitative RT-PCRs were performed to determine the expression levels of BMI1, p14ARF, and p16INK4a. As a control, BMI1 was overexpressed in CB CD34+ cells, and quantitative RT-PCR analysis was performed (right panels).
Down-regulation of BMI1 expression in CB or AML CD34+ cells results in derepression of p14ARF and p16INK4a. CB or AML CD34+ cells were transduced with scrambled RNAi or BMI1-RNAi lentiviral vectors and sorted, and RNA was isolated. Quantitative RT-PCRs were performed to determine the expression levels of BMI1, p14ARF, and p16INK4a. As a control, BMI1 was overexpressed in CB CD34+ cells, and quantitative RT-PCR analysis was performed (right panels).
To determine whether repression of the INK4A/ARF locus was relieved upon down-modulation of BMI1, quantitative-PCR analysis was performed on transduced CB and AML CD34+ cells. As shown in Figure 6, down-modulation of BMI1 in both normal as well as leukemic CD34+ cells resulted in a rapid increase in p14, but most notably p16 expression, although the levels to which the expression were elevated varied between AML cases. Reversely, overexpression of BMI1 in CB CD34+ cells resulted in a decrease in p16 and p14 expression, as demonstrated previously.18 Together, these data indicate that expansion and self-renewal of primary leukemic AML CD34+ cells depend on BMI1 expression, which coincides with repression of the cell cycle regulators p16 and p19/p14.
Discussion
PcG proteins have been implicated in the regulation of self-renewal in a range of different stem cell systems. In mouse models, it has been shown that BMI1, a component of the PRC1 complex, is required for the maintenance of self-renewing hematopoietic stem and progenitor cells.15-17 Our studies using human models have demonstrated that enforced expression of BMI1 is a powerful mediator of maintenance and self-renewal of human hematopoietic stem and progenitor cells as well.18 Various reports have described that BMI1 is expressed in a variety of tumor populations.22,34,35 We and others have observed that the expression of BMI1 is often increased in leukemic peripheral blood and bone marrow CD34+ cells.23,24 However, it has remained elusive whether the expression of BMI1 is required to maintain human stem and progenitor cells, in particular those that belong to the leukemic clone.
In the present study using efficient lentiviral loss-of-function assays, we first examined the effect of BMI1 down-modulation in CB CD34+ cells. Our data show that the proliferative capacity of CD34+ cells was significantly impaired. Specifically, progenitor and stem cell frequencies were strongly reduced, as determined by CFC and LTC-IC assays, suggesting that it is particularly the immature hematopoietic compartment that is affected. The bone marrow microenvironment has been attributed with protective effects on the stem/progenitor cell compartment, and we therefore performed experiments in both bone marrow stromal cocultures as well as in more stringent cytokine-driven liquid culture conditions. We observed reduced progenitor and stem cell frequencies in both liquid cultures as well as bone marrow stromal cocultures, although the effects under liquid culture conditions were more pronounced. Thus, these data suggest that cell-intrinsic pathways are affected by BMI1 depletion, but that the presence of a protective microenvironment can compensate for these effects to some extent. Importantly, we find that expansion of human leukemic stem and progenitor cells also depends heavily on the expression of BMI1. Lentiviral down-modulation of BMI1 in AML CD34+ cells severely impaired their long-term growth in MS5 bone marrow stromal cocultures, and the formation of leukemic cobblestone areas was reduced. Whereas leukemic cocultures initiated with AML CD34+ cells can readily be expanded and serially replated onto new bone marrow stroma, indicative for self-renewal properties, we failed to initiate second MS5 cocultures with BMI1-RNAi–transduced AML CD34+ cells.
Several molecular mechanisms could underlie our observed phenotypes. In murine HSCs, overexpression of BMI1 results in enhanced symmetric cell divisions.17 Although the mechanisms involved are not elucidated yet, it might be associated with a symmetric distribution of cell fate determinants such that the stem cell pool can be expanded. Reversely, loss of BMI1 resulted in loss of HSC self-renewal as determined in competitive repopulation assays.15-17 Furthermore, in murine Bmi1−/− HSCs, self-renewal was impaired, which was at least in part mediated via a derepression of p16-INK4A and p19-ARF.21 We also find that p19/p14 and p16 expression is elevated in both normal as well as leukemic human CD34+ cells upon down-modulation of BMI1, suggesting a direct link between BMI1 expression and repression of this locus in human AML. Derepression of the INK4A and ARF genes might result in premature senescence, as has been shown in mouse embryonic fibroblasts,19 and it is plausible that this might be involved in the impaired long-term expansion phenotypes that we observed in our cultures as well. However, we also observed rather immediate effects upon down-modulation of BMI1 in the hematopoietic compartment. Within a few days after transduction, strongly reduced cell counts were observed, particularly under more stringent liquid culture conditions. A strong increase in PI/annexinV+ apoptotic cells was observed upon down-modulation of BMI1 in CB CD34+ cells, and also in the most immature CD34+/CD38− stem cell population transduced with BMI1-RNAi we observed increased rates of apoptosis. Previously, in mouse Bmi1−/− BM, slightly enhanced apoptosis was noted, although in CD34−KSL clonal cultures no signs of apoptosis were observed upon depletion of BMI1.17 These observations might reflect differences between mouse and human stem/progenitor cells, but it is perhaps more likely that the conditions under which the cells were studied might have been less stringent, as we also observe the highest apoptosis rates under more stringent conditions. Our data are in line with our previously reported gain-of-function analyses, in which enforced expression of BMI1 led to a proliferative advantage and increased stem cell and progenitor frequencies of CB CD34+ and CD34+38− cells, which were associated with reduced levels of apoptosis.18 In addition, a recent study in the NB4 cell line indicated that down-modulation of SALL4, an upstream regulator of BMI1, resulted in increased apoptosis, which could be reversed by reintroduction of BMI1.36
Although further studies are required to reveal the underlying molecular mechanisms, it is intriguing that the BMI1-RNAi–induced apoptosis coincides with increased levels of ROS accumulation and a reduction in FOXO3A expression. In mouse studies, it has been shown that up-regulation of p16 and p19 leads to increased ROS production in Atm−/− mice, which resulted in a loss of the HSC pool.37 These data suggest that HSCs and progenitors contain lower levels of ROS compared with their mature progeny, and that these differences are critical for maintaining stem cell function. As we indeed find elevated expression levels of p16 and p14 by BMI1 knockdown, these data might suggest that derepression of p16 and p14 could account for the impaired self-renewal of the BMI1-RNAi cells mediated by an increase in ROS accumulation. Furthermore, it has been demonstrated that FOXO3A is essential for ataxia telangiectasia mutated expression, and that loss of FOXO3A leads to defects in the hematopoietic stem cells.38,39 FoxO3A−/− HSCs are defective in their competitive repopulation capacity, associated with an elevation of ROS levels.39 Although in the FoxO3A-deficient mice no effects were observed on apoptosis, mice in which FOXO1, 3, and 4 were deleted a significant increase in apoptosis was noted, both in the HSC as well as myeloid progenitor compartment.39,40 In human stem and progenitor cells, we have now coupled loss of BMI1 expression to enhanced apoptosis, possibly mediated via down-regulation of FOXO3A resulting in accumulation of ROS. Thus, BMI1 might be required to protect hematopoietic stem/progenitor cells from apoptosis induced by oxidative stress conditions. Treatment with NAC was able, at least in part, to restore progenitor frequencies in BMI1-RNAi–transduced cells. Interestingly, however, progenitor frequencies were not completely restored to control levels by NAC treatment. This might be because ROS accumulation in BMI1-RNAi–transduced cells was only partially restored by NAC treatment, or that ROS-independent pathways still play a role as well in the induction of apoptosis. Previously, we have observed that overexpression of BMI1 in human CD34+ cells results in HSC maintenance, as determined by nonobese diabetic-severe combined immunodeficiency engraftability, even when cells are cultured under high oxygen conditions outside of the bone marrow microenvironment.18 Although further evidence needs to be provided, it is tempting to speculate that in human leukemias, besides facilitating symmetric stem cell divisions, the leukemic stem cell might use enhanced expression of BMI1 as a mode to protect itself from oxidative stress. Our observations are in line with a recent paper indicating that absence of BMI1 impairs mitochondrial function and the DNA damage response pathway.41 Thus, because BMI1 is frequently overexpressed in human leukemias,23,27 it will be interesting to determine whether a therapeutic window exists for the targeting of BMI1 as a treatment modality in AML.
The publication costs of this article were defrayed in part by page charge payment. Therefore, and solely to indicate this fact, this article is hereby marked “advertisement” in accordance with 18 USC section 1734.
Acknowledgments
We thank Dr Atsushi Iwama (Chiba University) and Dr Miyazaki (RIKEN Research Center) for providing the CS-H1-shRNA-EF-1α-EGFP lentiviral vector. We also acknowledge Geert Mesander and Henk Moes for help with flow cytometry, and Kirin Brewery and Amgen for providing cytokines. We greatly appreciate the help of Dr J. J. Erwich, Dr A. van Loon, and Dr H. H. de Haan and colleagues (Obstetrics Departments of University Medical Center Groningen, Martini Hospital Groningen, and Sophia Hospital in Zwolle) for collecting cord blood.
This work was supported by grants from the European Union (Eurythron Marie Curie Training Network EU FP6), NWO-VENI (2004), NWO-VIDI (2008), NWO-VICI (2007), and KWF (RUG 2009-4275).
Authorship
Contribution: A.R. designed and performed research, collected, analyzed and interpreted data, and wrote the paper; S.O. and L.H. performed research; E.V. and G.d.H. interpreted data and contributed to writing of the manuscript; and J.J.S. designed research, interpreted data, and wrote the manuscript.
Conflict-of-interest disclosure: The authors declare no competing financial interests.
Correspondence: Jan Jacob Schuringa (requests for reprints) or Gerald de Haan, University of Groningen, University Medical Center Groningen, Hanzeplein 1, 9700 RB, Groningen, The Netherlands; e-mail: j.schuringa@int.umcg.nl or g.de.haan@med.umcg.nl.

This feature is available to Subscribers Only
Sign In or Create an Account Close Modal