Abstract
MPNs often transform into secondary AML associated with poor prognosis and high mortality due to limited therapeutic options. Here we show that aberrant Hedgehog ligand secretion in MPN and CML not only induces constitutive Smoothened-dependent canonical HH signaling causing GLI1 transcription, but also causes PTCH1-dependent non-canonical HH signaling leading to constitutive ERK activation.
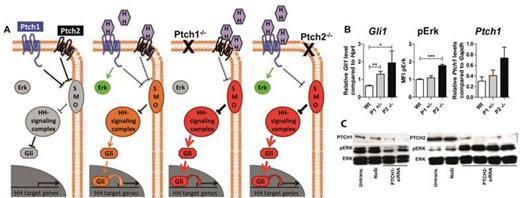
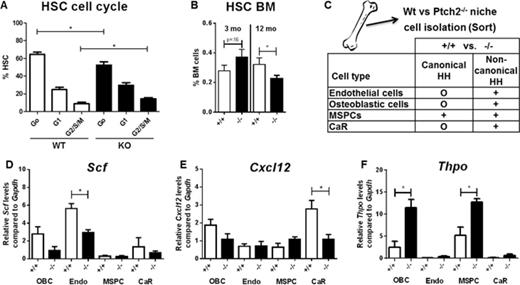
Our investigations show, that depletion of the Ptch2 receptor in vitro and in vivo recapitulates overactivation of both pathways, while depletion of Ptch1 only reflects constitutive Gli1 activation pinpointing the important role of Ptch1 for Erk activation (Figure 1). Ptch2-/- mice develop a pronounced hematopoietic phenotype with leukocytosis driven by an increase in neutrophils, anemia, thrombocytopenia, loss of T cells combined with a strong increase of cKit+ progenitor and stem cells in the peripheral blood and increased extramedullary hematopoiesis causing splenomegaly reflecting a MPN phenotype. HSCs (Lin- cKit+ Sca1+) residing within the BM (bone marrow) showed enhanced cycling properties causing exhaustion and loss of LKS cells over time (Figure 2), but improved stress hematopoiesis after 5-FU treatment. Niche change experiments show that cytopenias and loss of LKS cells are caused by overactivated HH signaling within the niche cells, causing depletion of osteoblasts and alterations of essential niche factors like Cxcl12, Angiopoietin, Stem cell factor, Thrombopoietin or Jagged1 (Figure 2). In contrast, the hematopoietic Ptch2-/- is responsible for leukocytosis and even promotes HSC expansion and replating capacity in vitro.
Interestingly, depletion of Ptch2 in the niche or within hematopoietic cells dramatically altered JAK2V617F-driven pathogenesis causing transformation of a non-lethal chronic myeloproliferative disease into an aggressive AML-like disease with up to 30% blasts in the peripheral blood (Figure 3). In contrast, the BCR-ABL-driven leukemia was exclusively accelerated by the cell intrinsic Ptch2-/-, but not by cell extrinsic HH activation.
In conclusion, combined constitutive canonical and non-canonical HH activation induced by depletion of Ptch2 causes a MPN phenotype driven by cell intrinsic, but mainly cell extrinsic mechanisms and accelerates myeloproliferative diseases caused by JAK2V617F and BCR-ABL into acute leukemias. Therefore HH ligand-blocking antibodies or a combination of ERK and SMO inhibitors might be a potential treatment option to prevent transformation of MPNs.
Diagram showing canonical and non-canonical HH signaling in Wt, Ptch1-/- and Ptch2-/- cells. Depletion of Ptch1 causes canonical pathway activation driving Gli1 transcription but lacks activation of Erk. In contrast, depletion of Ptch2 induces canonical Gli transcription and also directs HH ligands towards Ptch1 increasing non-canonical Erk phosphorylation. B BM cells of Wt, Ptch1+/- and Ptch2-/- mice were checked for Gli1 and Ptch1 expression via qPCR (transcript levels are shown relative to Hprt or Gapdh) and for Erk phosphorylation via flow cytometry (n≥3 each genotype, t-test). C Western Blot of 293T cells transfected with siRNA against Ptch1 or Ptch2 and blotted with antibodies against Ptch1, Ptch2, pErk and total Erk.
Diagram showing canonical and non-canonical HH signaling in Wt, Ptch1-/- and Ptch2-/- cells. Depletion of Ptch1 causes canonical pathway activation driving Gli1 transcription but lacks activation of Erk. In contrast, depletion of Ptch2 induces canonical Gli transcription and also directs HH ligands towards Ptch1 increasing non-canonical Erk phosphorylation. B BM cells of Wt, Ptch1+/- and Ptch2-/- mice were checked for Gli1 and Ptch1 expression via qPCR (transcript levels are shown relative to Hprt or Gapdh) and for Erk phosphorylation via flow cytometry (n≥3 each genotype, t-test). C Western Blot of 293T cells transfected with siRNA against Ptch1 or Ptch2 and blotted with antibodies against Ptch1, Ptch2, pErk and total Erk.
Cell cycle analysis of HSCs (Lin- cKit+ Sca1+) cells using Ki67 and FxCycle Violet Stain (n = 3). B Percentage of HSCs within the BM assessed by flow cytometry (n ≥ 6 each genotype) at 3 and 12 months of age. C BM niche cells from Wt and Ptch2-/- mice were purified via FACS. RNA samples were analyzed via Affymetrix GeneChip Mouse Gene ST 2.0 and evaluated via KEGG and oncogenic signature gene sets. + indicates significantly increased canonical or non-canonical HH-signaling pathway within specified Ptch2-/- subpopulations. D-F qPCR for Scf (D), Cxcl12 (E) and Thpo (F) in sorted OBCs, MSPCs, Endo and CaR cells purified from Wt and Ptch2-/- mice. Transcript levels are shown relative to Gapdh.
Cell cycle analysis of HSCs (Lin- cKit+ Sca1+) cells using Ki67 and FxCycle Violet Stain (n = 3). B Percentage of HSCs within the BM assessed by flow cytometry (n ≥ 6 each genotype) at 3 and 12 months of age. C BM niche cells from Wt and Ptch2-/- mice were purified via FACS. RNA samples were analyzed via Affymetrix GeneChip Mouse Gene ST 2.0 and evaluated via KEGG and oncogenic signature gene sets. + indicates significantly increased canonical or non-canonical HH-signaling pathway within specified Ptch2-/- subpopulations. D-F qPCR for Scf (D), Cxcl12 (E) and Thpo (F) in sorted OBCs, MSPCs, Endo and CaR cells purified from Wt and Ptch2-/- mice. Transcript levels are shown relative to Gapdh.
Kaplan-Meier survival of WT or Ptch2-/- C57BL/6 mice transplanted with JAK2V617F-GFP or empty-GFP transduced WT or Ptch2-/- C57BL/6 BM cells (n≥5 each group). B PB samples were analyzed for cKit+ CD11b+ myeloid blasts by flow cytometry. Bethesda criteria published 2002 claim 20% blasts as critical value between MPN and AML. C Representative image of the pronounced splenomegaly within the Ptch2-/- group.
Kaplan-Meier survival of WT or Ptch2-/- C57BL/6 mice transplanted with JAK2V617F-GFP or empty-GFP transduced WT or Ptch2-/- C57BL/6 BM cells (n≥5 each group). B PB samples were analyzed for cKit+ CD11b+ myeloid blasts by flow cytometry. Bethesda criteria published 2002 claim 20% blasts as critical value between MPN and AML. C Representative image of the pronounced splenomegaly within the Ptch2-/- group.
No relevant conflicts of interest to declare.
Author notes
Asterisk with author names denotes non-ASH members.


This feature is available to Subscribers Only
Sign In or Create an Account Close Modal