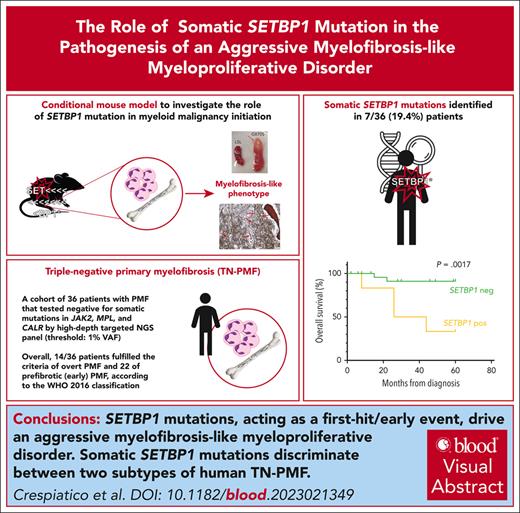
SETBP1 mutations, acting as a first-hit/early event, drive an aggressive myelofibrosis-like myeloproliferative disorder.
SETBP1 mutations discriminate between 2 subtypes of triple-negative myelofibrosis, with different genetic landscape and aggressiveness.
Visual Abstract
SETBP1 mutations are found in various clonal myeloid disorders. However, it is unclear whether they can initiate leukemia, because SETBP1 mutations typically appear as later events during oncogenesis. To answer this question, we generated a mouse model expressing mutated SETBP1 in hematopoietic tissue: this model showed profound alterations in the differentiation program of hematopoietic progenitors and developed a myeloid neoplasm with megakaryocytic dysplasia, splenomegaly, and bone marrow fibrosis, prompting us to investigate SETBP1 mutations in a cohort of 36 triple-negative primary myelofibrosis (TN-PMF) cases. We identified 2 distinct subgroups, one carrying SETBP1 mutations and the other completely devoid of somatic variants. Clinically, a striking difference in disease aggressiveness was noted, with patients with SETBP1 mutation showing a much worse clinical course. In contrast to myelodysplastic/myeloproliferative neoplasms, in which SETBP1 mutations are mostly found as a late clonal event, single-cell clonal hierarchy reconstruction in 3 patients with TN-PMF from our cohort revealed SETBP1 to be a very early event, suggesting that the phenotype of the different SETBP1+ disorders may be shaped by the opposite hierarchy of the same clonal SETBP1 variants.
Introduction
Somatic SETBP1 mutations are found in various myeloid disorders covering both myeloproliferative neoplasms (MPNs) and myelodysplastic syndromes (MDSs).1-6 What factors direct SETBP1-mutated disease toward a specific phenotype is not yet understood. Because SETBP1 mutations usually coexist with additional oncogenic variants, it is possible that the combination and/or the clonal hierarchy of the different mutations may have an impact on the outcome. We, and others, described SETBP1 mutations as a secondary acquisition, rather than a founding event, in leukemia progression.3-8
SETBP1 mutations are clustered in a hot spot region controlling SETBP1 protein stability. In the past, we demonstrated that mutated SETBP1 accumulates because of impaired ubiquitin-mediated degradation and stabilizes the SET oncoprotein, which inhibits the PP2A tumor suppressor.1 In addition, SETBP1 directly regulates transcription via binding to transcriptional complexes.9,10 Ectopic expression of mutant SETBP1 can immortalize murine myeloid progenitors in vitro11; these progenitors are able to generate myeloid leukemia and accelerate CSF3R-driven MPN in transplanted recipient mice.12,13 However, whether SETBP1 mutations can initiate leukemia in vivo is not yet known. To answer this question, we generated a conditional mouse model that expresses SETBP1G870S mutant in the entire hematopoietic tissue since embryonic life, through Cre-mediated recombination driven by the Vav1 promoter.14,15 The mice developed a chronic myeloid disorder with myelofibrosis, caused by an extensive subversion of the normal hematopoietic differentiation program. Intriguingly, patients diagnosed with primary myelofibrosis (PMF) lacking the classical genetic drivers were found to carry SETBP1 mutations as the first hit, suggesting that the timing of appearance of SETBP1 mutations along tumor history dictates the phenotype of the disease.
Methods
Patients and study design
All patients analyzed met the diagnosis of PMF, in early or overt phase according to the World Health Organization (WHO) 2016 classification.16 An MDS/MPN overlap syndrome diagnosis was excluded based on the presence of major and minor criteria for PMF as per WHO guidelines. Histological examination was performed at local institution; fibrosis was graded according to the European Consensus Grading System.17 All patients provided written informed consent approved by the institutional ethical committee (Protocol 0040864/19). The study was conducted in accordance with the Declaration of Helsinki. For single-cell RNA sequencing, next-generation sequencing, flow cytometry, and mouse model description refer to supplemental Methods, available on the Blood website.
Results
SETBP1G870S induces a myelofibrosis-like disorder in mice
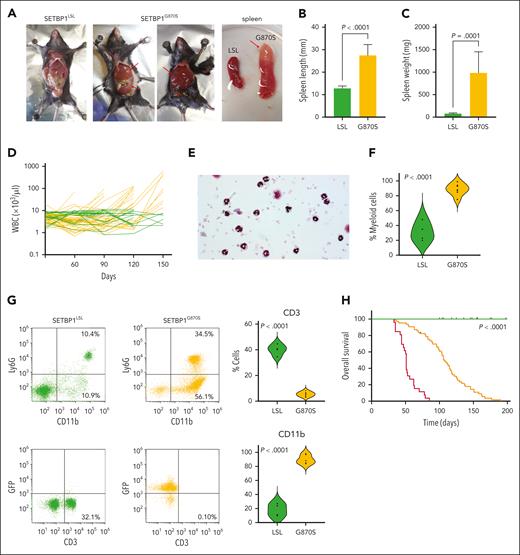
To investigate the role of SETBP1 mutations in the onset of leukemia, we generated a conditional mouse model that mimics the accumulation of mutated SETBP1 protein in bone marrow (BM) and peripheral blood (PB) cells (SETBP1G870S mice; supplemental Figures 1 and 2A-B); the mouse carries a human SETBP1-G870S mutant gene at the Rosa26 locus that can be expressed from the artificial CAG promoter after removal of a floxed transcriptional stop. SETBP1G870S pups did not show any differences in dimensions, mobility, and viability compared with nonrecombined (SETBP1LSL) control littermates. However, in all SETBP1G870S mice, signs of a hematological disease appeared between 30 and 90 days after birth. Exploration of visceral organs showed massive hepatosplenomegaly (Figure 1A-C). Longitudinal analysis revealed accumulation of white blood cells (WBCs) in virtually all heterozygous SETBP1G870S mice (Figure 1D). Morphological and flow cytometry analyses performed on the PB showed a marked imbalance between the lymphoid and myeloid lineages in favor of the latter, with an impressive increase of mature myeloid cells and a dramatic reduction in the percentage of lymphocytes compared with controls (Figure 1E-G; supplemental Figure 2C-F). Unlike MDS/MPN with neutrophilia and related MDS/MPN disorders, no evidence of granulocytic dysplasia was noted in this mouse model. Also, no circulating blasts or nonsegmented myeloid precursors were found in the PB. Ultimately, 100% of SETBP1G870S mice succumbed of multiorgan failure due to extreme leukocytosis. Moribund mice appeared lethargic and were euthanized. Kaplan-Meier analysis revealed a dramatic decrease in overall survival (OS) in SETBP1G870S mice (heterozygous: median survival, 108 days; homozygous: 51 days) compared with SETBP1LSL controls (Figure 1H). Whole-exome sequencing did not show evidence for acquisition of additional oncogenic mutations during progression (supplemental Table 1), indicating that SETBP1 overexpression alone is sufficient to induce a myeloproliferative phenotype.
Phenotype of the SETBP1G870S mouse. (A) Gross examination of SETBP1LSL (first panel) and SETBP1G870S (second and third panel) mice at autopsy, showing massive enlargement of the spleen and liver in SETBP1G870S mice (red arrows). The fourth panel shows the spleen of SETBP1LSL (left) and SETBP1G870S mouse (right); the red arrow points to a splenic infarction occurring in SETBP1G870S. (B-C) Spleen size (B) and weight (C) of SETBP1LSL (green) and SETBP1G870S (orange) mice, confirming massive spleen enlargement. Statistical analysis was performed using a 2-tailed t test. (D) Total WBC counts reported over the course of a 150-day follow-up for SETBP1G870S (orange) and SETBP1LSL (green) mice. (E) Hematoxylin and eosin (H&E) stained PB cytospins of a 60-day SETBP1G870S mouse showing accumulation of mostly mature neutrophils with less abundant monocytes. (F) Violin plot showing the fraction of myeloid cells over the total WBC count in SETBP1LSL (green) and SETBP1G870S (orange) mice at 120 days, as determined by pathologist’s counts on cytospin slides. Statistical analysis was performed using a 2-tailed t test. (G) (Left) fluorescence-activated cell sorter (FACS) analysis of representative SETBP1LSL (green) and SETBP1G870S (orange) PB mononuclear cell (PBMCs); CD11b vs Ly6G (upper) and CD3 vs GFP (lower) plots are shown, displaying massive expansion of CD11b+ myeloid cells and dramatic reduction of CD3+ lymphocytes. Blood samples were collected at 120 days; (right) aggregated FACS data (n = 6). (H) Kaplan-Meier OS analysis. P values were calculated with the use of a log-rank test, and mice were stratified according to their genotype (SETBP1G870S, heterozygous, orange; SETBP1G870S, homozygous, red; SETBP1LSL, green). Tick marks indicate censored data.
Phenotype of the SETBP1G870S mouse. (A) Gross examination of SETBP1LSL (first panel) and SETBP1G870S (second and third panel) mice at autopsy, showing massive enlargement of the spleen and liver in SETBP1G870S mice (red arrows). The fourth panel shows the spleen of SETBP1LSL (left) and SETBP1G870S mouse (right); the red arrow points to a splenic infarction occurring in SETBP1G870S. (B-C) Spleen size (B) and weight (C) of SETBP1LSL (green) and SETBP1G870S (orange) mice, confirming massive spleen enlargement. Statistical analysis was performed using a 2-tailed t test. (D) Total WBC counts reported over the course of a 150-day follow-up for SETBP1G870S (orange) and SETBP1LSL (green) mice. (E) Hematoxylin and eosin (H&E) stained PB cytospins of a 60-day SETBP1G870S mouse showing accumulation of mostly mature neutrophils with less abundant monocytes. (F) Violin plot showing the fraction of myeloid cells over the total WBC count in SETBP1LSL (green) and SETBP1G870S (orange) mice at 120 days, as determined by pathologist’s counts on cytospin slides. Statistical analysis was performed using a 2-tailed t test. (G) (Left) fluorescence-activated cell sorter (FACS) analysis of representative SETBP1LSL (green) and SETBP1G870S (orange) PB mononuclear cell (PBMCs); CD11b vs Ly6G (upper) and CD3 vs GFP (lower) plots are shown, displaying massive expansion of CD11b+ myeloid cells and dramatic reduction of CD3+ lymphocytes. Blood samples were collected at 120 days; (right) aggregated FACS data (n = 6). (H) Kaplan-Meier OS analysis. P values were calculated with the use of a log-rank test, and mice were stratified according to their genotype (SETBP1G870S, heterozygous, orange; SETBP1G870S, homozygous, red; SETBP1LSL, green). Tick marks indicate censored data.
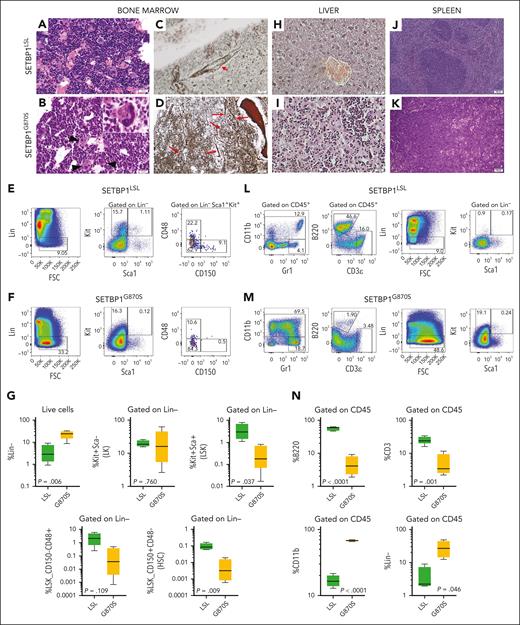
BM histology revealed overt myeloid hyperplasia with no evidence of dysplasia except for the megakaryocytic lineage (Figure 2A-B). Atypical megakaryocytes were commonly found in SETBP1G870S BM sections, with frequent hypolobulated bulbous nuclei, dark chromatin with irregular borders, and folding of the nuclear surface. Stromal changes in terms of reticulin fibrosis were seen on BM sections taken from adult SETBP1G870S mice: Gomori silver stain revealed an increased network of reticulin fibers with many intersections (average grade of fibrosis, MF-1; supplemental Figure 2G), with a predominant peritrabecular distribution but also extending within the intertrabecular spaces, as well as the presence of thick, confluent collagen fibers, whereas control mice showed a normal pattern (Figure 2C-D; supplemental Figure 2H). BM cells revealed a marked expansion of lineage-negative (Lin−) cells (Figure 2E-G); however, within the Lin− population, the fraction of multipotent Lin−/Sca1+/c-Kit+ (LSK) cells was much reduced, and very few hematopoietic stem cells (HSCs) (CD150+/CD48−) were found in SETBP1G870S BM; no significant change in the MPP3 fraction (CD150−/CD48+) was noted. This pattern is consistent with an amplification of committed myeloid progenitors. To better characterize myeloid progenitor populations, we analyzed Lin−/Kit+/Sca− (LK) cells using 2 pairs of surface markers, that is, CD34/CD15018 and CD34/FcγR.19 Both analyses showed significant expansion of common myeloid progenitors (CMPs; supplemental Figure 3) in SETBP1G870S BM.
Pathology of SETBP1G870S mouse. (A-B) H&E staining of age-matched (3 months) SETBP1LSL (A) and SETBP1G870S (B) BM (scale bars, 25 μm). In controls, BM sections showed a normal granulocytes segmentation with mature polylobulated megakaryocytes. In diseased mice, myeloid differentiation was abnormally shifted to the left and frequent atypical megakaryocytes were seen (black arrows). (C-D) BM sections stained with Gomori silver stain in a SETBP1LSL (C) and a SETBP1G870S (D) mouse at 150 days of age (scale bar, 25 μm). An increased network of reticulin fibers with many intersections can be noted in SETBP1G870S. The red arrows point to thick, confluent fibers. Control BM shows normal reticulin structure; the small arrow points to normal perivascular staining as an internal positive control. (E-F) FACS analysis of BM cells from representative SETBP1LSL (E) and SETBP1G870S (F) mice. CD45+ cells were stained with myeloid, lymphoid, and stem cell markers, as indicated. (G) Aggregated data from FACS analysis of BM samples (n = 5). (H-K) H&E-stained histological sections of the liver (H-I; scale bars, 25 μm) and spleen (J-K; scale bars, 100 μm) of SETBP1LSL (H,J) and SETBP1G870S (I,K) mice. In both organs, SETBP1G870S mice showed subversion of the normal parenchyma with accumulation of myeloid cells and evidence of extramedullary hematopoiesis. Clusters of myeloid elements were present in the liver, with periportal distribution. Red pulp colonization in the spleen showed clusters of abnormal megakaryocytes with hypercondensed chromatin; also, numerous bare megakaryocytic nuclei were present. (L-M) FACS analysis of spleen cells from SETBP1LSL (L) and SETBP1G870S (M) mice. CD45+ cells were stained with myeloid, lymphoid, and progenitor cell markers, as indicated. (N) Aggregated data from FACS analysis of splenocytes (n = 5).
Pathology of SETBP1G870S mouse. (A-B) H&E staining of age-matched (3 months) SETBP1LSL (A) and SETBP1G870S (B) BM (scale bars, 25 μm). In controls, BM sections showed a normal granulocytes segmentation with mature polylobulated megakaryocytes. In diseased mice, myeloid differentiation was abnormally shifted to the left and frequent atypical megakaryocytes were seen (black arrows). (C-D) BM sections stained with Gomori silver stain in a SETBP1LSL (C) and a SETBP1G870S (D) mouse at 150 days of age (scale bar, 25 μm). An increased network of reticulin fibers with many intersections can be noted in SETBP1G870S. The red arrows point to thick, confluent fibers. Control BM shows normal reticulin structure; the small arrow points to normal perivascular staining as an internal positive control. (E-F) FACS analysis of BM cells from representative SETBP1LSL (E) and SETBP1G870S (F) mice. CD45+ cells were stained with myeloid, lymphoid, and stem cell markers, as indicated. (G) Aggregated data from FACS analysis of BM samples (n = 5). (H-K) H&E-stained histological sections of the liver (H-I; scale bars, 25 μm) and spleen (J-K; scale bars, 100 μm) of SETBP1LSL (H,J) and SETBP1G870S (I,K) mice. In both organs, SETBP1G870S mice showed subversion of the normal parenchyma with accumulation of myeloid cells and evidence of extramedullary hematopoiesis. Clusters of myeloid elements were present in the liver, with periportal distribution. Red pulp colonization in the spleen showed clusters of abnormal megakaryocytes with hypercondensed chromatin; also, numerous bare megakaryocytic nuclei were present. (L-M) FACS analysis of spleen cells from SETBP1LSL (L) and SETBP1G870S (M) mice. CD45+ cells were stained with myeloid, lymphoid, and progenitor cell markers, as indicated. (N) Aggregated data from FACS analysis of splenocytes (n = 5).
The liver and spleen of SETBP1G870S mice showed marked distortion of the normal architecture (Figure 2H-K; supplemental Figure 4). Consistent with extramedullary hematopoiesis, clusters of variably segmented myeloid cells accumulated in the liver and in the red pulp of the spleen. Flow cytometry analysis of splenocytes revealed massive infiltration by mature myeloid cells and a concomitant sharp loss of lymphoid cells in SETBP1G870S mice compared with controls (Figure 2L-N), in keeping with PB data. At the same time, an aberrantly large Lin− population was found in the spleen, and a significant fraction of these cells was c-Kit+/Sca1−, suggesting a myeloid progenitor phenotype.20
These data indicate that mutated SETBP1 drives the development of a MPN disease characterized by myelofibrosis, megakaryocytic-restricted dysplasia, marked mature leukocytosis, and progressive splenomegaly.
Mutated SETBP1 alters the transcriptional program of differentiating BM cells
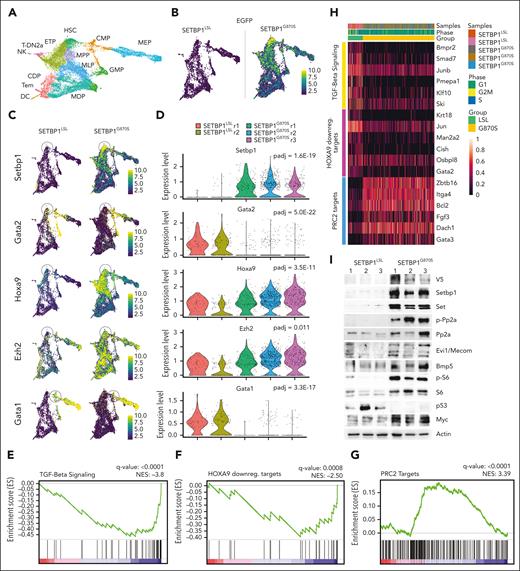
Single-cell RNA sequencing on BM Lin− cells from SETBP1G870S and SETBP1LSL mice (Figure 3A; supplemental Figure 5A) confirmed that SETBP1-EGFP expression was restricted to SETBP1G870S cells (Figure 3B). Analysis of differentially expressed genes (supplemental Table 2) identified Setbp1, Hoxa9, Gata1, Gata2, Ezh2, and Mecom among the top differential genes (Figure 3C-D; supplemental Figure 5B-C) in the most immature myeloid population. MECOM and HOXA9 are direct targets of SETBP1 transcriptional regulation.9,11 The evidence that both genes are upregulated in our SETBP1G870S model suggests that SETBP1 can modulate their expression in the context of the differentiating BM cells. Mecom was also shown to positively regulate endogenous Setbp1 expression,21 suggesting that the 2 genes are likely coregulated at transcriptional level, probably through a positive feedback loop. This is of particular relevance, because Mecom is known to promote expansion of the early myeloid progenitors by suppressing the TGF-β1/Smad axis22,23 and its overexpression has been linked to poor prognosis in myeloid malignancies.24 In line with these findings, gene set enrichment analysis revealed a deep suppression of the TGF-β1 axis in SETBP1G870S myeloid precursors, together with the activation of the Hoxa9 network (Figure 3E-F, H). Interestingly, this was accompanied by a strong, positive enrichment of the polycomb repressor complex 2 (PRC2) targets (Figure 3G-H), indicating that in SETBP1G870S precursors, the repressive activity of PRC2 was inhibited, which is a key event in myeloproliferative disorders, in contrast to acute myeloid leukemias in which PRC2 activity is typically increased.25
Single-cell transcriptome analysis of SETBP1LSL and SETBP1G870S Lin− BM cells. (A) Uniform manifold approximation and projection (UMAP) plot showing the integrated single-cell RNA (scRNA) analysis, color-coded by cell type. ETP, earliest thymic progenitors; T-DN2a, T-DN2a cells; CDP, common dendritic progenitors; MDP, monocyte-dendritic cell progenitors; Tem, T effector memory cells; DC, dendritic cells. (B) UMAP plot reporting the expression level of the artificial SETBP1-EGFP transcript in SETBP1LSL (left) and SETBP1G870S (right) 90-day-old littermates in a blue-to-yellow color scale. (C) UMAP plots reporting the expression level of Setbp1, Gata2, Hoxa9, Ezh2, and Gata1 in SETBP1LSL (left) and SETBP1G870S (right) mice in a blue-to-yellow color scale. (D) Violin plot showing the expression level of Setbp1, Gata2, Hoxa9, and Ezh2 in the HSC cluster and of Gata1 in the CMP cell cluster of SETBP1LSL (green) and SETBP1G870S (orange) mice. Differentially expressed genes were identified using a negative binomial generalized linear model; the false-positive discovery rate (FDR) was controlled using the Bonferroni procedure. (E-G) Enriched gene sets for TGF-beta signaling, Hoxa9 downregulated targets, and PRC2 targets identified in in SETBP1G870S vs SETBP1LSL HSC cells. FDR represents the Benjamini-Hochberg adjusted P value; normalized enrichment score (NES) is the normalized gene set enrichment analysis (GSEA) enrichment score. HOXA9 downreg. targets represents genes that are downregulated in HSCs expressing HOXA9.26 (H) Heat map of the top GSEA leading edge genes of the TGF-beta signaling, Hoxa9 downregulated targets, and PRC2 targets pathways in SETBP1LSL (left, green ribbon) and SETBP1G870S (right, orange ribbon) mice. (I) Western blot analysis of PB samples obtained from SETBP1LSL and SETBP1G870S mice; transgenic SETBP1 is detected both by anti-SETBP1 and anti-V5 antibodies. Actin is shown as a loading control.
Single-cell transcriptome analysis of SETBP1LSL and SETBP1G870S Lin− BM cells. (A) Uniform manifold approximation and projection (UMAP) plot showing the integrated single-cell RNA (scRNA) analysis, color-coded by cell type. ETP, earliest thymic progenitors; T-DN2a, T-DN2a cells; CDP, common dendritic progenitors; MDP, monocyte-dendritic cell progenitors; Tem, T effector memory cells; DC, dendritic cells. (B) UMAP plot reporting the expression level of the artificial SETBP1-EGFP transcript in SETBP1LSL (left) and SETBP1G870S (right) 90-day-old littermates in a blue-to-yellow color scale. (C) UMAP plots reporting the expression level of Setbp1, Gata2, Hoxa9, Ezh2, and Gata1 in SETBP1LSL (left) and SETBP1G870S (right) mice in a blue-to-yellow color scale. (D) Violin plot showing the expression level of Setbp1, Gata2, Hoxa9, and Ezh2 in the HSC cluster and of Gata1 in the CMP cell cluster of SETBP1LSL (green) and SETBP1G870S (orange) mice. Differentially expressed genes were identified using a negative binomial generalized linear model; the false-positive discovery rate (FDR) was controlled using the Bonferroni procedure. (E-G) Enriched gene sets for TGF-beta signaling, Hoxa9 downregulated targets, and PRC2 targets identified in in SETBP1G870S vs SETBP1LSL HSC cells. FDR represents the Benjamini-Hochberg adjusted P value; normalized enrichment score (NES) is the normalized gene set enrichment analysis (GSEA) enrichment score. HOXA9 downreg. targets represents genes that are downregulated in HSCs expressing HOXA9.26 (H) Heat map of the top GSEA leading edge genes of the TGF-beta signaling, Hoxa9 downregulated targets, and PRC2 targets pathways in SETBP1LSL (left, green ribbon) and SETBP1G870S (right, orange ribbon) mice. (I) Western blot analysis of PB samples obtained from SETBP1LSL and SETBP1G870S mice; transgenic SETBP1 is detected both by anti-SETBP1 and anti-V5 antibodies. Actin is shown as a loading control.
Western blot analyses (Figure 3I) confirmed the stabilization of the Setbp1/Set/PP2A axis 1,2 by showing accumulation of Set protein and increased PP2A phosphorylation. Overexpression of Mecom was also confirmed at protein level. In addition, we found increased expression of Bmp5 and Myc proteins 9,12 and marked phosphorylation of S6, normally associated with mitogenic stimulation.27 Interestingly, Myc was likely posttranslationally upregulated, as previously reported,28 because it was downregulated at transcriptional level. Finally, P53 protein was strongly downregulated in SETBP1G870S mice, suggesting the existence of a complex SETBP1-TP53 interaction, as also noted in our previous work.29
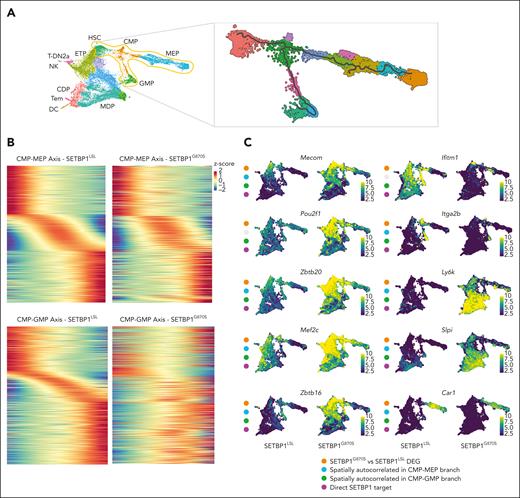
To investigate the mechanisms of SETBP1-driven alteration of hematopoiesis, we looked at all the spatially autocorrelated genes across the BM pseudotime for the CMP–megakaryocyte/erythroid progenitor (MEP) and the CMP–granulocyte/monocyte progenitor (GMP) differentiation paths (Figure 4A). We identified a total of 1686 and 1213 autocorrelated genes in the 2 branches, respectively (Benjamini-Hochberg–adjusted P < .1; Moran I test > 0.15; supplemental Tables 3-4), with 793 genes in common between the CMP-MEP and CMP-GMP branches. Of the 2106 autocorrelated genes generally identified in the 2 branches, 88.2% were also differential between SETBP1G870S and SETBP1LSL in the CMP/GMP/MEP clusters (χ2 test, P < .0001; supplemental Table 5). The fraction of spatially autocorrelated and differential genes was very high in the CMP-MEP (88.7%) as well as in the CMP-GMP (91.4%) branch, however the dysregulation of the CMP-GMP branch was more profound (Figure 4B-C).
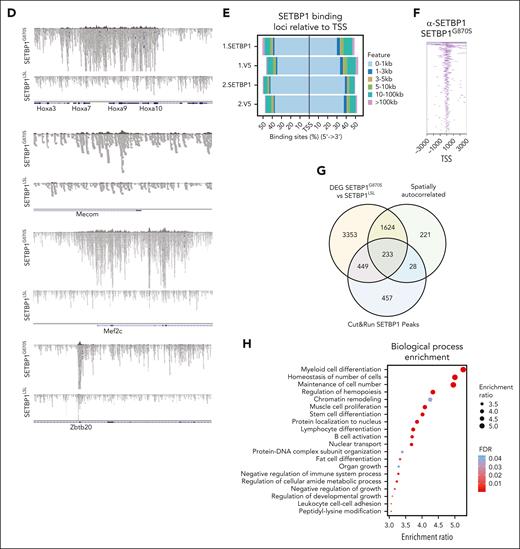
Single-cell analysis of SETBP1LSL and SETBP1G870S BM cells. (A) Left: UMAP projection of the full, integrated SETBP1G870S/SETBP1LSL single-cell analysis, annotated with cell type. The orange area highlights the HSC, CMP, GMP, and MEP cell populations. Right: UMAP projection of the HSC, CMP, GMP, and MEP cell populations. The gray line represents the pseudotime path. (B) Gene expression heat map of autocorrelated genes from root to fate in the CMP to MEP (upper panel) and CMP to GMP (lower panel) trajectories for SETBP1LSL (left) and SETBP1G870S (right) cells. (C) UMAP plots reporting the expression level of a subset of differentially expressed and autocorrelated genes in a blue-to-yellow color scale. Orange dots identify genes that are differentially expressed in SETBP1G870S vs SETBP1LSL; blue and green dots highlight genes that are spatially autocorrelated in the CMP-MEP and CMP-GMP trajectories, respectively; red dots identify genes that represent direct transcriptional SETBP1 targets. (D) Alignment plots of Hoxa9/10, Mecom, Mef2c, and Zbtb20 loci for anti-SETBP1 Cut&Run experiments performed in Lin− BM cells of SETBP1G870S and SETBP1LSL mice models. (E) Cumulative distribution of SETBP1 and V5 binding loci relative to transcription start site (TSS). (F) Heat map of anti-SETBP1 Cut&Run reads binding to TSS. (G) Venn diagram showing the intersection between differentially expressed genes (DEGs) identified in SETBP1G870S vs SETBP1LSL in CMP, GMP, and MEP clusters, spatially autocorrelated genes in CMP-MEP and CMP-GMP trajectories, and peaks identified in Cut&Run experiments using an anti-SETBP1 antibody. (H) Biological process overrepresentation analysis performed using the intersection of DEGs identified in SETBP1G870S vs SETBP1LSL in CMP, GMP, and MEP clusters, spatially autocorrelated genes in CMP-MEP and CMP-GMP trajectories, and peaks identified in Cut&Run experiments as input. The FDR is reported in a blue-to-red color scale.
Single-cell analysis of SETBP1LSL and SETBP1G870S BM cells. (A) Left: UMAP projection of the full, integrated SETBP1G870S/SETBP1LSL single-cell analysis, annotated with cell type. The orange area highlights the HSC, CMP, GMP, and MEP cell populations. Right: UMAP projection of the HSC, CMP, GMP, and MEP cell populations. The gray line represents the pseudotime path. (B) Gene expression heat map of autocorrelated genes from root to fate in the CMP to MEP (upper panel) and CMP to GMP (lower panel) trajectories for SETBP1LSL (left) and SETBP1G870S (right) cells. (C) UMAP plots reporting the expression level of a subset of differentially expressed and autocorrelated genes in a blue-to-yellow color scale. Orange dots identify genes that are differentially expressed in SETBP1G870S vs SETBP1LSL; blue and green dots highlight genes that are spatially autocorrelated in the CMP-MEP and CMP-GMP trajectories, respectively; red dots identify genes that represent direct transcriptional SETBP1 targets. (D) Alignment plots of Hoxa9/10, Mecom, Mef2c, and Zbtb20 loci for anti-SETBP1 Cut&Run experiments performed in Lin− BM cells of SETBP1G870S and SETBP1LSL mice models. (E) Cumulative distribution of SETBP1 and V5 binding loci relative to transcription start site (TSS). (F) Heat map of anti-SETBP1 Cut&Run reads binding to TSS. (G) Venn diagram showing the intersection between differentially expressed genes (DEGs) identified in SETBP1G870S vs SETBP1LSL in CMP, GMP, and MEP clusters, spatially autocorrelated genes in CMP-MEP and CMP-GMP trajectories, and peaks identified in Cut&Run experiments using an anti-SETBP1 antibody. (H) Biological process overrepresentation analysis performed using the intersection of DEGs identified in SETBP1G870S vs SETBP1LSL in CMP, GMP, and MEP clusters, spatially autocorrelated genes in CMP-MEP and CMP-GMP trajectories, and peaks identified in Cut&Run experiments as input. The FDR is reported in a blue-to-red color scale.
Because SETBP1 has also been implicated in the direct modulation of transcription as a DNA binding protein with both promoting and repressive transcriptional activity,9,11 we sought to investigate its interaction with genomic DNA in hematopoietic precursors. We performed Cut&Run experiments using Lin− hematopoietic precursors of both SETBP1G870S as well as SETBP1LSL mice (supplemental Tables 6-9). Genomic DNA occupancy by SETBP1 was analyzed by using anti-SETBP1, and validated using anti-V5 antibodies. We identified a total of 1167 peaks binding to promoter regions, defined as DNA regions comprised between ±3 kilobases from a transcriptional start site. Of them, 760 (65.1%) were also found using an anti-V5 antibody. Notably, both strategies confirmed a strong enrichment for promoters, with >80% of the peaks consistently mapping to transcriptional start site and characterized by a broad DNA binding profile (Figure 4D-F), in line with previous chromatin immunoprecipitation with sequencing experiments.9 Of the 1167 promoter peaks, 682 (58.4%) were associated with differentially expressed genes, and 233 (20.0%) were also spatially autocorrelated in the CMP/GMP/MEP differentiation branches (Figure 4G; supplemental Table 5).
Bioprocess overrepresentation analysis performed on the 233 differential, autocorrelated genes directly bound by SETBP1 at promoter level (Figure 4H; supplemental Table 10) revealed a strong enrichment of processes associated with myeloid cell differentiation (Padj = 1.18 × 10−09), cell number homeostasis (Padj = 5.4 × 10−07), regulation of hemopoiesis (Padj = 9.5 × 10−07), as well as chromatin remodeling (Padj = .03).
Among the genes modulated by the expression of mutated SETBP1, we found many critical regulators/effectors of normal hematopoiesis (Figure 4C). Specifically, a profound decrease in Gata2 expression in SETBP1G870S precursors was noted (as shown in Figure 3C-D). Gata2 upregulates the master erythroid differentiation factor Gata1 through a direct interaction with Gata1 promoter, thus triggering the Gata2-to-Gata1 erythroid switch. In line with these data, Gata1 expression was profoundly suppressed in the early myeloid precursors in SETBP1G870S (Figure 3C-D; Padj = 3.310−17; log2 fold change [log2-FC] in SETBP1G870S vs SETBP1LSL: −0.72). The expression of the growth factor independent 1B zinc finger gene (Gfi1B), which complexes with Gata1 to promote terminal erythroid differentiation, was also suppressed in the MEP branch (Padj = 2.89 × 10−38; log2-FC in SETBP1G870S vs SETBP1LSL: −1.0), which associated with the downmodulation of markers of erythroid and megakaryocytic lineages, such as the carbonic anhydrase 1 (Car1; Figure 4C; Padj = 3.3 × 10⁻²⁸; log2-FC in SETBP1G870S vs SETBP1LSL: −1.38) or Itga2b (Figure 4C; Padj = 2.94 × 10−88; log2-FC in SETBP1G870S vs SETBP1LSL: −1.87).
Alteration in the transcriptional program was not restricted only to genes associated with suppression of erythroid differentiation: among the spatially autocorrelated and differentially expressed genes we also identified the myocyte enhancer factor 2C (Mef2c) transcription factor (Figure 4C). Mef2c is known to be a key regulator of normal megakaryopoiesis, and absent or reduced MEF2C expression results in defects in megakaryocytic differentiation,30 whereas its upregulation has been linked to PMF and tissue fibrosis.31,32 In SETBP1G870S Lin− precursors, Mef2c was found to be potently upregulated in HSCs (Padj = 8.2 × 10−83; log2-FC: 1.22) as well as in MPP (Padj = 1.86 × 10−42; log2-FC: 1.01), CMP (Padj = 1.02 × 10⁻³¹; log2-FC: 1.02), GMP (Padj = 1.49 × 10−53; log2-FC: 1.87), and MEP clusters (Padj = 1.9 × 10−205; log2-FC: 2.77). Interestingly, Cut&Run experiments identified Mef2c as a primary Setbp1 target (Figure 4D; fold-enrichment over control: 16-fold; P = 1 × 10−39), suggesting that Mef2c is under a direct, positive transcriptional control of Setbp1.
In parallel with a profound alteration of the megakaryocytic/erythroid axis, a concomitant activation of a group of spatially autocorrelated genes associated with stem cell potency/renewal and BM repopulation ability was noted, in particular Zbtb16 (formerly Plzf), Zbtb20, Tcf7, Ly6k, Ramp1, and Slpi. Among them, Zbtb16, Zbtb20, and Tcf7 showed a very similar pattern, with a marked upregulation in the early progenitors (Figure 4C-D).
Together, these data suggest that expression of mutated SETBP1 in the BM profoundly alters the differentiation program of the hematopoietic progenitors, causing a complex series of events, of which Mecom and Hoxa9 activation are only a part, that are responsible for: (a) improving myeloid expansion and early progenitors repopulation ability; (b) fostering an antiapoptotic phenotype; and (c) promoting the granulocytic/monocytic differentiation while suppressing erythroid and lymphoid lineages (supplemental Figure 6).
Transplantation of SETBP1G870S cells results in anemia and myeloid leukemia
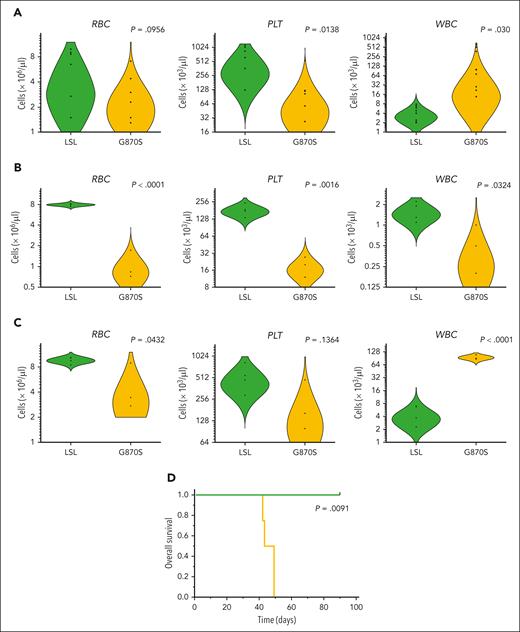
In agreement with single-cell data, the PB of SETBP1G870S mice showed a tendency toward reduced red blood cells and significantly lower platelet counts (Figure 5A), with concomitant expansion of WBCs (see also Figure 1D). Anemia and thrombocytopenia were dramatically exacerbated in lethally irradiated syngeneic recipients receiving BM cells from SETBP1G870S donors compared with mice receiving SETBP1LSL BM (Figure 5B; supplemental Figures 7-8). All but 1 mouse that received transplantation with SETBP1G870S cells died within 16 days after transplant because of extreme anemia. These data confirmed that SETBP1G870S BM has reduced erythropoietic capacity, in line with transcriptomics analyses. It is also interesting to note that, when expressed in all tissues, mutant SETBP1 causes embryonic lethality because of reduced primitive erythropoiesis.33 Next, since these recipients succumbed rapidly because of anemia, we turned to a sublethally irradiated model to allow enough time for graft expansion: donor chimerism gradually increased in recipients of SETBP1G870S BM (supplemental Figure 9A). After 6 weeks these mice showed mild anemia and massive leukocytosis (Figure 5C), with most cells belonging to the myeloid compartment (supplemental Figure 9B). All transplanted mice developed an accelerated form of chronic myeloproliferation, in some cases with the presence of immature elements, that also infiltrated visceral organs (supplemental Figure 9C-D). Mice receiving SETBP1G870S cells showed reduced OS (median survival, 49 days) compared with controls (Figure 5D) and with SETBP1G870S donor mice (P < .0001; see also Figure 1H). Similar results were obtained by transplantation of splenocytes (supplemental Figure 10). In line with observations in SETBP1G870S BM, very few donor-derived LSKs and HSCs were found in the BM of mice receiving SETBP1G870S cells (supplemental Figure 11). These data demonstrate the ability of SETBP1G870S BM cells to transfer and initiate a MPN similar to the that observed in the donors, but in an accelerated form, in recipient mice.
Whole BM transplantation in recipient mice. Red blood cells (RBCs), platelets (PLTs), and WBC counts in the PB of: (A) adult SETBP1LSL and SETBP1G870S mice; (B) lethally irradiated secondary recipients of SETBP1LSL and SETBP1G870S BM, 2 weeks after transplant; (C) sublethally irradiated recipients of SETBP1LSL and SETBP1G870S BM, 6 weeks after transplant. Blood cell counts were obtained using a blood analyzer; (D) OS of sublethally irradiated recipients of SETBP1G870S BM (orange) and SETBP1LSL BM (green).
Whole BM transplantation in recipient mice. Red blood cells (RBCs), platelets (PLTs), and WBC counts in the PB of: (A) adult SETBP1LSL and SETBP1G870S mice; (B) lethally irradiated secondary recipients of SETBP1LSL and SETBP1G870S BM, 2 weeks after transplant; (C) sublethally irradiated recipients of SETBP1LSL and SETBP1G870S BM, 6 weeks after transplant. Blood cell counts were obtained using a blood analyzer; (D) OS of sublethally irradiated recipients of SETBP1G870S BM (orange) and SETBP1LSL BM (green).
Paired whole-exome sequencing identifies distinct TN-PMF subgroups
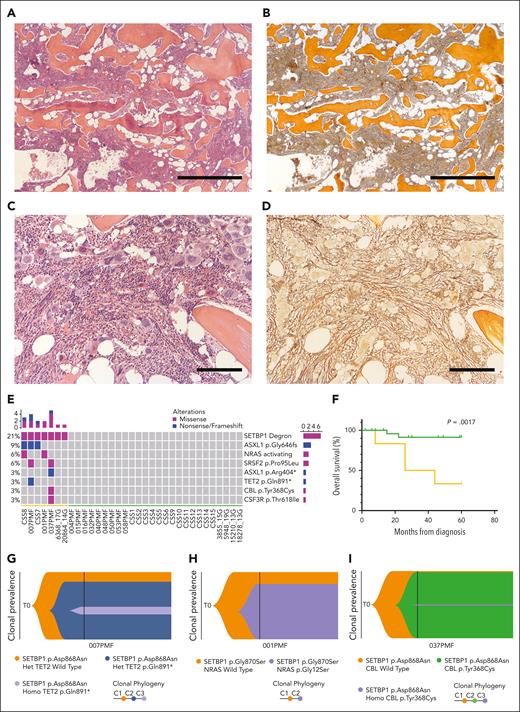
The SETBP1G870S mouse model recapitulated many clinical features of PMF. The molecular pathogenesis of PMF relates to mutually exclusive somatic mutations in 3 driver genes: JAK2, CALR, and MPL.34 However, up to 10% of them are triple negative for these mutations (TN-PMF). Hence, we set out to assess SETBP1 mutations in the context of TN-PMF. We selected 36 patients with a diagnosis of TN-PMF. Mutations of JAK2, CALR, or MPL were excluded by high-depth targeted next-generation sequencing panel (threshold: 1% variable allele frequency [VAF]). BM sections revealed the presence of clusters of megakaryocytes, often showing hyperplasia and atypical forms. In contrast to MDS/MPN with neutrophilia, no evidence of dysplasia could be detected in the neutrophilic lineage. Gomori stain revealed the presence of fibrosis of grade 1 to 3 (Figure 6A-D; supplemental Figure 12) with only 3 patients showing a grade 0. Increased granulocytic proliferation was found in the BM, and no evidence of dysplasia in the granulocytic or erythroid lineages was detected. Overt evidence of leukocytosis (WBC count of >25 × 109/L) at onset was present only in 4 cases (patients 058PMF, 007PMF, CSS7, and CSS11, with 26.3, 34.3, 48.5, and 74.8 × 10⁹/L leukocytes, respectively). Most of the patients presented high levels of lactate dehydrogenase. Overall, 14 of 36 patients fulfilled the criteria of overt PMF and 22 of prefibrotic (early) PMF, according to the WHO 2016 classification 16 (supplemental Table 11).
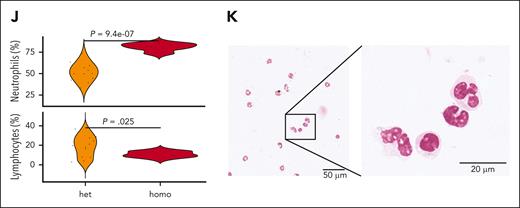
Molecular and clinical characteristics of patients with TN-PMF. (A-D) Representative BM seriated sections from 2 patients with TN-PMF, stained with H&E (A,C) and reticulin stain (B,D). Fibrosis with osteomyelosclerosis and megakaryocyte hyperplasia (with cluster formation and atypical forms) associated with fibrosis grade 3 are shown in panels A and B and in panels C and D, respectively. Bars: 500 μm in panels A and B, and 200 μm in panels C and D. (E) Oncoprint reporting the somatic mutations identified in the TN-PMF cohort. The orange and green bars highlight the patients with SETBP1-positive and -negative disease, respectively. (F) Kaplan-Meier survival analysis. Patients with TN-PMF were stratified according to the somatic mutational burden, with SETBP1-positive cases shown in orange and patients with SETBP1-negative disease shown in green. The log-rank test was used to test for differences in survival between the 2 groups. Tick marks indicate censored data. (G-I) Fish plots showing somatic evolution of the disease in 3 patients with TN-PMF. In 2 cases (G,I), a late acquisition of homozygous SETBP1 mutation is observed. (J) Neutrophil and lymphocyte populations in the PB from homozygous (homo) and heterozygous (het) SETBP1G870S mice. (K) H&E staining of the PB from a 30-day-old homozygous SETBP1G870S mouse showing accumulation of mature granulocytes.
Molecular and clinical characteristics of patients with TN-PMF. (A-D) Representative BM seriated sections from 2 patients with TN-PMF, stained with H&E (A,C) and reticulin stain (B,D). Fibrosis with osteomyelosclerosis and megakaryocyte hyperplasia (with cluster formation and atypical forms) associated with fibrosis grade 3 are shown in panels A and B and in panels C and D, respectively. Bars: 500 μm in panels A and B, and 200 μm in panels C and D. (E) Oncoprint reporting the somatic mutations identified in the TN-PMF cohort. The orange and green bars highlight the patients with SETBP1-positive and -negative disease, respectively. (F) Kaplan-Meier survival analysis. Patients with TN-PMF were stratified according to the somatic mutational burden, with SETBP1-positive cases shown in orange and patients with SETBP1-negative disease shown in green. The log-rank test was used to test for differences in survival between the 2 groups. Tick marks indicate censored data. (G-I) Fish plots showing somatic evolution of the disease in 3 patients with TN-PMF. In 2 cases (G,I), a late acquisition of homozygous SETBP1 mutation is observed. (J) Neutrophil and lymphocyte populations in the PB from homozygous (homo) and heterozygous (het) SETBP1G870S mice. (K) H&E staining of the PB from a 30-day-old homozygous SETBP1G870S mouse showing accumulation of mature granulocytes.
Of the 36 patients with TN-PMF, 30 were studied by exome sequencing and 6 by targeted sequencing: 29 of them did not reveal any significant evidence of recurrent or high VAF (>10%) somatic mutations; in all the remaining patients (7 of 36; 19.4%), mutations in SETBP1 oncogene were identified (Figure 6E; supplemental Table 12). SETBP1 mutations were all clustered in a narrow mutational hot spot comprised between amino acids Asp868 and Ser871. Interestingly, both mutation Gly870Ser (patients 001PMF, 6368/17G, 20864/14G and CSS7) and mutation Asp868Asn (patients 007PMF, 037PMF, and CSS8) have previously been identified in different myeloid disorders by our team and by others.1,35
In all aforementioned TN-PMF cases, SETBP1 mutations were detected at high VAF (>30%). In patients 001PMF and CSS8, SETBP1 mutation coexisted with activating NRAS mutations p.Gly12Ser and p.Gly13Asp, respectively; in patient 007PMF, SETBP1 was found together with somatic TET2 nonsense mutation p.Gln891∗, with SRSF2 p.Pro95Leu and with RIT1 p.Phe82Leu, and in patient 037PMF with SRSF2 p.Pro95Leu, ASXL1 p.Arg404∗, and CBL p.Tyr368Cys. Notably, mutations of SETBP1 were the only shared alteration among all 7 patients.
Therefore, our study suggests a clear partition of TN-PMF into 2 groups, the first one characterized by oncogenic, high VAF SETBP1 mutations accompanied by other oncogenic variants (hereafter referred to as SETBP1-positive group) and the other one characterized by no evidence of an active clonal process or of driver oncogenic events (SETBP1-negative group).
Clinical characteristics of SETBP1-positive and -negative TN-PMF
Median age at onset (72.2 vs 69 years; P = .26), hemoglobin levels (131 g/L vs 120 g/L; P = .78) and platelet counts (428 × 109/L vs 448 × 109/L; P = .55) were similar in SETBP1-positive and -negative groups (supplemental Table 11). Median WBC values at onset showed a trend toward higher counts in the SETBP1-positive group (16.4 × 10⁹/L vs 8.3 × 10⁹/L; P = .072). No difference was observed between the 2 groups at diagnosis in terms of BM fibrosis, International Prognostic Scoring System score, lactate dehydrogenase level, blast counts, or spleen size. By contrast, patients in the SETBP1-positive group showed a worse clinical course: after a median follow-up of 60 months, we reported 6 deaths, 4 of them in patients who were SETBP1 positive (4 of 7; 57.1%) and 2 in patients who were SETBP1 negative (2 of 29; 6.9%; supplemental Table 11). A markedly reduced OS was observed for patients who were SETBP1 positive, with a median survival time of 24 months (Figure 6F; Kaplan-Meier log-rank test, P = .0017). Principal causes of death were severe infection and disease progression.
Median WBC values at 3 years from diagnosis were 100.0 × 10⁹/L vs 7.14 × 10⁹/L in the SETBP1-positive and -negative groups, respectively (P < .0001). Progressive splenomegaly on ultrasound (16.0 cm vs 12.0 cm; P = .026), lower hemoglobin levels (72 g/L vs 132 g/L; P = .0049), and a trend toward a lower platelet count (73 × 109/L vs 471 × 109/L; P = .0598) became also evident in the SETBP1-positive group. We assessed the association of 8 meaningful clinical and genetic variables at onset (age, sex, BM fibrosis, hemoglobin, WBC count, platelets, thrombosis, and SETBP1 mutation) with OS, by a regularized Cox regression analysis, in 33 patients for whom these data were available. This multivariate analysis selected the presence of SETBP1 mutation as the variable most strongly associated with poor survival (supplemental Table 13).
SETBP1 mutation is an early event in TN-PMF
Because SETBP1 mutations found in TN-PMF are virtually identical to those found in MDS/MPN, they cannot explain the phenotypical differences of the 2 disorders. Because several works recently highlighted a critical role for clonal hierarchy in shaping the precise phenotype and clinical aggressiveness of tumors36,37 and because SETBP1 was found to be mostly a secondary event in MDS/MPN neoplasms,7,8 we hypothesized that the diverging phenotype could be explained by a different clonal architecture.
To dissect the clonal architecture of SETBP1-positive TN-PMF at single-cell resolution, we applied single-cell targeted DNA sequencing on 3 SETBP1-mutated TN-PMF samples using the Tapestri technology. In all cases, SETBP1 was found to be a very early event (Figure 6G-I). Interestingly, in 2 of 3 cases, we also isolated a late clone characterized by the presence of homozygous SETBP1 mutations. This could be relevant, because a recent work reported the identification of clones with homozygous SETBP1 variants in advanced, therapy resistant juvenile myelomonocytic leukemia.38 If confirmed in larger cohorts, these data suggest that heterozygous SETBP1 mutations occur very early in TN-PMF, whereas the presence of homozygous SETBP1 variants could be the hallmark of a more aggressive, late-stage disorder. To test this hypothesis, we characterized the homozygous hematopoietic SETBP1G870S model. Compared with their heterozygous littermates, homozygous mice developed myeloid disease with shorter latency and had dramatically decreased OS (Figure 1H). PB analysis revealed massive neutrophilia and lymphopenia already evident at 30 days of age (Figure 6J), confirming a more aggressive disorder in homozygous SETBP1G807S mice compared with the heterozygous mice. Consistently, PB smears showed the presence of an expanded population of mature neutrophils and almost complete absence of lymphocytes (Figure 6K). In ∼20% of homozygous SETBP1G807S mice, we noted, at autopsy, the presence of extramedullary masses of myeloid blasts, suggesting the progression to an acute leukemia (supplemental Figure 13).
Discussion
The involvement of SETBP1 in myeloid transformation is supported by several studies describing recurrent SETBP1 mutations in different clinical subtypes of myeloid malignancy.1,3,4,6,39 Previous studies have shown that Setbp1 overexpression confers self-renewal capability to myeloid progenitors in vitro and promotes acute leukemia in transplanted mice.13 These data suggest that Setbp1 has transforming ability but do not clarify the observation that in humans SETBP1 is often associated with chronic myeloproliferative disorders. Here, the central role of mutated SETBP1 in the phenotype of SETBP1-positive diseases is reinforced by the striking phenotype of the Vav-SETBP1 mouse model, which develops a chronic MPN and provides new insights into the leukemogenic role of Setbp1 in vivo, specifically pointing to a profound Setbp1-driven alteration of the hematopoietic differentiation programs. Because Gata2 expression is critical for the normal differentiation of the megakaryocyte lineage and its heterozygous loss-of-function causes a dysplastic megakaryocyte/platelet phenotype, its strong downregulation in SETBP1G870S may explain the presence of abnormal megakaryocytes in the BM of mice. Similarly, alteration of master genes involved in the myeloid and erythroid/megakaryocytic differentiation branches, such as Mef2C, Mecom, and Gata1, further supports this notion. In particular, Mef2C is strongly upregulated in SETBP1G870S; Cut&Run experiments carried out in Lin− BM precursors clearly showed that its promoter is occupied by SETBP1: this suggests a direct control exerted by the oncogene over Mef2c expression. Because Mef2C overexpression has been linked to PMF and tissue fibrosis, these findings may highlight, to our knowledge, for the first time, a direct connection between SETBP1-mutated disorders and myelofibrosis.
The Vav-SETBP1 mouse model precisely recapitulates WHO diagnostic criteria for PMF, including some aspects that are not commonly observed in MDS/MPN disorders, such as BM fibrosis, hepatosplenomegaly, and megakaryocytic dysplasia. Although our murine model closely mimics the phenotype of the human counterpart, it is important to note that it also has a limitation: because transgene expression is driven by a strong promoter, it is hard to discriminate between the effects of the mutation and those of SETBP1 overexpression.
Here, we identified 2 clearly distinct subgroups within patients with TN-PMF, according to the presence or absence of somatic mutations of SETBP1 and other known oncogenes. Importantly, a sharp difference in disease aggressiveness was noted between the 2 groups, with patients with SETBP1 mutation showing a much worse clinical course and severe prognosis, indicating that patients with SETBP1-mutated TN-PMF may represent a distinct subgroup of clinically aggressive PMF. Thus, SETBP1-positive diseases could possibly benefit from a more aggressive clinical approach including also early HSC transplantation. On the contrary, patients with SETBP1-negative disease could be spared from aggressive and toxic approaches, given its benign clinical course.
In the past, Leborde et al reported SETBP1 to be rarely mutated in PMF cases40; in their study, however, SETBP1 variants were analyzed in the context of the entire PMF cohort, with no selection of TN cases. These data indicate that SETBP1 mutations are exceedingly rare in driver-positive PMF, but they are highly recurrent in TN-PMF, with patients with SETBP1-mutated TN-PMF showing distinctive characteristics, such as BM fibrosis with megakaryocytic dysplasia, extramedullary hematopoiesis, and significant splenomegaly. Taken altogether, our data indicate that SETBP1-positive TN-PMF disorders lie in a gray zone between the MPN and MPN/MDS boundary, in which SETBP1 mutations are frequently found. However, in MDS/MPN, SETBP1 mutations are known to be late events in the history of the neoplasm. In contrast, we show, here, that in TN-PMF SETBP1 is one of the earliest hits, therefore highlighting a potentially relevant biological differences occurring in the 2 subsets. In this context, the presence of early, high VAF SETBP1 mutations seems to promote the occurrence of a myeloid disorder characterized by the triad: leukocytosis without differentiation block or dysplasia, BM fibrosis, and progressive splenomegaly, hence recapitulating many clinical features of PMF. Interestingly, in the context of single-cell clonal architecture reconstruction, we also identified the presence of late subclones carrying homozygous SETBP1 degron variants. This finding suggests that the presence of homozygous SETBP1 variants could be associated with a more aggressive phenotype and may represent the hallmark of the late stage of SETBP1-positive TN-PMF disorders.
In conclusion, we show that the SETBP1G870S mouse model, without the cooperation of other clonal mutations, recapitulates all the aggressive clinical features induced by SETBP1 in humans. Because the prognosis of the SETBP1-driven disorders, among them TN-PMF and MDS/MPN, is still dismal, a significant effort should be dedicated in the future to the development of new drugs for the treatment of the SETBP1 spectrum, which can now also rely on the availability of our in vivo model, which represents a novel platform for the exploration of new therapeutic approaches. Our data suggest that SETBP1 oncogenic mutations are certainly necessary, although perhaps not sufficient, to confer aggressiveness to the disease. A larger cohort of patients will need to be analyzed to confirm these findings.
Acknowledgments
The authors thank all patients who participated in the trial, and the medical as well as technical staffs of participating centers.
This work was supported by Italian Association for Cancer Research grants IG-22082 and IG-29341 (R.P.), IG-24828 (L.M.), IG-20112 (C.G.-P.); Italian Ministry of University and Research, Department of Excellence project PREMIA (Precision Medicine Approach: Bringing Biomarker Research to the Clinic) (R.P.); Italian MUR Dipartimenti di Eccellenza 2023-2027 (l. 232/2016, art. 1, commi 314 – 337) (R.P.); the European Union, NextGenerationEU through the Italian Ministry of University and Research under PNRR - M4C2-I1.3 project PE_00000019 “HEAL ITALIA” (R.P.); European Joint Programme for Rare Diseases ERARE 2020 (R.P., A. Sessa); Fondazione Cariplo grant 2018-0102 (E.A.); and Leukemia Research Foundation award 831382 (E.A.).
Authorship
Contribution: I. Crespiatico performed research, analyzed and interpreted data, wrote the manuscript; M.Z. performed research and contributed vital reagents; C.M., D.D., M.M., and C.M.M., performed research; D.F. performed research and revised the manuscript; S.S. performed research; V.C. performed research and revised the manuscript; E.I., B.M., and I. Civettini collected data; D.R. and V.S. analyzed and interpreted data; M.G. collected data; V.B., A.A., F.B., C.B., and R.O. performed research; L.R. contributed vital new reagents and collected data; M.R. and A.C. contributed vital new reagents; analyzed and interpreted data; M.B. contributed vital new reagents; collected data; A.M. contributed vital new reagents; analyzed and interpreted data; D.C. contributed vital new reagents; A.R., A. Sacco, and F.S. contributed vital new reagents and collected data; M.S., F.M., G.C., and F.P. analyzed and interpreted data; R.C. contributed vital new reagents, collected data, and analyzed and interpreted data; E.A. performed research and analyzed and interpreted data; A. Sessa contributed vital new reagents, analyzed and interpreted data, and critically revised the manuscript; C.G.-P. analyzed and interpreted data and critically revised the manuscript; E.M.E. contributed vital new reagents, designed research, analyzed and interpreted data, and critically revised the manuscript; L.M. contributed vital new reagents, designed research, analyzed and interpreted data, and wrote the manuscript; and R.P. contributed vital new reagents, designed research, analyzed and interpreted data, and wrote the manuscript.
Conflict-of-interest disclosure: The authors declare no competing financial interests.
Correspondence: Luca Mologni, Department of Medicine and Surgery, University of Milan-Bicocca, via Cadore 40, 20900 Monza, Italy; email: luca.mologni@unimib.it; Alessandro Sessa, Neuroepigenetics Unit, Division of Neuroscience, Stem Cells and Neurogenesis Unit, San Raffaele Scientific Institute, via Olgettina 58, 20132 Milan, Italy; email: sessa.alessandro@hsr.it; and Rocco Piazza, Department of Medicine and Surgery, University of Milan-Bicocca, via Cadore 48, Monza 20900, Italy; email: rocco.piazza@unimib.it.
References
Author notes
I.C. and M.Z. contributed equally to this study.
E.M.E., L.M., and R.P. contributed equally to this study.
The data sets supporting the conclusions of this article are available in the following SRA repositories: PRJNA795773, PRJNA793528, and PRJNA1039582 BioProjects for whole-exome, single-cell RNA sequencing, and Cut-and-Run raw sequencing data, respectively.
The online version of this article contains a data supplement.
There is a Blood Commentary on this article in this issue.
The publication costs of this article were defrayed in part by page charge payment. Therefore, and solely to indicate this fact, this article is hereby marked “advertisement” in accordance with 18 USC section 1734.

This feature is available to Subscribers Only
Sign In or Create an Account Close Modal