Abstract
Heparan sulfate (HS) proteoglycans of bone marrow (BM) stromal cells and their extracellular matrix are important components of the microenvironment of hematopoietic tissues and are involved in the interaction of hematopoietic stem and stromal cells. Although previous studies have emphasized the role of HS proteoglycan synthesis by BM stromal cells, we have recently shown that the human hematopoietic progenitor cell line TF-1 also expressed an HS proteoglycan. Immunochemical, reverse transcriptase-polymerase chain reaction (RT-PCR), and Northern blot analysis of this HS proteoglycan showed that it was not related to the syndecan family of HS proteoglycans or to glypican. To answer the question of whether the expression of HS proteoglycans is associated with the differentiation state of hematopoietic progenitor cells, we have analyzed the proteoglycan synthesis of several murine and human hematopoietic progenitor cell lines. Proteoglycans were isolated from metabolically labeled cells and purified by several chromatographic steps. Isolation and characterization of proteoglycans from the cell lines HEL and ELM-D, which like TF-1 cells have an immature erythroid phenotype, showed that these cells synthesize the same HS proteoglycan, previously detected in TF-1 cells, as a major proteoglycan. In contrast, cell lines of the myeloid lineage, like the myeloblastic/promyelocytic cell lines B1 and B2, do not express HS proteoglycans. Taken together, our data strongly suggest that expression of this HS proteoglycan in hematopoietic progenitor cell lines is associated with the erythroid lineage. To prove this association we have analyzed the proteoglycan expression in the nonleukemic multipotent stem cell line FDCP-Mix-A4 after induction of erythroid or granulocytic differentiation. Our data show that HS proteoglycan expression is induced during early erythroid differentiation of multipotent hematopoietic stem cells. In contrast, during granulocytic differentiation, no expression of HS proteoglycans was observed.
THE ESSENTIAL ROLE of the hematopoietic microenvironment, eg, the bone marrow (BM) stromal cells and their extracellular matrix (ECM), for the control of growth and differentiation in the hematopoietic system has been shown in long-term BM cultures, where stromal cells are necessary to support the proliferation and differentiation of hematopoietic stem and progenitor cells in vitro.1-3 In these cultures hematopoietic stem cell self-renewal, differentiation, and development into mature cells do not depend on added hematopoietic growth factors but requires direct physical contact between the stromal cells and the hematopoietic cells.1-5 However, the molecular mechanisms of the interaction of stromal cells and hematopoietic cells are not fully understood. Whereas stromal cells have been shown to produce a variety of growth factors, either constitutively or after activation, the requirement of a direct cell-cell contact between stromal cells and hematopoietic cells indicates that additional signals are needed. Recently it has been shown that proteoglycans might be involved in the interaction of primitive hematopoietic progenitor cells and stromal cells.6-12 Roberts et al7 have shown that interleukin-3 (IL-3) and granulocyte-macrophage colony-stimulating factor (GM-CSF) can be bound by heparan sulfate (HS) proteoglycans from BM stromal cells or their ECM and can be presented in a biologically active form to hematopoietic cells. These data indicate that binding of growth factors by HS proteoglycans might be an important mechanism for the interaction of hematopoietic stem and stromal cells. Binding of growth factors to heparin and HS proteoglycans has also been shown in other systems.13-18
Although these studies have shown that proteoglycans are involved in the interaction of hematopoietic stem and stromal cells, a detailed analysis of these proteoglycans is, because of the limited availability of primitive hematopoietic progenitor and stromal cell lines, still lacking. In fact, there are only a few reports on proteoglycans from hematopoietic cell lines.10,19-26 In the earlier studies either whole BM or long-term BM cultures have been used.4,26 However, this approach does not allow either the direct identification of the cells that synthesize the proteoglycans or a localization of the proteoglycans in the microenvironment. Most of the studies have pointed to stromal cells rather than hematopoietic stem cells or progenitor cells as the source of HS proteoglycans.10,19-22,24,26 However, recently we have analyzed the proteoglycans from the murine multipotent hematopoietic progenitor cell line FDCP-Mix A4 and the human erythroleukemia-derived cell line TF-1. Whereas in the murine cell line FDCP-Mix A4 only a chondroitin-4-sulfate proteoglycan was observed, in the human progenitor cell line TF-1 a novel HS proteoglycan was found as a major proteoglycan.25 However, an important question was whether these differences were due to the differentiation state of the hematopoietic progenitor cell lines. To address this question, in the present study we have analyzed the proteoglycan synthesis of several murine and human hematopoietic progenitor cell lines and in the nonleukemic multipotent stem cell line FDCP-Mix-A4 after induction of erythroid differentiation. Here we present evidence that HS proteoglycan expression is induced during early erythroid differentiation.
MATERIALS AND METHODS
Materials.
Carrier-free H2[35S]O4 and the [14C]-labeled amino acid mixture were obtained from New England Nuclear (NEN; Dreieich, Germany). The Pro-Mix cell labeling mixture ([35S]-methionine and [35S]-cysteine) was obtained from Amersham (Braunschweig, Germany). TSK G 3000 SW, TSK G 4000 SW columns equipped with guard columns, and Sepharose Q columns were obtained from Pharmacia/LKB (Freiburg, Germany). [14C]-labeled molecular-weight standards for sodium dodecyl sulfate-polyacrylamide gel electrophoresis (SDS-PAGE) were obtained from Amersham Buchler. 3-[3-(cholamidopropyl)dimethylamino]-1-propanesulfonate (CHAPS), benzamidine hydrochloride, 6-amino-hexanoic acid, phenylmethylsulfonyl fluoride (PMSF), and N-ethyl-maleinimide were purchased from Sigma (Deisenhofen, Germany). Guanidinium chloride was obtained from Pierce (Cologne, Germany).
Chondroitin sulfate lyase AC [EC 4.2.2.5], chondroitin sulfate lyase ABC [EC 4.2.2.4], heparinase (heparin lyase [EC 4.2.2.7]), and heparitinase (HS lyase [EC 4.2.2.8]) were purchased from Seikagaku (Tokyo, Japan).
Iscove’s modified Dulbecco’s medium (IMDM), RPMI 1640, and α-modified Eagle medium (α-MEM) were obtained from GIBCO (Eggenstein, Germany). Preselected batches of horse serum and fetal calf serum were obtained from Sigma (Deisenhofen, Germany), PAN-Systems GmbH (Eidenbach, Germany), and Harlan-Seralab (UK).
Recombinant murine (rm) IL-3, GM-CSF, erythropoietin (Epo), G-CSF, and human GM-CSF were from Boehringer (Mannheim, Germany). X63/Ag8-653-mIL-3–conditioned medium was used as a source of IL-3 during maintenance of FDCP-Mix-A4 cells.27
Reverse transcriptase (RT) (Superscript II) was obtained from GIBCO-BRL (Eggenstein, Germany), and Taq-polymerase (Ampli-Taq) from Perkin-Elmer Cetus (Überlingen, Germany). Oligo-dT was purchased from Boehringer (Mannheim, Germany). The Qiex gel extraction kit was obtained from Qiagen (Hilden, Germany). The pCRTMII plasmid cloning kit was purchased from Invitrogen (Leek, The Netherlands). XL1-Blue cells were obtained from Stratagene GmbH (Heidelberg, Germany). FMC-Seakem LE agarose was obtained from Biozym (Hameln, Germany), and positively charged nylon membranes were from Boehringer. Oligonucleotide primers were synthesized by MWG Biotech (Ebersberg, Germany).
All remaining reagents were of analytical grade (Merck, Darmstadt, Germany).
Culture and radiolabeling of cell lines.
The human hematopoietic progenitor cell line TF-1 was established from a patient with erythroleukemia.28 These cells are strictly dependent on IL-3 or GM-CSF for their survival and proliferation. Alternatively, TF-1 cells can be maintained in close contact with stromal cells in the absence of added growth factors (M. Bögel, U. Bergholz, U. Just, and W. Ostertag, unpublished results). TF-1 cells show many characteristics of immature erythroid cells, such as immature erythroblast morphology, positive periodic acid-Schiff (PAS) staining, and constitutive expression of globin genes. They can be induced to differentiate into more mature erythroid cells, but also to some extent into macrophage-like cells, and therefore might be regarded as an immature erythroid cell line with bipotent differentiation potential. HEL cells, originally established from a patient with erythroleukemia,29 were obtained from the American Type Culture Collection (Rockville, MD). HEL cells are similar to the TF-1 cell line, are of immature erythroid origin, and have a similar differentiation potential.29 The murine committed erythroid progenitor cell line ELM-D has been established from a murine erythroblastic leukemia and grows strictly dependent on stromal cells.30 The murine myeloblastic/promyelocytic B1 and B2 cell lines have been established from a murine myeloid leukemia.31 The multipotent hematopoietic cell line FDCP-Mix A4 was isolated from murine long-term BM cultures.1 These cells are nonleukemic and retain a normal karyotype. In the presence of horse serum and IL-3, FDCP-Mix A4 cells show self-renewal. When cultured in fetal calf serum in the presence of appropriate hematopoietic cytokines or when cocultured with stromal cells without added growth factors, FDCP-Mix A4 cells can undergo multilineage differentiation.1 The fibroblast cell line, used as a control, was isolated from a human cervix sample.32
TF-1 cells were routinely grown in RPMI 1640 supplemented with 10% fetal calf serum (FCS) and recombinant human GM-CSF (5 × 10² U/mL). HEL cells were routinely kept in RPMI-1640 supplemented with 10% FCS. ELM-D cells were kept in α-MEM supplemented with 20% HS. B1 and B2 cell lines were kept in IMDM with 20% HS. FDCP-Mix A4 cells were routinely grown in IMDM supplemented with 20% horse serum and X63Ag8-653-mIL-3–conditioned medium as a source of IL-3 at a concentration that stimulated optimal cell growth.
Cells were metabolically radiolabeled by 25 μCi/mL [35S]-sulfate in sulfate-reduced medium at a cell density of 3 × 10⁵/mL for 24 hours (TF-1: sulfate-free RPMI 1640 with 10% FCS and 5 × 10² U/mL recombinant human [rh] GM-CSF; HEL: sulfate-free IMDM with 10% FCS; ELM-D in sulfate-free IMDM and 20% HS; B1 and B2 cell lines in sulfate-free IMDM with 10% HS).
For metabolic labeling of HS proteoglycan core proteins expressed by the HEL cell line, cells were incubated with 25 μCi/mL of a [14C]-labeled amino acid mixture (NEN) and 50 μCi/mL of [35S]-methionine/[35S]-cysteine (Amersham) for up to 24 hours at a cell density of 5 × 10⁵/mL.
Induction of erythroid differentiation of FDCP-Mix A4 cells.
To induce erythroid differentiation, the FDCP-Mix A4 cells were washed in IMDM and were seeded in IMDM with 20% FCS and 5 U/mL epo and 2 U/mL rmIL-3.33 At different time points after induction, cells were metabolically radiolabeled by 25 μCi/mL [35S]-sulfate at a cell density of 2.5 × 10⁵/mL for 24 hours. In parallel, cultures were set up for mRNA preparation. In a control experiment, granulocytic differentiation was induced in FDCP-Mix A4 cells by culturing the cells in IMDM supplemented with 20% FCS, 1,000 U/mL G-CSF, 50 U/mL GM-CSF, and 2 U/mL IL-3 for up to 5 days.34 At different time points after induction, cells were metabolically labeled with 25 μCi/mL [35S]-sulfate for 24 hours. To monitor differentiation, cytospin preparations were made daily and stained with May-Grünwald-Giemsa.
Proteoglycans from the supernatant and/or the cell extract of FDCP-Mix-A4 cells obtained at different time points after induction of erythroid or granulocytic differentiation were analyzed as described below.
Isolation of proteoglycans.
Proteoglycans were isolated as described elsewhere.25 35Briefly, proteoglycans were extracted from metabolically labeled cells (cell layer, “Ex”) by 4 mol/L guanidinium chloride (pH 5.8) containing 50 mmol/L sodium acetate, 50 mmol/L EDTA, 0.1 mol/L 6-aminohexanoic acid, 50 mmol/L benzamidine hydrochloride, 5 mmol/L PMSF, 10 mmol/L N-ethylmaleimide (NEM), and 0.5 % (wt/vol) CHAPS. Proteoglycans were also isolated from the culture medium (supernatant, “SN”). Extracts and supernatants were cleared by centrifugation at 2,000g for 20 minutes.
The total incorporation of [35S] sulfate in proteoglycans was calculated from size exclusion chromatography on TSK 3000 column for supernatants and extracts. Elution was performed by 20 mmol/L sodium phosphate containing 4 mol/L guanidinium chloride and 0.05 % (wt/vol) CHAPS (pH 6.0). The elution profile was monitored by liquid scintillation counting.
Purification of proteoglycans was performed by anion-exchange chromatography and size exclusion chromatography. Briefly, to remove the guanidinium chloride from the cell extracts, extracts were precipitated with 9 vol of 95% ethanol (EtOH). Precipitate was reconstituted in 7 mol/L urea buffer containing 0.1 mol/L LiCl/0.1 mol/L NaCl, 0.05% CHAPS, and protease inhibitors as described above. Ion-exchange chromatography was performed on a Sepharose Q column (Pharmacia). The column was equilibrated with 20 mmol/L sodium phosphate containing 0.1 mol/L LiCl/0.1 mol/L NaCl 0.05% CHAPS (pH 4.5). Proteoglycans were eluted by a one-step procedure using 4 mol/L guanidinium chloride in 20 mmol/L sodium phosphate containing 0.1 mol/L LiCl/0.1 mol/L NaCl, 0.05% CHAPS (pH 4.5) or, alternatively, using a salt gradient as described.25 32 The elution was monitored by liquid scintillation counting.
Size exclusion chromatography was performed on a TSK 4000 column using 20 mmol/L sodium phosphate containing 4 mol/L guanidinium chloride and 0.05% CHAPS (pH 6.0) as eluent. The elution profile was monitored by liquid scintillation counting.
For further purification of HS proteoglycans, samples from the supernatants or cell extracts were diluted with digestion buffer36 and digested with chondroitinase AC/ABC (2 hours, 37°C). Digested samples were diluted to ≈0.15 mol/L NaCl by 50 mmol/L Tris buffer (pH 7.4) and applied to a DEAE-sephacel-column (2 mL), equilibrated with 50 mmol/L Tris-HCl, 2 mol/L urea, 0.1% Triton X-100 (Sigma), 0.15 mol/L NaCl, and 1 mmol/L PMSF (pH 7.4). Elution was performed with 6 mL 1 mol/L NaCl in 50 mmol/L Tris-HCl, 2 mol/l urea, 0.1% Triton X-100, and 1 mmol/L PMSF (pH 7.4). HS proteoglycans were precipitated by 90% ethanol in the presence of 50 μg bovine serum albumin (BSA) at −20°C.37
For analysis of HS proteoglycan induction during erythroid and granulocytic differentiation, samples from the supernatants or cell extracts were treated as described above. After removal of guanidinium chloride, proteoglycans were precipitated by 90% ethanol, digested with chondroitinase AC/ABC (2 hours, 37°C), purified by Sepharose Q chromatography, and analyzed on a TSK 4000 column before and after treatment with heparinase/heparitinase.
Biochemical characterization of proteoglycans.
Biochemical characterization of isolated proteoglycans was performed by electrophoresis before and after digestion with glycan-specific enzymes using fluorography. Enzymic digestion with heparinase (heparin lyase [EC 4.2.2.7]) and heparitinase (HS lyase [EC 4.2.2.8]), chondroitin sulfate lyase AC (EC 4.2.2.5), and chondroitin sulfate lyase ABC (EC 4.2.2.4) was performed in the presence of proteinase inhibitors as described.36,38 Electrophoresis was performed according to Laemmli39 using gradient gels (4% to 15% or 8% to 25% T, 3% C). After electrophoresis, gels were treated with En[3H]ance (NEN) according to the manufacturer’s instructions. Kodak XAR-5 film (Eastman Kodak, Rochester, NY) was used for fluorographic detection. Exposure times ranged from 5 to 14 days. In addition, molecular-weight distributions of native and HNO2-treated proteoglycans were estimated by size exclusion chromatography on a TSK 4000 column.
β-Elimination and HNO2-degradation.
The size of the glycosaminoglycan chains was determined after alkaline β-elimination40 by gel permeation chromatography on a TSK 4000 column. HNO2-degradation of HS was performed according to the method described by Shively and Conrad.41 Briefly, proteoglycans were treated with 0.6 mol/L nitrous acid (pH 1.5) for 10 minute at room temperature. Thereafter, samples were neutralized by the addition of 1 mol/L sodium carbonate (pH 8.0).
Immunochemical analysis of proteoglycans.
Immunochemical analysis of proteoglycans was performed either by dot-blot analysis and/or Western blot analysis. The following monoclonal antibodies (MoAbs) against cell-surface HS proteoglycans were used: S1 (anti-glypican), 2E9 (anti-syndecan 1 + 3), 1C7 (anti-syndecan 3), and 8G3 (anti-syndecan 4). In addition, the MoAb 3 G 10 against an epitope generated in heparitinase-digested HS proteoglycans was used (MoAbs were kindly provided by G. David, University of Leuven, Leuven, Belgium).
For dot-blot analysis, samples were immobilized on Biodyne B membrane (Pall, Dreieich, Germany). Blocking was performed by 5% BSA/1% dry milk in 0.02 mol/L Tris/0.3 mol/L NaCl/pH 7.5 for 1 hour at room temperature. Incubation with specific MoAbs (1 to 10 μg/mL) was performed overnight at 4°C. Detection of bound antibodies was performed according to standard procedures using either peroxidase-conjugated second antibodies and diaminobenzidine or a chemiluminescence detection system (ECL; Amersham, Braunschweig, Germany). Western blot analysis was performed according to standard procedures. Detection was done by chemiluminescence (ECL).
RNA isolation and cDNA synthesis.
Total RNA was isolated according to the method of Chomczynski and Sacchi.42 Two microliters (1 μg/μL) of total RNA was used to synthesize cDNA by RT (Superscript II; GIBCO-BRL) starting with oligo-dT (Boehringer). cDNA was synthesized in 20 mmol/L Tris-HCl pH 8.4, 50 mmol/L KCl, 2.5 mmol/L MgCl2, 10 mmol/L dithiothreitol (DTT), 500 μmol/L each dNTP, 500 nmol/L oligo-dT, and 200 U of RT (Superscript II) at 42°C for 50 minutes. The reaction was terminated by incubation at 70°C for 15 minutes and degradation of RNA by RNAse H at 37°C for 20 minutes. If necessary, poly-A+ RNA was isolated by the use of Dynabeads Oligo (dT)25 (Dynal, Hamburg, Germany).
Northern blot.
Approximately 1 μg of poly-A+ RNA was run on a 1.0% denaturing formaldehyde gel and transferred onto positively charged nylon membranes (Boehringer). RNA blots were hybridized against DIG-labeled (Boehringer) polymerase chain reaction (PCR)-synthesized probes in DIG-Easy Hyb at 50°C for 14 hours. Washing was done two times in 2X SSC (SSC = 3 mol/L sodium chloride, 0.3 mol/L sodium citrate, pH 7.2), 0.1% sodium dodecyl sulfate (SDS) at room temperature for 5 minutes and twice in 0.1X SSC, 0.1% SDS at 50°C for 15 minutes. Chemiluminescence detection of RNA was performed according to the manufacturer’s instruction (Boehringer).
RT-PCR.
PCR conditions for amplification of the different members of the syndecan family, betaglycan and glypican, were optimized using the Optiprime kit (Stratagene, Heidelberg, Germany). Two microliters of synthesized cDNA was used for PCR reactions. The reactions were performed in 67 mmol/L TrisHCl pH 8.8, 6.7 mmol/L MgCl2, 170 μg/mL BSA, 16.6 mmol/L (NH4)2SO4, 100 μmol/L each dNTP, 2.5 U of Taq-polymerase (Ampli-Taq; Perkin-Elmer Cetus), and 50 pmol of the respective 5′-primers and 3′-primers for Syndecan 2 and 4. Oligonucleotides for Syndecan 2 were (5′-ATGAGACGCGCGGCGCTCTGGC-3′) as 5′-primer and (5′-GGCGTA-GAACTCCTCCTGCTTGGT-3′) as 3′-primer and for syndecan 4 were (5′-CGAGAGACTGAGGTCATCGAC-3′) as 5′-primer and (5′-CGCGTAGAACTCATTGGTGG-3′) as 3′-primer. Primers for betaglycan were (5′-GAGCTGTATAACACAGACCTC-3′) as 5′-primer and (5′-CGTCGTCAGGAGTCACACAC-3′) as 3′-primer. Amplification of betaglycan was performed in 10 mmol/L Tris HCl pH 9.2, 3.5 mmol/L MgCl2, 75 mmol/L KCl. The primer pair for glypican was (5′-CGCCAGATCTACGGAGCCAAG-3′) as 5′-primer and (5′-GAACTTGTCGGTGATGAGCAC-3′) as 3′-primer. Amplification of glypican was performed in 10 mmol/L Tris HCl pH 8.3, 3.5 mmol/L MgCl2, 75 mmol/L KCl, and 4% dimethyl sulfoxide (DMSO) (Optiprime; Stratagene, Heidelberg, Germany). Primers for syndecan-3 were (5′-CACGGCTGACATAAGGACC-3′) as 5′-primer and (5′-CTC-TAGTATGCTCTTCTGAG-3′) as 3′-primer. Amplification of syndecan-3 was performed in 10 mmol/L Tris HCl pH 8.3, 1.5 mmol/L MgCl2, 25 mmol/L KCl.
For analysis of the β-globin expression, a probe was generated using the following primers: 5′-primer: 5′-ATGGTGCACCTGACTGATGC-3′, 5′ nested primer: 5′-TGAGAAGGCTGCTGTCTCTT-3′ and 3′-primer: 5′-CAGTGCAGCTCACTGAGATG-3′. The PCR product of 261 bp was cloned into pGEM-T easy (Promega, Heidelberg, Germany).
Oligonucleotide primers were synthesized by MWG Biotech (Ebersberg, Germany). PCR was performed in a thermal cycler (Trioblock; Biometra, Göttingen, Germany). Denaturation was at 94°C for 30 seconds, annealing at 55°C for 30 seconds, and extension at 72°C for 60 seconds. The number of cycles was 30. PCR amplification products were analyzed on a 1.2% agarose gel (Seakem LE; FMC, Biozym), visualized by ethidium bromide staining.
Cloning of PCR products.
PCR-amplified DNA fragments were extracted from agarose gels (Quiex; Quiagen, Hilden, Germany), ligated in pCRTM II (Invitrogen) or, for β-globin, in pGEM-T easy (Promega) for 16 hours at 14°C and transformed in competent XL1-Blue cells (Stratagene). Positive clones were checked for the right insert by sequence analysis.43
RESULTS
Characterization of proteoglycans from the hematopoietic progenitor cell lines.
Proteoglycans were isolated from metabolically labeled murine and human hematopoietic cell lines and purified by several chromatographic steps. The content of metabolically labeled proteoglycans ([35S] incorporation) of supernatants (SN) and extracts (Ex) was calculated from size exclusion chromatography on the TSK 3000 column. Whereas for the human factor-independent erythroleukemia cell line HEL about 50% of the proteoglycans were found both in the supernatant and cell extract, for the human factor-dependent erythroleukemia cell line TF-1 and the murine stromal cell–dependent erythroid progenitor cell line ELM-D the majority of proteoglycans was found in the supernatant (80% and 62%, respectively).
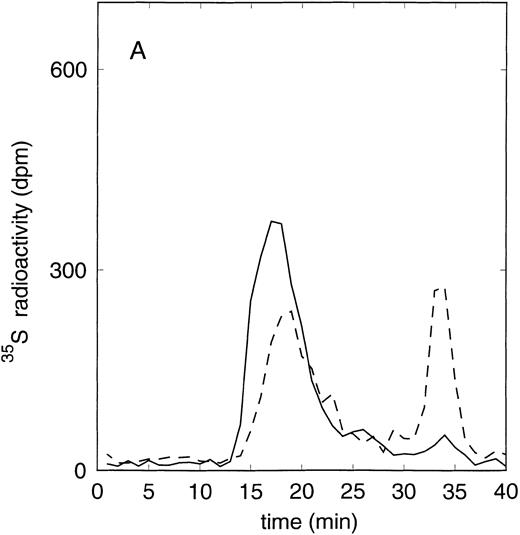
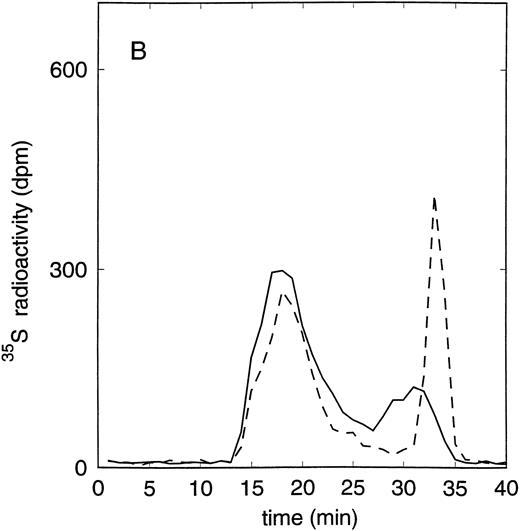
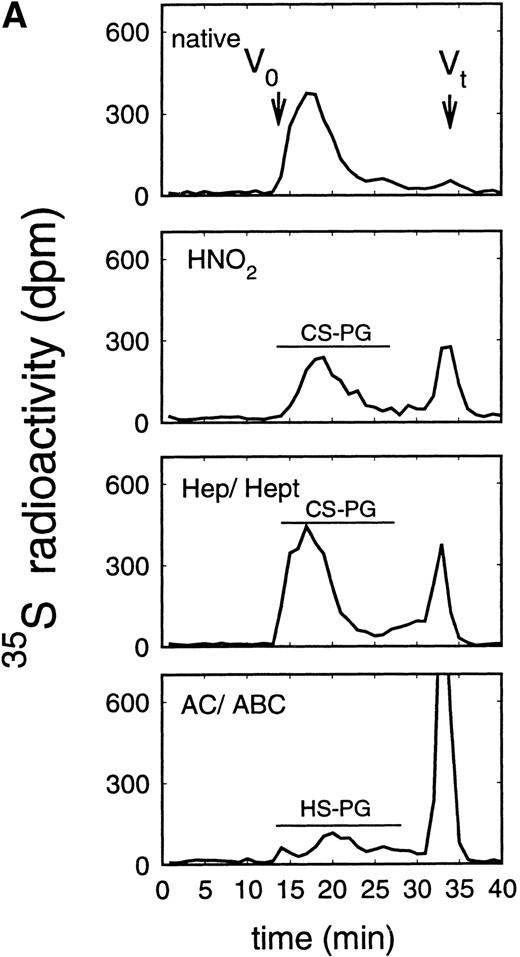
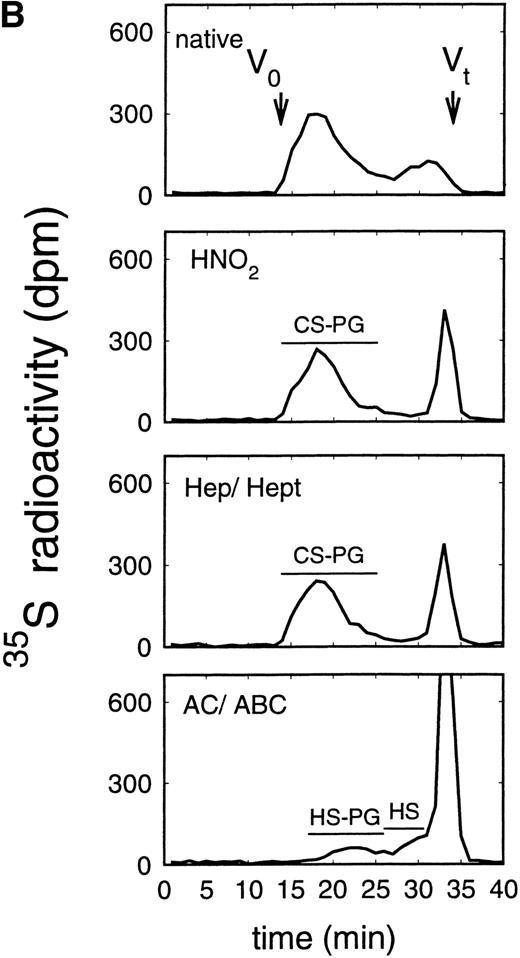
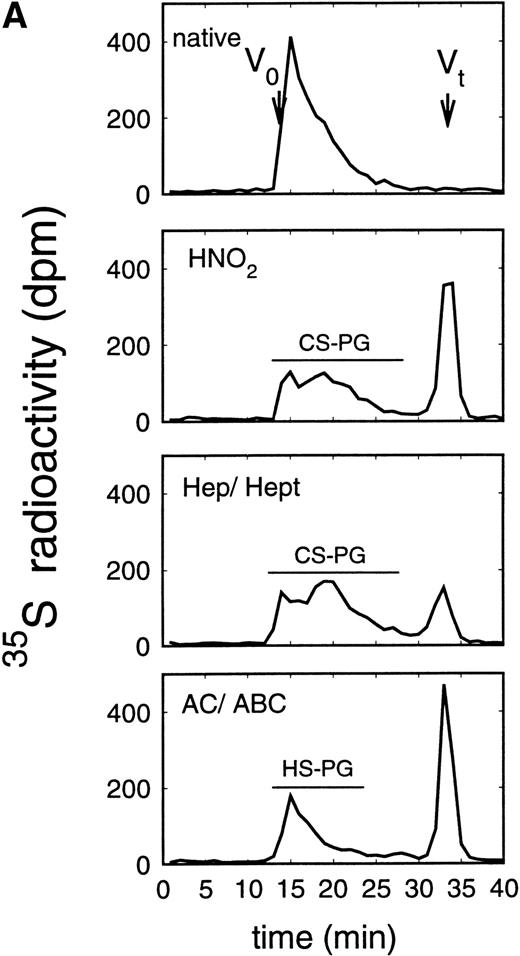
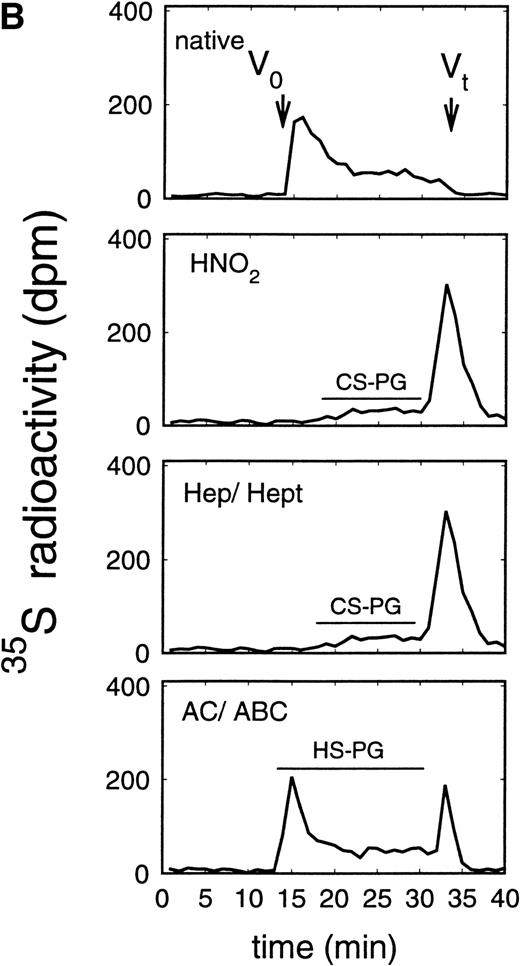
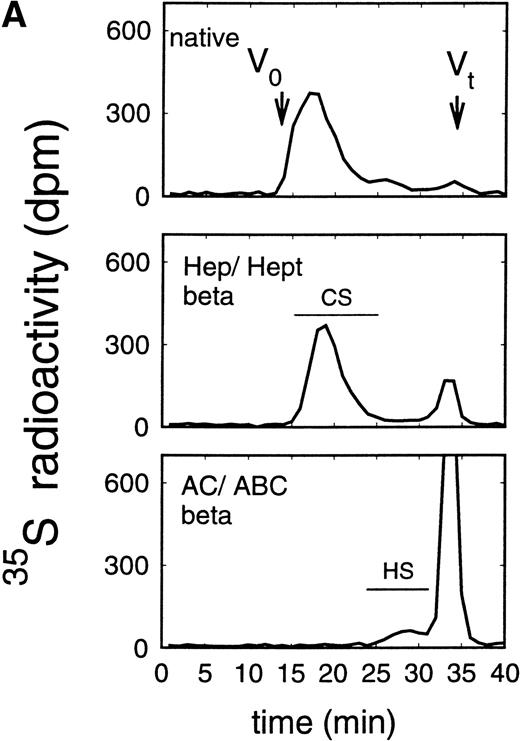
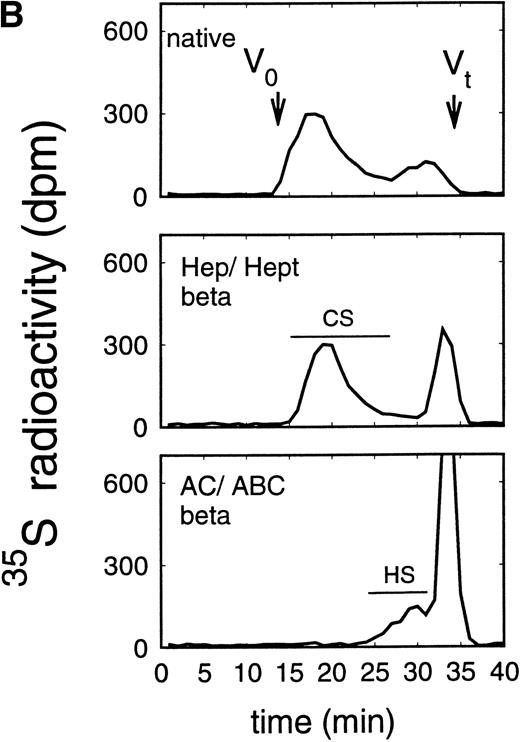
Purification of proteoglycans was performed by an initial anion exchange chromatography of supernatants and cell extracts on a Sepharose Q column. The molecular-weight distribution of proteoglycans, purified by anion exchange chromatography, was analyzed by size exclusion chromatography on a TSK 4000 column and SDS-PAGE. The relative proportion of HS proteoglycans was calculated by size-exclusion chromatography of native, HNO2-treated samples and/or heparinase/heparitinase-treated samples (Figs 1, 2, and3). By this procedure about 30% of proteoglycans (34% in the cell extract and 27% in the supernatant) from the HEL cell line could be identified as HS proteoglycans (Figs 1 and 2), compared with about 39% in the TF-1 cell line.25 In the ELM-D cell line the relative content of HS proteoglycan was even higher (about 80% in the cell extract and about 50% in the supernatant) (Fig 3).
Size exclusion chromatography of proteoglycans from the supernatant (A) and cell extract (B) of the immature erythroid progenitor cell line HEL. Proteoglycans isolated by anion exchange chromatography were submitted to size exclusion chromatography on a TSK 4000 column. Elution profiles for the proteoglycans from the supernatant (A) and cell extract (B) are shown for the native (——) and HNO2-treated (- - -) samples. Elution profiles were monitored by liquid scintillation counting.
Size exclusion chromatography of proteoglycans from the supernatant (A) and cell extract (B) of the immature erythroid progenitor cell line HEL. Proteoglycans isolated by anion exchange chromatography were submitted to size exclusion chromatography on a TSK 4000 column. Elution profiles for the proteoglycans from the supernatant (A) and cell extract (B) are shown for the native (——) and HNO2-treated (- - -) samples. Elution profiles were monitored by liquid scintillation counting.
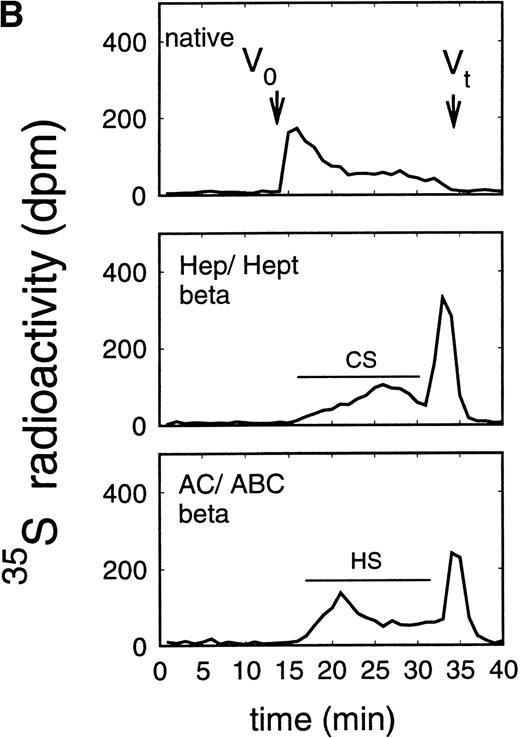
Size exclusion chromatography of proteoglycans after digestion with glycosaminoglycan-specific enzymes from the supernatant (A) and cell extract (B) of the immature erythroid progenitor cell line HEL. Proteoglycans isolated by anion exchange chromatography from the supernatant (A) and cell extract (B) of HEL cells were submitted to size exclusion chromatography on a TSK 4000 column. Elution profiles are shown for the native, HNO2-treated, heparinase/heparitinase (Hep/Hept), and chondroitinase AC/ABC-treated (AC/ABC) samples. Elution profiles were monitored by liquid scintillation counting.
Size exclusion chromatography of proteoglycans after digestion with glycosaminoglycan-specific enzymes from the supernatant (A) and cell extract (B) of the immature erythroid progenitor cell line HEL. Proteoglycans isolated by anion exchange chromatography from the supernatant (A) and cell extract (B) of HEL cells were submitted to size exclusion chromatography on a TSK 4000 column. Elution profiles are shown for the native, HNO2-treated, heparinase/heparitinase (Hep/Hept), and chondroitinase AC/ABC-treated (AC/ABC) samples. Elution profiles were monitored by liquid scintillation counting.
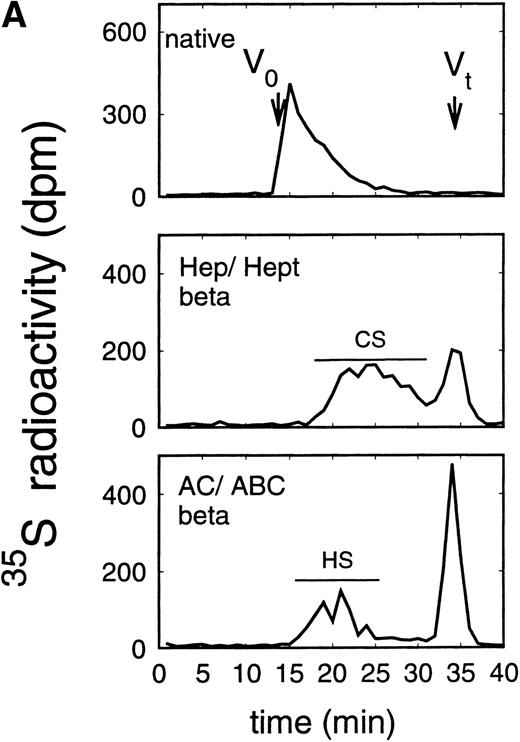
Size exclusion chromatography of proteoglycans from the supernatant (A) and cell extract (B) of the murine erythroid progenitor cell line ELM-D. Proteoglycans isolated by anion exchange chromatography from the supernatant (A) and cell extract (B) of ELM-D cells were submitted to size exclusion chromatography on a TSK 4000 column. Elution profiles are shown for the native, HNO2-treated, heparinase/heparitinase (Hep/Hept), and chondroitinase AC/ABC-treated (AC/ABC) samples. Elution profiles were monitored by liquid scintillation counting.
Size exclusion chromatography of proteoglycans from the supernatant (A) and cell extract (B) of the murine erythroid progenitor cell line ELM-D. Proteoglycans isolated by anion exchange chromatography from the supernatant (A) and cell extract (B) of ELM-D cells were submitted to size exclusion chromatography on a TSK 4000 column. Elution profiles are shown for the native, HNO2-treated, heparinase/heparitinase (Hep/Hept), and chondroitinase AC/ABC-treated (AC/ABC) samples. Elution profiles were monitored by liquid scintillation counting.
Size exclusion chromatography of proteoglycans from the supernatant and cell extract of HEL cells is shown in Figs 1 and 2. For the native sample proteoglycans in the range of Kav 0.05 to Kav 0.50 were detected. HNO2 treatment of this sample showed that it contained chondroitin sulfate and HS proteoglycans with comparable molecular-weight distributions (Figs 1and 2). SDS-PAGE analysis of the samples before and after digestion with glycosaminoglycan-specific enzymes using fluorographic detection showed a molecular-weight distribution of about >300,000 to 150,000 daltons for the chondroitin sulfate proteoglycan and >200,000 to 100,000 daltons for the HS proteoglycan (Fig 4), calculated from the electrophoretic mobility compared to [14C]-labeled standard proteins. The molecular-weight distribution of the HS proteoglycan was comparable to that isolated from the TF-1 cell line.25 In addition, in the cell extract of the HEL cell line a second smaller HS population was observed (Fig 2B).
SDS-PAGE of proteoglycans isolated from the supernatant of the immature erythroid progenitor cell line HEL. HS proteoglycans from HEL cells were metabolically radiolabeled with [35S]-sulfate. In addition, core proteins were metabolically labeled by a mixture of [35S]-methionine [35S]-cysteine and a [14C]-labeled amino acid mixture. Proteoglycans isolated from the supernatant of the immature erythroid progenitor cell line HEL were digested by chondroitinases AC/ABC (A), heparinase/heparitinase (H), or a combination of chondroitinases AC/ABC and heparinase/heparitinase (A/H) and submitted to SDS-PAGE on a 4% to 15% gel. N, native sample.
SDS-PAGE of proteoglycans isolated from the supernatant of the immature erythroid progenitor cell line HEL. HS proteoglycans from HEL cells were metabolically radiolabeled with [35S]-sulfate. In addition, core proteins were metabolically labeled by a mixture of [35S]-methionine [35S]-cysteine and a [14C]-labeled amino acid mixture. Proteoglycans isolated from the supernatant of the immature erythroid progenitor cell line HEL were digested by chondroitinases AC/ABC (A), heparinase/heparitinase (H), or a combination of chondroitinases AC/ABC and heparinase/heparitinase (A/H) and submitted to SDS-PAGE on a 4% to 15% gel. N, native sample.
Size exclusion chromatography of proteoglycans from the supernatant and cell extract of ELM-D cells is shown in Fig 3. For the native samples from the supernatant and cell extract proteoglycans in the range of Kav 0.05 to 0.45 were detected. HNO2 treatment of these samples showed that they contained chondroitin sulfate and HS proteoglycans with slightly different molecular-weight distributions (Fig 3). SDS-PAGE analysis of the samples before and after digestion with glycosaminoglycan-specific enzymes showed a molecular-weight distribution of about >300,000 to 100,000 daltons for the HS proteoglycans and about >250,000 to 100,000 daltons for the chondroitin sulfate proteoglycan (data not shown).
In addition to the analysis of the native proteoglycans, the molecular-weight distribution of their glycosaminoglycan moieties was analyzed after β-elimination (Figs 5 and6). Proteoglycans from the supernatant of HEL cells had HS glycosaminoglycan chains with a Kav of 0.38 to 0.81, corresponding to a molecular weight (Mr) of ≈38,000 to 5,800 daltons when compared with glycosaminoglycan chains of known molecular-weight distribution44 (and data not shown) (Fig 5A), whereas the size of the chondroitin sulfate chains was larger with a Kav of 0.13 to 0.50 (Fig 5A), corresponding to an Mr of ≈65,000 to 25,000 daltons. Comparable data were obtained for the glycosaminoglycan chains of proteoglycans isolated from the cell extract (Fig 5B). In contrast, HS glycosaminoglycan chains from the proteoglycans in the supernatant of ELM-D cells were larger with a Kav of 0.13 to 0.54, corresponding to an Mr of ≈65,000 to 21,000 daltons (Fig 6A), whereas the size of the chondroitin sulfate chains with a Kav of 0.18 to 0.81, corresponding to an Mr of ≈60,000 to 5,800 daltons, was similar to those found in the HEL cell line (Fig 3). Glycosaminoglycan chains of proteoglycans isolated from the cell extract (Fig 6B) showed a somewhat different distribution. In addition to the large HS chains with a Kavof 0.13 to 0.54 corresponding to an Mr of ≈65,000 to 21,000, which may be attributed to betaglycan, a second HS population with a Kav of 0.54 to 0.81, corresponding to an Mr of ≈21,000 to 5,800, was observed, which was comparable to the smaller HS chains observed in HEL and TF-1 cells and therefore most probably can be attributed to the 59-kD core protein HS proteoglycan.
Size exclusion chromatography of glycosaminoglycan chains obtained after β-elimination of proteoglycans from the supernatant (A) and cell extract (B) of the immature erythroid progenitor cell line HEL. Proteoglycans from the supernatant (A) and cell extract (B) of HEL cells were treated first either by heparinase/heparitinase or chondroitinase AC/ABC and thereafter submitted to β-elimination. Size exclusion chromatography was performed on a TSK 4000 column. Elution profiles were monitored by liquid scintillation counting.
Size exclusion chromatography of glycosaminoglycan chains obtained after β-elimination of proteoglycans from the supernatant (A) and cell extract (B) of the immature erythroid progenitor cell line HEL. Proteoglycans from the supernatant (A) and cell extract (B) of HEL cells were treated first either by heparinase/heparitinase or chondroitinase AC/ABC and thereafter submitted to β-elimination. Size exclusion chromatography was performed on a TSK 4000 column. Elution profiles were monitored by liquid scintillation counting.
Size exclusion chromatography of glycosaminoglycan chains obtained after β-elimination of proteoglycans from the supernatant (A) and cell extract (B) of the murine erythroid progenitor cell line ELM-D. Proteoglycans from the supernatant (A) and cell extract (B) of ELM-D cells were treated first either by heparinase/heparitinase or chondroitinase AC/ABC and thereafter submitted to β-elimination. Size-exclusion chromatography was performed on a TSK 4000 column. Elution profiles were monitored by liquid scintillation counting.
Size exclusion chromatography of glycosaminoglycan chains obtained after β-elimination of proteoglycans from the supernatant (A) and cell extract (B) of the murine erythroid progenitor cell line ELM-D. Proteoglycans from the supernatant (A) and cell extract (B) of ELM-D cells were treated first either by heparinase/heparitinase or chondroitinase AC/ABC and thereafter submitted to β-elimination. Size-exclusion chromatography was performed on a TSK 4000 column. Elution profiles were monitored by liquid scintillation counting.
Characterization of proteoglycans from the promyelocytic/myeloblastic hematopoietic progenitor cell lines B1 and B2.
Analysis of metabolically labeled proteoglycans from the murine promyelocytic/myeloblastic cell lines B1 and B2 by SDS-PAGE, before and after treatment with different glycosaminoglycan-specific enzymes, showed a chondroitin sulfate proteoglycan with a molecular-weight distribution of about Mr >200,000 to 100,000 daltons as the only proteoglycan (data not shown).
RT-PCR and Northern blot analysis of proteoglycans from the hematopoietic progenitor cell lines.
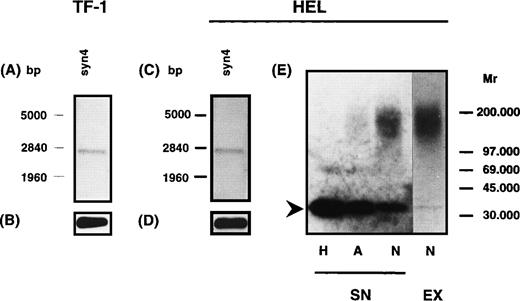
To address the question of whether the HS proteoglycans expressed by the hematopoietic progenitor cell lines TF-1, HEL, and ELM-D are related to known cell-surface–associated HS proteoglycans, RT-PCR analysis was performed using specific primer pairs for the different syndecans (1-4), glypican and betaglycan. Specificity of PCR-amplification products was confirmed by sequencing of cloned amplification products. RT-PCR analysis showed that in the HEL cell line syndecan-2 and syndecan-4, and in TF-1 cells only syndecan-4, were detectable on the mRNA level. In contrast, in ELM-D cells syndecan-1, syndecan-2, syndecan-4, betaglycan, and glypican could be detected on the mRNA level (data not shown). To confirm expression of the different HS proteoglycans shown by RT-PCR, poly(A+) RNA from TF-1 and HEL cells was analyzed in Northern blots using DIG-labeled probes for syndecan-2, syndecan-4, and betaglycan. The probe for syndecan-4 detected one band at ≈2.6 kb in HEL and TF-1 cells (Fig 7). The probe for syndecan-2 detected one band at 2 kb and a double band at ≈2.9 kb in the HEL but not in the TF-1 cell line (data not shown). For betaglycan no message was detectable in HEL and TF-1 cells even after prolonged exposure time. However, in control experiments using the BM stromal cell line MS-5, a message for betaglycan with the expected size of ≈6 kb was observed.45
Northern blot and Western blot analysis of syndecan-4 expression in TF-1 and HEL cells. Northern blot analysis was performed using a digoxigenin-labeled hybridization probe for syndecan-4. A specific signal could be detected for syndecan-4 in TF-1 (A) and HEL (C) cells. GAPDH was used as a control (B and D). For Western blot analysis (E), HS proteoglycans from the supernatant of HEL cells were isolated and digested by heparinase/heparitinase (H) or chondroitinases AC/ABC (A) and submitted to SDS-PAGE on a 4% to 15% gel. The untreated sample is shown on lane N. Detection was performed using the syndecan-4 specific MoAb 8G3. The core protein of syndecan-4 is indicated by an arrowhead. It might be noted that in HEL cells a substantial amount of free core protein of syndecan-4 is detectable.
Northern blot and Western blot analysis of syndecan-4 expression in TF-1 and HEL cells. Northern blot analysis was performed using a digoxigenin-labeled hybridization probe for syndecan-4. A specific signal could be detected for syndecan-4 in TF-1 (A) and HEL (C) cells. GAPDH was used as a control (B and D). For Western blot analysis (E), HS proteoglycans from the supernatant of HEL cells were isolated and digested by heparinase/heparitinase (H) or chondroitinases AC/ABC (A) and submitted to SDS-PAGE on a 4% to 15% gel. The untreated sample is shown on lane N. Detection was performed using the syndecan-4 specific MoAb 8G3. The core protein of syndecan-4 is indicated by an arrowhead. It might be noted that in HEL cells a substantial amount of free core protein of syndecan-4 is detectable.
Immunochemical analysis of proteoglycan core proteins from hematopoietic progenitor cell lines.
Immunochemical analysis of HS proteoglycans core proteins was performed using MoAbs against cell-surface HS proteoglycans of the syndecan family and against glypican and the MoAb 3 G 10 against an epitope generated in heparitinase-digested HS proteoglycans.46Dot-blot analysis with the specific antibodies was used instead of Western blot analysis because of the higher sensitivity of detection. HS proteoglycans isolated from the cell extract of a human cervix fibroblast cell line were used as positive controls. The reactivity of the proteoglycans from the supernatant and cell extract of HEL and ELM-D cells with the different MoAbs in the semiquantitative dot-blot analysis is summarized in Table 1. These data indicate expression of syndecan-4 in the HEL and ELM-D cell lines on the protein level.
Expression of Cell-Surface HS Proteoglycans
| MoAb Against . | HEL Supernatant/ Extract . | ELM-D Supernatant/ Extract . | Cervix Fibroblasts Cell Extract . |
|---|---|---|---|
| Syndecan-2 (6G12) | −/− | −/− | + |
| Syndecan-4 (8G3) | +/+ | +/(+) | + |
| Glypican (S1) | −/− | +/(+) | + |
| HS proteoglycans (3G10) | +/+ | +/+ | + |
| MoAb Against . | HEL Supernatant/ Extract . | ELM-D Supernatant/ Extract . | Cervix Fibroblasts Cell Extract . |
|---|---|---|---|
| Syndecan-2 (6G12) | −/− | −/− | + |
| Syndecan-4 (8G3) | +/+ | +/(+) | + |
| Glypican (S1) | −/− | +/(+) | + |
| HS proteoglycans (3G10) | +/+ | +/+ | + |
5 μL of proteoglycan-containing samples were applied to Biodyne B membrane; subsequently, membranes were blocked by 5% BSA/5% dry milk as described in Materials and Methods. Detection was performed by the use of the indicated specific MoAbs against the different HS proteoglycans and the ECL-system. Very weak staining for syndecan-4 and glypican in the cell extract is indicated by (+).
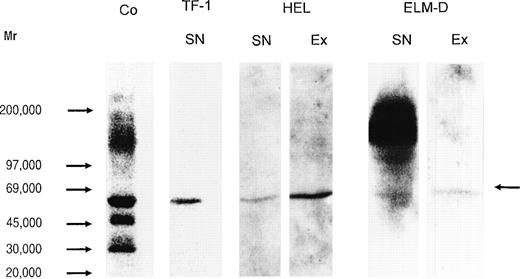
In Western blot analysis, using the MoAb 3 G 10, a strong staining was observed for the core proteins of HS proteoglycans from the human cervix fibroblast cell line (Fig 8, control). This staining could be attributed, according to the size of the core proteins detected and by semiquantitative dot-blot analysis using the specific MoAbs, to syndecan-1 (≈70 kD), syndecan-2 (48 kD), syndecan-3 (125 kD), syndecan-4 (35 kD), glypican (64 kD), and betaglycan (≈120 kD). In the supernatant and cell extract of HEL cells only one signal in the range of ≈60 kD was detected (Fig 8), and like the HS proteoglycan core protein of the same size that has been isolated from TF-1 cells,25 could not be assigned to known members of the syndecan family, nor to glypican or betaglycan. In contrast to a positive staining for syndecan-4 in the dot-blot analysis (Table 1), the Western blot using the MoAb 3G10 did not show a core protein with the expected size of 35 kD in HEL cells, indicating that syndecan-4 is expressed at a low level. This was confirmed by Western blot analysis of a concentrated sample (by a factor of about 40), using the syndecan-4–specific MoAb 8G3. Figure 7 shows that syndecan-4 is expressed as a HS proteoglycan in the HEL cell line. It might be noted that, in contrast to the cell extract, in the supernatant a considerable amount of free core protein was observed. A decreased staining of the native proteoglycan after treatment with chondroitinases AC/ABC indicated that at least part of the syndecan-4 core protein is substituted with chondroitin sulfate chains. In the supernatant and cell extract of ELM-D cells, in addition to the signal in the range of ≈60 kD, a strongly stained band was observed at ≈110 to 145 kD (Fig 8) and could be assigned to betaglycan. This was confirmed by RT-PCR analysis (data not shown). Although in ELM-D cells glypican was detectable by RT-PCR (data not shown) and the sensitive dot-blot analysis, it could not be detected by the less sensitive Western blot using the glypican-specific antibody S1, indicating that glypican is expressed at a low level.
Immunochemical detection of HS proteoglycan core proteins isolated from hematopoietic progenitor cell lines. Proteoglycans from the human immature erythroid progenitor cell lines TF-1 and HEL and the more mature murine erythroid progenitor cell line ELM-D were treated by heparitinase, submitted to SDS-PAGE on a 4.5% to 15% gradient gel, and subsequently blotted to Biodyne B membrane. Detection was performed using MoAb 3G10 and the ECL-detection system. The MoAb 3G10 recognizes a common neoepitope, generated after heparitinase-digestion of HS proteoglycans.46 This MoAb has been shown to detect most, if not all, HS proteoglycan core proteins after heparitinase-digestion. HS proteoglycans from cervix fibroblasts (cell extract) are shown as positive control (Co, lane 1); supernatant (SN) of TF-1 cells (lane 2), supernatant (lane 3), and cell extract (Ex) (lane 4) of HEL cells; supernatant (lane 5) and cell extract of ELM-D (lane 6). The arrow indicates the HS proteoglycan core protein detected by the MoAb 3G10 in the erythroid progenitor cell lines TF-1, HEL, and ELM-D.
Immunochemical detection of HS proteoglycan core proteins isolated from hematopoietic progenitor cell lines. Proteoglycans from the human immature erythroid progenitor cell lines TF-1 and HEL and the more mature murine erythroid progenitor cell line ELM-D were treated by heparitinase, submitted to SDS-PAGE on a 4.5% to 15% gradient gel, and subsequently blotted to Biodyne B membrane. Detection was performed using MoAb 3G10 and the ECL-detection system. The MoAb 3G10 recognizes a common neoepitope, generated after heparitinase-digestion of HS proteoglycans.46 This MoAb has been shown to detect most, if not all, HS proteoglycan core proteins after heparitinase-digestion. HS proteoglycans from cervix fibroblasts (cell extract) are shown as positive control (Co, lane 1); supernatant (SN) of TF-1 cells (lane 2), supernatant (lane 3), and cell extract (Ex) (lane 4) of HEL cells; supernatant (lane 5) and cell extract of ELM-D (lane 6). The arrow indicates the HS proteoglycan core protein detected by the MoAb 3G10 in the erythroid progenitor cell lines TF-1, HEL, and ELM-D.
Analysis of metabolically labeled HS proteoglycan core proteins expressed by the immature erythroid progenitor cell line HEL.
HS proteoglycan core proteins expressed by the HEL cell line were metabolically labeled, isolated as described,25 and submitted to SDS-PAGE before and after digestion with glycosaminoglycan-specific enzymes. Figure 4 shows a molecular-weight distribution of about >300,000 to 150,000 daltons for the native chondroitin sulfate proteoglycan and >200,000 to 100,000 daltons for the native HS proteoglycan. For the HS proteoglycan a labeled core protein with a size of 59 kD was detected. Core protein labeling was hampered by the fact that expression of HS proteoglycan was downregulated under serum-free conditions. As dialysis of serum did not improve the results, labeling was performed in the presence of serum. Because of the presence of nonlabeled competing compounds, labeling efficiency was rather low. The metabolically labeled core protein of 59 kD was comparable to the core protein detected by the MoAb 3G10 in the HEL cell line (see above) and to that previously described for the TF-1 cell line.25
Induction of HS proteoglycan expression during early erythroid differentiation in the murine multipotent cell line FDCP-Mix-A4.
To determine if HS proteoglycan expression is associated with erythroid differentiation, we analyzed the proteoglycan production of FDCP-Mix-A4 cells after induction of erythroid differentiation or as a control after induction of granulocytic differentiation. In two separate experiments, FDCP-Mix-A4 cells were cultured in the presence of FCS, Epo, and low IL-3. After 3 to 4 days, consistent with the appearance of normoblasts in culture (data not shown), β-globin expression was observed in both experiments (Fig 9A). In a separate control experiment, granulocytic differentiation was induced by culturing FDCP-Mix-A4 cells in FCS, GM-CSF, G-CSF, and low IL-3.
Induction of HS proteoglycan expression during early erythroid differentiation in the murine multipotent cell line FDCP-Mix A4. Erythroid differentiation of the murine multipotent hematopoietic cell line FDCP-Mix A4 was induced by culturing the cells in FCS, Epo, and low IL-3. As a control, FDCP-Mix A4 cells were induced to differentiate along the granulocytic lineage by culturing the cells in FCS, GM-CSF, G-CSF, and low IL-3. Cells were metabolically radiolabeled by [35S]-sulfate for 24 hours. In parallel, cultures were set up for mRNA isolation. Proteoglycans from the supernantant of FDCP-Mix-A4 cells obtained at different time points after induction of erythroid differentiation were digested by chondroitinase AC/ABC, submitted to Sepharose Q anion exchange chromatography, and subsequently analyzed on a TSK 4000 column before (——) and after heparinase/heparitinase treatment (- - -). (A) The corresponding Northern blot analysis of β-globin mRNA expression (β-actin was used as control). (B) HS proteoglycan expression (analyzed as shown in part [D] as percent HS proteoglycan) in FDCP-Mix-A4 cells at different time points after induction of erythroid differentiation. (C) HS proteoglycan expression in FDCP-Mix-A4 cells at different time points after induction of granulocytic differentiation. (D) The respective chromatogram is given for day 2; the inset shows the corresponding Western blot of HS proteoglycan core protein using the MoAb 3G10 (see legend to Fig 8), and the 59-kD core protein is indicated by an arrowhead.
Induction of HS proteoglycan expression during early erythroid differentiation in the murine multipotent cell line FDCP-Mix A4. Erythroid differentiation of the murine multipotent hematopoietic cell line FDCP-Mix A4 was induced by culturing the cells in FCS, Epo, and low IL-3. As a control, FDCP-Mix A4 cells were induced to differentiate along the granulocytic lineage by culturing the cells in FCS, GM-CSF, G-CSF, and low IL-3. Cells were metabolically radiolabeled by [35S]-sulfate for 24 hours. In parallel, cultures were set up for mRNA isolation. Proteoglycans from the supernantant of FDCP-Mix-A4 cells obtained at different time points after induction of erythroid differentiation were digested by chondroitinase AC/ABC, submitted to Sepharose Q anion exchange chromatography, and subsequently analyzed on a TSK 4000 column before (——) and after heparinase/heparitinase treatment (- - -). (A) The corresponding Northern blot analysis of β-globin mRNA expression (β-actin was used as control). (B) HS proteoglycan expression (analyzed as shown in part [D] as percent HS proteoglycan) in FDCP-Mix-A4 cells at different time points after induction of erythroid differentiation. (C) HS proteoglycan expression in FDCP-Mix-A4 cells at different time points after induction of granulocytic differentiation. (D) The respective chromatogram is given for day 2; the inset shows the corresponding Western blot of HS proteoglycan core protein using the MoAb 3G10 (see legend to Fig 8), and the 59-kD core protein is indicated by an arrowhead.
Cells were metabolically radiolabeled at different time points during erythroid differentiation by 35S-sulfate for 24-hour intervals. Proteoglycans isolated from the supernantant and cell extract of FDCP-Mix-A4 cells were digested by chondroitinase AC/ABC, submitted to Sepharose Q anion exchange chromatography, and subsequently analyzed on a TSK 4000 column before and after heparinase/heparitinase treatment (Fig 9D). Whereas no HS proteoglycan was detectable in the cell extract (data not shown), the HS proteoglycan content in the supernatant was upregulated between day 1 and day 3 after induction of erythroid differentiation (Fig 9B).
Because these samples were predigested with chondroitinase AC/ABC, the relative maximum value of 32% of HS proteoglycans corresponds to ≈7% of total proteoglycans in the supernatant. Analysis of the HS proteoglycan core proteins, using the MoAb 3G10, showed a core protein of 59 kD (Fig 9D, inset). In contrast to previously published data19 25 and the control experiment shown in Fig 9C, a low expression of HS proteoglycan (up to 6%, corresponding to ≈1.3% of total proteoglycans) was observed in the supernatant of FDCP-Mix-A4 cells in experiments I and II on day 0 (Fig 9B). Morphological analysis showed a relatively high degree of spontaneous differentiation along all lineages in these experiments. This has been observed previously depending on the batches of horse serum used. The remaining proteoglycans after digestion with heparinase/heparitinase (Fig 9D, dashed line) were submitted to an additional treatment with chondroitinases AC/ABC, resulting in a complete degradation of proteoglycan material (data not shown).
As a control, proteoglycan expression was analyzed during granulocytic differentiation of FDCP-Mix-A4 cells. After granulocytic differentiation by culturing cells in FCS, GM-CSF, G-CSF, and low IL-3, FDCP-Mix-A4 cells were metabolically labeled with [35S]-sulfate for 24 hours at different stages of granulocytic differentiation. Proteoglycans from the supernatant and cell extract were analyzed as described above. As shown in Fig 9C, HS proteoglycans were not expressed during granulocytic differentiation. Granulocytic differentiation was confirmed by analysis of total cellular myeloperoxidase activity in cell extracts (data not shown).
DISCUSSION
HS proteoglycans represent a heterogeneous family of macromolecules that are involved in fundamental biological processes like cell-cell interaction and control of cell growth and differentiation.8,18,47-56 Recently, it has been shown that HS proteoglycans also play an important role in the interaction of hematopoietic stem and stromal cells.6-10,12,25,57 Most of these studies have pointed to stromal cells rather than hematopoietic stem cells or progenitor cells as the source of HS proteoglycans.10,19,20,21-25,57 The recent establishment of factor-dependent multipotent progenitor cell lines1,29 that are able to adhere and grow on stromal cells in the absence of added growth factors has made a detailed analysis of their proteoglycans possible. Studies on the murine committed myeloid progenitor cell lines FDCP-1 and FDCP-2,20,23 the multipotent hematopoietic progenitor cell line FDCP-Mix-A4,19 25 and the multilineage cell line Myl-D-7 (Drzeniek Z, Stöcker G, Just U, Siebertz B, and Haubeck H-D, unpublished results) have shown a chondroitin-4-sulfate proteoglycan to be the only proteoglycan in these murine hematopoietic cell lines. However, thus far the number of cell lines analyzed is rather limited and the question remains as to whether these results are representative for all hematopoietic progenitor cells.
Our results for the human hematopoietic progenitor cell line TF-1 clearly show that this is not the case.25 Analysis of proteoglycans from the TF-1 cell line showed that TF-1 cells expressed an HS proteoglycan as a major proteoglycan. The molecular-weight distribution of this HS proteoglycan was determined to be about >200 to 100 kD for the native molecule and the size of the core protein to ≈59 kD. To answer the question of whether this HS proteoglycan is related to known cell-surface–associated HS proteoglycans, immunochemical analysis of proteoglycans was performed by dot-blot and Western blot analysis using MoAbs against the different syndecan isoforms and glypican. In contrast to HS proteoglycans isolated from a human cervix fibroblast cell line, which were used as a control, the HS proteoglycan from the TF-1 cell line did not react with any of these MoAbs.25 Taken together, these data clearly show that this HS proteoglycan is distinct from known HS proteoglycans.
However, an important question was whether the difference between these results and previous results, obtained for the multipotent and committed myeloid progenitor cell lines, was due to the differentiation state of the hematopoietic progenitor cell lines (erythroid vmyeloid). To address this question, in this study we have analyzed the proteoglycan synthesis of several murine and human hematopoietic progenitor cell lines. Isolation and characterization of metabolically labeled proteoglycans from the cell lines HEL and ELM-D, which like TF-1 cells have an immature erythroid phenotype and the potential to differentiate along the erythroid lineage,29,30 showed that these cells synthesize the same HS proteoglycan, previously detected in TF-1 cells, as a major proteoglycan. Expression of HS proteoglycans in HEL cells was indicated by the previous studies of Schick et al.58,59 Although these investigators have focused on chondroitin sulfate proteoglycans and have not analyzed the HS proteoglycans in detail, it can be concluded from their data that about 25% of proteoglycans in the HEL cell line were HS proteoglycans. The investigators claimed that serglycin, a chondroitin sulfate proteoglycan, that is expressed in most hematopoietic progenitor cell lines,8,60,61 and betaglycan are the major proteoglycans in HEL cells.58,59 The chondroitin sulfate proteoglycan observed in our studies in TF-1, HEL, and ELM-D cells can most probably be attributed to serglycin, as evidenced by RT-PCR for HEL, TF-1, and ELM-D cells (data not shown). Although for serglycin our results are in accordance with the data of Schick et al,58 59 for betaglycan their interpretation could not be confirmed. In our hands betaglycan was not detectable by Western blot, RT-PCR, and Northern blot analysis in the HEL cell line. However, betaglycan was detected in the more mature murine committed erythroid progenitor cell line ELM-D (see below).
Immunochemical analysis using the MoAb 3G10 indicated that the HS proteoglycan with a core protein of 59 kD was the major HS proteoglycan in the HEL cell line. This was confirmed by metabolic labeling of the core protein, even though the labeling efficiency was low due to the presence of serum in the culture medium. To answer the question of whether the HS proteoglycans isolated from the hematopoietic progenitor cell lines TF-1, HEL, and ELM-D are related to known cell-surface–associated HS proteoglycans, RT-PCR, Northern blot, dot-blot and/or Western blot analysis was performed. These data clearly show that the HS proteoglycan with a 59-kD core protein, found in all three cell lines, is not related to known members of the syndecan family and to glypican. An interesting observation in the course of this analysis was that syndecan-4 is expressed on the mRNA and protein level in TF-1,25 HEL, and ELM-D. However, compared with the 59-kD core protein, expression of syndecan-4 was low and was seen in the Western blot only in a highly concentrated sample (Fig 7). Comparison of banding patterns after enzyme digestion indicated that at least part of the syndecan-4 core protein was substituted with chondroitin sulfate chains, with no evidence for hybrid molecules (Fig7). A similar finding was observed by Steinfeld et al.62 In addition to the novel HS proteoglycan, in the more mature erythroid progenitor cell line ELM-D a strong expression of betaglycan could also be detected on the RNA and protein level, whereas the expression of syndecan-2, syndecan-4, and glypican was rather low, as evidenced by comparison of dot-blot and Western blot results.
Analysis of the glycosaminoglycan chains showed that HS chains in TF-1 and HEL cells, where the 59-kD core protein HS proteoglycan was the only or major HS proteoglycan, were rather similar in size. In contrast, in ELM-D the molecular-weight distribution of glycosaminoglycan chains indicated the existence of different HS populations (Fig 6). This would fit to the expression of different HS proteoglycans as evidenced by dot-blot and Western blot analysis. Whether these different HS chains have different functions needs to be analyzed in detail.
Analysis of the cell lines suggested that expression of HS proteoglycan in hematopoietic progenitor cell lines is associated with the erythroid lineage. To prove this hypothesis we have analyzed the proteoglycan expression in the nonleukemic multipotent hematopoietic stem cell line FDCP-Mix-A4 after induction of erythroid or granulocytic differentiation. Our data show that HS proteoglycan expression is induced during early erythroid differentiation of multipotent hematopoietic stem cells between day 1 and day 3. The increase of HS proteoglycan between day 1 and day 3 is not caused by the upregulation of different HS proteoglycans, as only the 59-kD core protein HS proteoglycan was detectable by the use of 3G10 (for detection of syndecan-4, a highly concentrated sample was necessary). Furthermore, because the total content of proteoglycans (calculated per cell number) did not change during the first 3 days, the increase of HS proteoglycan cannot be attributed to changes in total proteoglycans. However, a decrease of total proteoglycans was observed at day 4 and was nearly complete at day 7 (data not shown). In addition, the increase is not due to changes of GAG chain length as the size of the native proteoglycans did not change. It might be noted that in some of the experiments low-level expression of HS proteoglycan was observed in nonstimulated FDCP-Mix-A4 cells (at day 0) and may be due to spontaneous differentiation of some FDCP-Mix-A4 cells into the erythroid lineage. However, detection of this low level of HS proteoglycan expression required an improved analytical approach and would have been missed by conventional analysis. Although a strong induction of HS proteoglycan was observed during early erythroid differentiation of FDCP-Mix-A4 cells, compared with the cell lines HEL and TF-1, the total level was somewhat lower in FDCP-Mix-A4 cells. Although HEL and TF-1 cells were a rather homogenous population of leukemic erythroblasts under the conditions studied, FDCP-Mix-A4 cells showed some differentiation into granulocytes and macrophages in addition to the synchronously differentiating erythroid cells after induction of differentiation by FCS and Epo. Thus, the difference in the levels of HS proteoglycan, at least in part, reflects the different amount of immature erythroid cells in the cultures. In accordance with our analysis of cell lines of the myeloid lineage, ie, B1 and B2, and previously published results,20,23 25 no expression of HS proteoglycans was observed during granulocytic differentiation of FDCP-Mix-A4 cells.
The function of the novel HS proteoglycan, synthesized by human and mouse erythroid cells, has not been studied until now. The strong association of the expression of this HS proteoglycan with the erythroid lineage suggests a specific function of this HS proteoglycan during erythroid differentiation. Because the expression of this HS proteoglycan is associated with those differentiation stages, when erythroid progenitor cells become susceptible to Epo, it is tempting to speculate that this HS proteoglycan may bind Epo and presents it to its signal-transducing receptor. Such a binding of growth factors by HS proteoglycans has been shown by Gordon et al6 and Roberts et al7 for HS proteoglycans expressed on BM stromal cells. These HS proteoglycans, although they have not been characterized in detail, can bind growth factors and present them in a biologically active form to hematopoietic stem and progenitor cells. There is increasing evidence from other cell systems that growth factor binding by HS proteoglycans plays an important role for growth and differentiation.13,15,16,18,54,63-66Recently, cell-associated or membrane-bound HS proteoglycans have been described to function as coreceptors for basic fibroblast growth factor (bFGF) and transforming growth factor-β (TGF-β).16,17 66 Thus, this novel HS proteoglycan may similarly have a role as a coreceptor for Epo.
Previous studies indicated that membrane-associated proteoglycans of hematopoietic cells are interacting with either stromal cells or the ECM, thereby mediating adhesion and homing.10,23,57,67 68As the amount of HS proteoglycan produced appears to be related to the differentiation state, ie, upregulated during the early stages of erythroid differentiation and downregulated when the cells mature into erythrocytes, HS proteoglycan may be also involved in the adhesion and homing of early erythroid precursors to the sites of erythropoiesis in the BM.
Further investigation is needed to determine the function of this novel HS proteoglycan during erythropoiesis. Once the cDNA for this novel HS proteoglycan is available, studies on its structure, its binding of growth factors and ECM, and its possible association with specific receptors may help to define the role of this HS proteoglycan in hematopoiesis.
Supported by Grants No. Ha 1565/2-2, OS 31/14, and Ju 197/3-2 from the Deutsche Forschungsgemeinschaft.
The publication costs of this article were defrayed in part by page charge payment. This article must therefore be hereby marked “advertisement” in accordance with 18 U.S.C. section 1734 solely to indicate this fact.
REFERENCES
Author notes
Address reprint requests to Hans-Dieter Haubeck, MD, Institute for Clinical Chemistry and Pathobiochemistry, Medical Faculty, University of Technology, Pauwelsstr. 30, D-52057 Aachen, Germany.

![Fig. 4. SDS-PAGE of proteoglycans isolated from the supernatant of the immature erythroid progenitor cell line HEL. HS proteoglycans from HEL cells were metabolically radiolabeled with [35S]-sulfate. In addition, core proteins were metabolically labeled by a mixture of [35S]-methionine [35S]-cysteine and a [14C]-labeled amino acid mixture. Proteoglycans isolated from the supernatant of the immature erythroid progenitor cell line HEL were digested by chondroitinases AC/ABC (A), heparinase/heparitinase (H), or a combination of chondroitinases AC/ABC and heparinase/heparitinase (A/H) and submitted to SDS-PAGE on a 4% to 15% gel. N, native sample.](https://ash.silverchair-cdn.com/ash/content_public/journal/blood/93/9/10.1182_blood.v93.9.2884/4/m_blod40938004w.jpeg?Expires=1767892899&Signature=RlBdWx92Ovdy-f6yYxcuQWnD49FNG7B7dn1-nblsZwuFKppp2hcoLv1~t2a6vhjLEdy7yVQVEMdCO7wZWs1h7X4XWxdTrc--qHFmKcmzqDoSIZsZBbSQrZkgFVKQI6TyG7oFroQb1jbXznO1Xod5wZLQOn8GHHBiBjEJI0EmR8pVd4Ig6s4KtuPt36t~h1~J7Hium-DQgFTQiw3PflcmVVFeAoII~TeLlI2zChj6E2AhdZlc47Pnokog7iWYK6MTlLk~UZEcncUpQ53JdG27xetFSHvlDAIiqb3KFHcDrS4xprL17AlwsQgldbdN3GeqdaqaihN4ZSJ~1hr0bIb0UQ__&Key-Pair-Id=APKAIE5G5CRDK6RD3PGA)
![Fig. 9. Induction of HS proteoglycan expression during early erythroid differentiation in the murine multipotent cell line FDCP-Mix A4. Erythroid differentiation of the murine multipotent hematopoietic cell line FDCP-Mix A4 was induced by culturing the cells in FCS, Epo, and low IL-3. As a control, FDCP-Mix A4 cells were induced to differentiate along the granulocytic lineage by culturing the cells in FCS, GM-CSF, G-CSF, and low IL-3. Cells were metabolically radiolabeled by [35S]-sulfate for 24 hours. In parallel, cultures were set up for mRNA isolation. Proteoglycans from the supernantant of FDCP-Mix-A4 cells obtained at different time points after induction of erythroid differentiation were digested by chondroitinase AC/ABC, submitted to Sepharose Q anion exchange chromatography, and subsequently analyzed on a TSK 4000 column before (——) and after heparinase/heparitinase treatment (- - -). (A) The corresponding Northern blot analysis of β-globin mRNA expression (β-actin was used as control). (B) HS proteoglycan expression (analyzed as shown in part [D] as percent HS proteoglycan) in FDCP-Mix-A4 cells at different time points after induction of erythroid differentiation. (C) HS proteoglycan expression in FDCP-Mix-A4 cells at different time points after induction of granulocytic differentiation. (D) The respective chromatogram is given for day 2; the inset shows the corresponding Western blot of HS proteoglycan core protein using the MoAb 3G10 (see legend to Fig 8), and the 59-kD core protein is indicated by an arrowhead.](https://ash.silverchair-cdn.com/ash/content_public/journal/blood/93/9/10.1182_blood.v93.9.2884/4/m_blod40938009w.jpeg?Expires=1767892899&Signature=LckJILPsr6mTxsc4hvf6dN0wok7syOhZ189dKwOecLwBPugyeKPenPuuhgBiRzSsTQRAu1SgeI8Vj3pSo-PWKgxUdOtXSKVnPQ2Xkl86K3An-G6s~7IAFtngjAL2KhhbWaVXX5qaBJgNf~cC7PYkXip3JXKU6JY0UCz3dA2Ng8jRNW0DsxCE83gySgRy8FOI-Kf0aM~n~J9dzxPOvCJh1Cc2bxy1kwUF4CALXZWNaVUzoJDHqprz4tdQG7woSCgVPLOPSo5q8E4~xm28D7dkynnFpzrsrVJJBWlKRdzf8k~Sqtf1tN26vc7WhbB7ZtEOIpAiwlKtUk-ezRtDt-k8AA__&Key-Pair-Id=APKAIE5G5CRDK6RD3PGA)
This feature is available to Subscribers Only
Sign In or Create an Account Close Modal