Abstract
Ras signaling plays an important role in erythropoiesis. Its function has been extensively studied in erythroid and nonerythroid cell lines as well as in primary erythroblasts, but inconclusive results using conventional erythroid colony-forming unit (CFU-E) assays have been obtained concerning the role of Ras signaling in erythroid differentiation. Here we describe a novel culture system that supports terminal fetal liver erythroblast proliferation and differentiation and that closely recapitulates erythroid development in vivo. Erythroid differentiation is monitored step by step and quantitatively by a flow cytometry analysis; this analysis distinguishes CD71 and TER119 double-stained erythroblasts into different stages of differentiation. To study the role of Ras signaling in erythroid differentiation, different H-ras proteins were expressed in CFU-E progenitors and early erythroblasts with the use of a bicistronic retroviral system, and their effects on CFU-E colony formation and erythroid differentiation were analyzed. Only oncogenic H-ras, not dominant-negative H-ras, reduced CFU-E colony formation. Analysis of infected erythroblasts in our newly developed system showed that oncogenic H-ras blocks terminal erythroid differentiation, but not through promoting apoptosis of terminally differentiated erythroid cells. Rather, oncogenic H-ras promotes abnormal proliferation of CFU-E progenitors and early erythroblasts and supports their erythropoietin (Epo)–independent growth.
Introduction
Within the fetal liver and the adult bone marrow, hematopoietic cells are formed continuously from a small population of pluripotent stem cells that generate progenitors committed to one or a few hematopoietic lineages. In the erythroid lineage, the earliest committed progenitors identified ex vivo are the slowly proliferating erythroid burst-forming units (BFU-Es).1,2 These early BFU-E cells divide and further differentiate through the “mature” BFU-E stage into rapidly dividing erythroid colony-forming units (CFU-Es). Neither of these 2 types of progenitors is identified by morphology but instead by the colonies they produce in colony-formation assays. BFU-E colonies take 15 days (human) or 7 to 10 days (mouse) to form in culture, whereas CFU-E colonies take 7 days (human) or 2 days (mouse).1,2 CFU-E progenitors undergo 3 to 5 divisions as they differentiate through several morphologically defined stages: proerythroblasts, basophilic erythroblasts, polychromatophilic erythroblasts, and orthochromatophilic erythroblasts (OEs). Finally, the OEs extrude their nuclei (enucleation) and become reticulocytes, which further expel all organelles and detach from their microenvironment to form mature circulating erythrocytes. As erythroid differentiation proceeds, erythroblasts display a gradual decrease in cell size, increase in chromatin condensation, and increase in hemoglobin concentration.3
Several cytokines and their receptors are important for erythroid differentiation. Among them, erythropoietin (Epo) and its specific receptor (EpoR) are crucial for promoting the survival, proliferation, and differentiation of mammalian erythroid progenitor cells.4,5 Both Epo-/- and EpoR-/- mice die around embryonic day 13 (E13), owing to failure of definitive fetal liver erythropoiesis.6 Erythroid cells respond to Epo in a stage-specific manner.7 Differentiation from CFU-Es to late basophilic erythroblasts is highly Epo dependent, whereas differentiation beyond this stage is no longer dependent on Epo.
Once Epo binds to EpoR, EpoR is phosphorylated by Janus kinase 2 (Jak2), leading to the activation of several downstream signaling pathways including Ras signaling pathways.8-10 These pathways play an import role in erythropoiesis, as evidenced by the fact that both K-ras-/- mice and N-ras-/-K-ras+/- mice display severe anemia and die at early embryonic stages.11 Several studies suggest that the reduced erythroid output in myelodysplastic syndrome (MDS) patients that carry Ras mutations may result partly from a block in precursor formation,12-14 indicating a role of Ras signaling in lineage determination. Moreover, in human CD34+ cells expressing oncogenic N-Ras, erythroid terminal differentiation is blocked with enhanced apoptosis and reduced proliferation rate,15 suggesting a role of Ras signaling in erythroid differentiation.
Previously, it was reported that both oncogenic H-ras and dominant-negative H-ras reduce CFU-E colony formation.16 However, the cellular mechanisms underlying this seemingly confusing observation remain unclear. Many cellular events contribute to CFU-E colony formation, including erythroblast survival, proliferation, and differentiation. Any perturbation of these events may lead to the same phenotype: the reduction of CFU-E colonies. Occasionally, even when the number of CFU-E colonies remains similar after the introduction of a signaling molecule, the size and morphology of the colonies are different.17 However, conventional CFU-E colony assays do not allow one to monitor the progression of CFU-Es through terminal differentiation step by step or in a highly quantitative manner. Therefore, the precise differentiation stage affected by a signaling molecule of interest cannot be identified in this assay, nor can there be any determination of the cellular mechanisms.
Recently, in our laboratory a flow cytometry assay was developed that allows quantitative evaluation of erythroid differentiation in neonatal and adult hematopoietic tissues.18 On the basis of the expression of the erythroid-specific TER119 and nonerythroid-specific CD71 (transferrin receptor), erythroid cells are sorted into 4 populations that correlate well with their maturation stages. With the use of this assay in neonatal spleen and adult hematopoietic tissues, the early erythroblast (CD71highTER119high) was identified as the principal target of signal transducers and activators of transcription 5 (Stat5), where it regulates cell survival. Potentially, this flow cytometry analysis can be used to monitor erythroid differentiation in culture.
Here, we report the development of an in vitro culture system that supports terminal erythroblast proliferation and differentiation in a manner that closely mimics the in vivo terminal proliferation and maturation of erythroid cells. In this system, differentiation of CFU-E progenitors can be followed step by step and in a quantitative manner by a flow cytometry analysis. Using this system, we show that only oncogenic H-ras, not dominant-negative H-ras, blocks CFU-E progenitor differentiation. The block of erythroblast differentiation is not caused by inducing apoptosis in terminally differentiated cells. Furthermore, we find that early erythroblasts expressing oncogenic H-ras proliferate abnormally and display extended growth in an Epo-independent manner.
Materials and methods
Cells
The retrovirus-packaging cell line BOSC23 (a gift from Dr Xiaowu Zhang, Whitehead Institute, Cambridge, MA)19 was maintained in Dulbecco modified Eagle medium (DMEM) containing 10% fetal bovine serum (FBS) (Invitrogen, Carlsbad, CA). NIH 3T3 cells were cultured in DMEM medium with 10% heat-inactivated fetal calf serum (Invitrogen).
Fetal liver cells were isolated from E12.5-E16.5 Balb/c (Jackson Laboratory, Bar Harbor, ME) or 129s/v embryos and mechanically dissociated by pipetting in erythroid-differentiation medium (EDM) (Iscove modified Dulbecco medium [IMDM] containing 20% FBS, 2 mM l-glutamine, and 10-4 M β-mercaptoethanol). Single-cell suspensions were prepared by passing the dissociated cells through 70 μm and 25 μm cell strainers. Nucleated cells were counted after reticulocytes were lysed by brief osmotic shock.
Erythroid differentiation in vitro
Total fetal liver cells were labeled with biotin-conjugated anti-TER119 antibody (1:100) (BD Pharmingen, San Diego, CA), and TER119- cells were purified through a StemSep column as per the manufacturer's instructions (StemCell Technologies, Vancouver, BC, Canada). Purified cells were seeded in fibronectin-coated wells (BD Discovery Labware, Bedford, MA) at a cell density of 1 × 10⁵/mL. On the first day, the purified cells were cultured in IMDM containing 15% FBS, 1% detoxified bovine serum albumin (BSA), 200 μg/mL holo-transferrin (Sigma, St Louis, MO), 10 μg/mL recombinant human insulin (Sigma), 2 mM l-glutamine, 10-4 M β-mercaptoethanol, and 2 U/mL Epo (Amgen, Thousand Oaks, CA). On the second day, this medium was replaced with EDM.
Epo-binding studies
Recombinant human Epo was labeled with iodine-125 (NEN/Perkin Elmer, Boston, MA) with the use of Iodo-Gen Iodination Reagent (Pierce Biotechnology, Rockford, IL). Iodine-125 radioactivity was measured with a COBRA II Auto-Gamma Counter (Packard Instrument, Meriden, CT), and the iodine-125–labeled recombinant human Epo (125I-Epo) routinely had a specific activity of 4 × 10⁶ cpm/pmole. A population of Ba/F3 cells expressing the mouse EpoR from the bicistronic retroviral vector pMX–EpoR–internal ribosome entry site–green fluorescent protein (pMX-EpoR-IRES-GFP) was sorted by fluorescence-activated cell sorter (FACS) for GFP expression (Ba/F3-EpoR cells; a kind gift of Dr L. J. Huang, Whitehead Institute). Scatchard analysis of 125I-Epo binding to Ba/F3-EpoR cells revealed an apparent equilibrium dissociation constant (Kd) of 0.8 nM and an average of 1800 Epo-binding sites per Ba/F3-EpoR cell.
To perform 125I-Epo–binding studies with primary mouse cells, purified fractions of E14.5 fetal liver cells were resuspended in EDM at 1 × 10⁷/mL. For each binding reaction, 3 × 10⁵ to 7 × 10⁵ cells were incubated with 2 nM 125I-Epo in a total volume of 0.1 mL EDM overnight at 4°C. Nonspecific binding was determined from parallel binding reactions containing both 2 nM 125I-Epo and 400 nM unlabeled competitor Epo. Specific binding was calculated as total binding minus nonspecific binding. Average numbers of Epo-binding sites on these cells were calculated on the basis of their percentage of specific binding compared with Ba/F3-EpoR cells.
Retroviral constructs
XZ201 vector (murine stem cell retroviral vector–IRES–GFP [MSCV-IRES-GFP]) was a gift from Dr Xiaowu Zhang (Whitehead Institute).20 MSCV-IRES–truncated human CD4 (hCD4) (MICD4) was constructed by replacing IRES-GFP in XZ201 with IRES-hCD4 in the pMIG vector.21 Plasmids containing human H-ras wild-type (wt), V12, and N17 mutants were kindly provided by Dr Akihiko Yoshimura (Kyushu University, Fukuoka, Japan). The inserts were subcloned 5′ to the IRES in the XZ201 and MICD4 vectors.
Generation of retroviral supernatants and infection of primary cells
BOSC23 cells were seeded on 100-mm dishes 1 day before transfection. Then, 16 μg retroviral plasmids together with the pCL-Eco vector22 was used to cotransfect BOSC23 cells by the Lipofectamine Plus reagents (Invitrogen) according to the manufacturer's protocol. The retroviral supernatants were collected 48 hours after transfection and stored in aliquots at -80°C. To titer the packaged viruses, a series of dilutions of the supernatants were used to infect NIH 3T3 cells; titers of 107 to 108 infectious units per milliliter were routinely obtained. For infection of purified TER119- fetal liver cells, 1.2 × 10⁴ to 5 × 10⁵ cells were resuspended in 1 mL thawed viral supernatant containing 10 μg/mL polybrene (Sigma) and centrifuged at 2000 rpm for 1 hour at 37°C.
Immunostaining and flow cytometry analysis of erythroid differentiation
Freshly isolated fetal liver cells were immunostained with phycoerythrin (PE)–conjugated anti-TER119 (1:200) (BD Pharmingen) and fluorescein isothiocyanate (FITC)–conjugated anti-CD71 (1:200) (BD Pharmingen) antibodies, essentially as previously described.18 Propidium iodide was added to exclude dead cells from analysis. R1-R5 cells were sorted by a FACS Moflo machine (Cytomation, Fort Collins, CO) with reduced pressure. For erythroblasts infected with MICD4 constructs and cultured in vitro, cells were removed from fibronectin-coated plates by incubating in phosphate-buffered saline (PBS)/10% FBS/5 mM EDTA (ethylenediaminetetraacetic acid) at 37°C for 5 minutes. Cells were immunostained for CD71, TER119, and hCD4 simultaneously. The hCD4 was detected by a mouse anti-hCD4 antibody (1:100) (BD Pharmingen) followed by cyanine 5 (Cy5)–conjugated donkey antimouse immunoglobulin G (IgG) antibody (1:50) (Jackson ImmunoResearch Laboratories, West Grove, PA). To exclude dead cells from analysis, 7-aminoactinomycin D (7-AAD) was used. Flow cytometry was carried out on a FACSCalibur (BD Biosciences, Franklin Lakes, NJ). The hCD4- and hCD4+ cells were determined by staining mock-infected cells with the same protocol.
Colony assays
To detect CFU-E colonies, 6 × 10⁴ E14.5 fetal liver cells, or 1.2 × 10⁴ sorted R1-R5 cells or retrovirally transduced TER119- cells, were plated in duplicate in semisolid medium (MethoCult M3334; StemCell Technologies) according to the manufacturer's protocol. Then, 2,7-diaminofluorene–positive (Sigma) colonies were counted after 2 days in culture. To detect primitive or mature BFU-E colonies, 6 × 10⁴ E14.5 fetal liver cells or sorted R1-R5 cells were plated in duplicate in semisolid medium (MethoCult M3434; StemCell Technologies) according to the manufacturer's protocol. The mature BFU-E colonies were detected after 3 days in culture. The primitive BFU-E colonies were counted after 7 to 10 days in culture.
Cytospin preparations and histologic stainings
First, 5000 to 20 000 sorted R1-R5 cells or in vitro cultured TER119- cells were centrifuged onto slides for 5 minutes at 1000 rpm (Cytospin 3; Thermo Shandon, Pittsburgh, PA) and air dried. Cells were fixed in -20°C methanol for 2 minutes and stained with May-Grunwald Giemsa stains or 3,3′-diaminobenzidine Giemsa stains according to the manufacturer's recommendations (Sigma).
Cell cycle analysis
Retrovirally transduced TER119- fetal liver cells were cultured in vitro for 2 days and then incubated at 37°C for 1 hour in the presence of 10 μg/mL Hoechst dye 33342 (Sigma). Propidium iodide was added to exclude dead cells. Flow cytometry was carried out on an LSR II flow cytometer (BD Biosciences). Collected data were analyzed by ModFit software (Verity Software House, Topsham, ME).
In vitro growth assay
Retrovirally transduced TER119- fetal liver cells were cultured in fibronectin-coated (BD Discovery Labware) wells (2 μg/cm2). For the first 2 days, cells were cultured as described in the preceding section. Thereafter, cells were maintained in EDM. At each time point, cells were removed from wells as described. Trypan blue (Invitrogen) was added to exclude dead cells, and total viable cells were counted. The percentages of viable GFP- and GFP+ cells were determined by flow cytometry. Once the cell density reached 1 to 1.5 × 10⁶/mL, cells were split to a density of 2.5 × 10⁵/mL.
Results
Flow cytometry analysis distinguishes mouse fetal liver erythroblasts at different developmental stages
Currently, colony formation assay is the most widely used method to study the roles of various signaling molecules in CFU-E differentiation. One major limitation of this method is that it does not allow for step-by-step monitoring of the progression of CFU-Es through the multiple steps of their terminal differentiation. Therefore, the precise differentiation stage(s) affected by a signaling molecule of interest cannot be identified in this assay, not to mention any determination of the cellular mechanisms. To overcome this limitation, we established an in vitro system that can be used to study erythroid differentiation quantitatively and in a step-by-step manner.
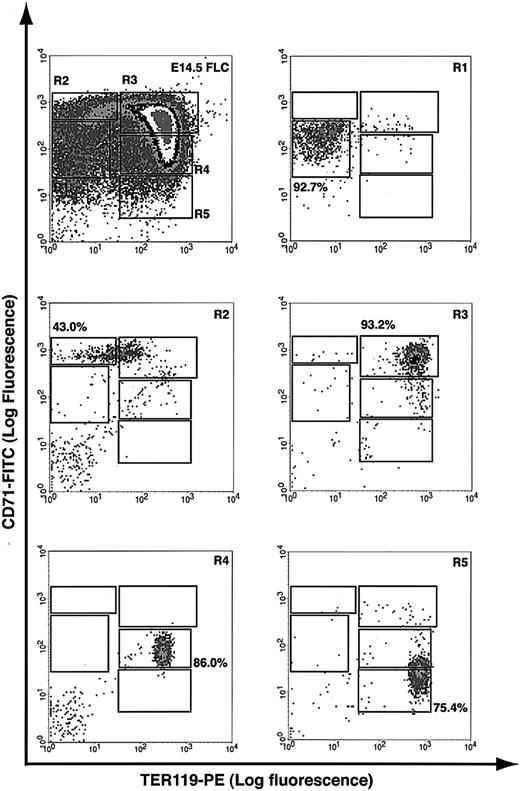
A flow cytometry analysis was recently developed in our laboratory to quantitatively assess spleen and bone marrow erythroblast differentiation in adult mice,18 and we applied a similar analysis to fetal liver cells. Essentially, fetal liver cells were double labeled for erythroid-specific TER119 and non–erythroid-specific transferrin receptor (CD71) and analyzed by flow cytometry.23,24 Our results showed that E14.5 fetal livers contained at least 5 distinct populations of cells, defined by their characteristic staining patterns: CD71medTER119low, CD71highTER119low, CD71highTER119high, CD71medTER119high, and CD71lowTER119high (Figure 1, regions R1 to R5, respectively).
Flow cytometry analysis of mouse fetal liver cells. Mouse fetal liver cells were freshly isolated from E14.5 embryos and double labeled with a FITC-conjugated anti-CD71 monoclonal antibody (mAb) and a PE-conjugated anti-TER119 mAb. Dead cells (propidium iodide–positive) and debris (low forward scatter) were excluded from analysis. The top left panel illustrates a density plot of all viable fetal liver cells; axes indicate relative logarithmic fluorescence units for PE (x-axis) and FITC (y-axis). Regions R1 to R5 are defined by characteristic staining pattern of cells, including CD71medTER119low, CD71highTER119low, CD71highTER119high, CD71medTER119high, and CD71lowTER119high, respectively. R1 to R5 cells were sorted by FACS and their purity was reanalyzed, as shown in the remaining 5 panels.
Flow cytometry analysis of mouse fetal liver cells. Mouse fetal liver cells were freshly isolated from E14.5 embryos and double labeled with a FITC-conjugated anti-CD71 monoclonal antibody (mAb) and a PE-conjugated anti-TER119 mAb. Dead cells (propidium iodide–positive) and debris (low forward scatter) were excluded from analysis. The top left panel illustrates a density plot of all viable fetal liver cells; axes indicate relative logarithmic fluorescence units for PE (x-axis) and FITC (y-axis). Regions R1 to R5 are defined by characteristic staining pattern of cells, including CD71medTER119low, CD71highTER119low, CD71highTER119high, CD71medTER119high, and CD71lowTER119high, respectively. R1 to R5 cells were sorted by FACS and their purity was reanalyzed, as shown in the remaining 5 panels.
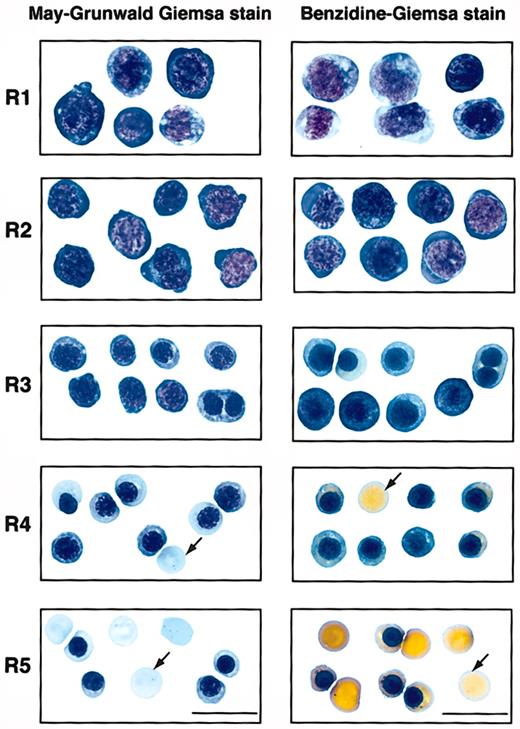
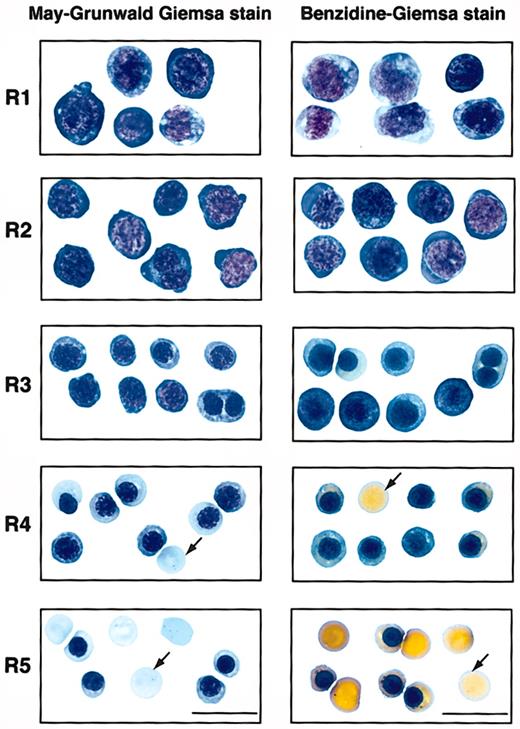
To examine if these 5 populations of cells correspond to erythroblasts at different developmental stages, we first sorted them by FACS (Figure 1). Typically, R2 cells were enriched to only 40% to 50% purity, whereas R1 and R3 to R5 cells were highly purified by FACS (greater than 75%). During erythroid differentiation, erythroblasts decrease in cell size, condense chromosomal DNA, increase cellular hemoglobin concentration, decrease surface expression level of the EpoR, and exit the cell cycle permanently.3,25,26 We therefore analyzed these sorted cells by colony assays, histologic stainings, and surface expression levels of EpoR. When sorted R1 to R5 cells were plated for colony assays, we found that approximately 40% of sorted R1 cells were CFU-Es (41 200/105 cells; Table 1). The percentage of CFU-E progenitors among R1 cells was about 5-fold that of total fetal liver cells (7420/105 nucleated cells; Table 1). R2 contained only a few CFU-Es (approximately 3000/105 cells; Table 1), whereas R3 to R5 contained no erythroid progenitors (Table 1). When R1 to R5 cells were processed by May-Grunwald Giemsa stains (Figure 2), their morphologies resembled erythroblasts at different developmental stages,3 with R1 being the least and R5 being the most differentiated. The morphologic characteristics (Figure 2) generally corresponded to primitive progenitor cells and proerythroblasts in the CD71medTER119low population (R1); proerythroblasts and early basophilic erythroblasts in the CD71highTER119low population (R2); early and late basophilic erythroblasts in the CD71highTER119high population (R3); chromatophilic and orthochromatophilic erythroblasts in the CD71medTER119high population (R4); and late orthochromatophilic erythroblasts and reticulocytes in the CD71lowTER119high population (R5). These results were consistent with those obtained from benzidine-Giemsa–stained R1 to R5 cells (Figure 2). Benzidine stains for hemoglobin, a hallmark of terminal erythroid differentiation. Cells from the R1 and R2 regions were benzidine-negative (Figure 2). Cells from the R3 region were a mixture of benzidine-negative and weakly benzidine-positive cells. R4 and R5 cells were all benzidine positive.
Sorted R1 to R5 cells that represent erythroblasts at different developmental stages. E14.5 fetal liver cells were double stained for TER119 and CD71 and sorted into R1 to R5 populations as described in Figure 1. The left panels show May-Grunwald Giemsa–stained cytospin preparations of cells sorted from each region of R1 to R5. Representative cells from 2 to 5 fields are shown in each region. These are predominantly primitive progenitor cells (including mature BFU-Es and CFU-Es) in R1, proerythroblasts and early basophilic erythroblasts in R2, early and late basophilic erythroblasts in R3, chromatophilic and orthochromatophilic erythroblasts in R4, and late orthochromatophilic erythroblasts and reticulocytes in R5. The right panels show the cytospin preparations of R1 to R5 cells processed by benzidine-Giemsa stain. Representative cells from several fields are shown in each region. Cells from the R1 and R2 regions are benzidine-negative. R3 is a mixture of benzidine-negative and benzidine-positive cells. Cells sorted from the R4 and R5 regions are all benzidine-positive. Arrows indicate enucleated reticulocytes. Scale bar: 20 μm.
Sorted R1 to R5 cells that represent erythroblasts at different developmental stages. E14.5 fetal liver cells were double stained for TER119 and CD71 and sorted into R1 to R5 populations as described in Figure 1. The left panels show May-Grunwald Giemsa–stained cytospin preparations of cells sorted from each region of R1 to R5. Representative cells from 2 to 5 fields are shown in each region. These are predominantly primitive progenitor cells (including mature BFU-Es and CFU-Es) in R1, proerythroblasts and early basophilic erythroblasts in R2, early and late basophilic erythroblasts in R3, chromatophilic and orthochromatophilic erythroblasts in R4, and late orthochromatophilic erythroblasts and reticulocytes in R5. The right panels show the cytospin preparations of R1 to R5 cells processed by benzidine-Giemsa stain. Representative cells from several fields are shown in each region. Cells from the R1 and R2 regions are benzidine-negative. R3 is a mixture of benzidine-negative and benzidine-positive cells. Cells sorted from the R4 and R5 regions are all benzidine-positive. Arrows indicate enucleated reticulocytes. Scale bar: 20 μm.
To further confirm that this flow cytometry analysis can distinguish erythroblasts at different developmental stages, we measured surface expression levels of the EpoR on different populations of cells (Table 2). On average, R1 and R2 cells had approximately 1900 cell-surface EpoRs per cell; R3 cells had approximately 750 cell-surface EpoRs per cell; R4 cells had approximately 250 cell-surface EpoRs per cell. Our data are consistent with previous reports that EpoR expression is down-regulated following the late basophilic erythroblast stage II.5,26
Taken together, our results showed that simultaneous detection of TER119 and CD71 by flow cytometry can be used to quantitatively identify fetal liver erythroblasts at different developmental stages. The defined R1 to R5 regions were validated by several criteria.
Flow cytometry analysis of mouse fetal liver erythroid differentiation in vivo
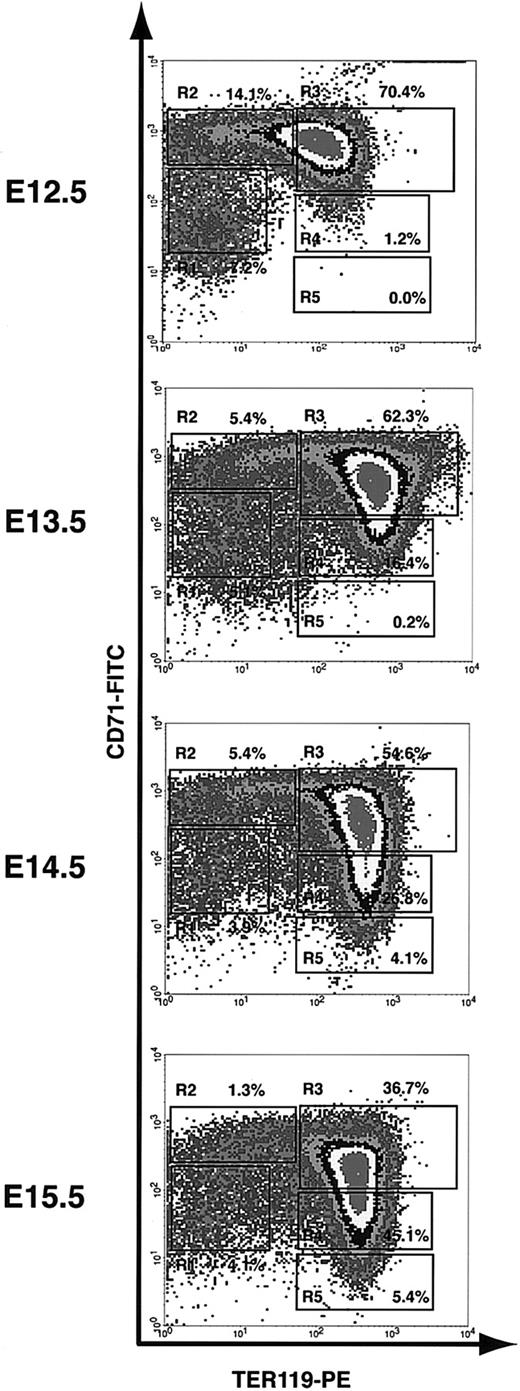
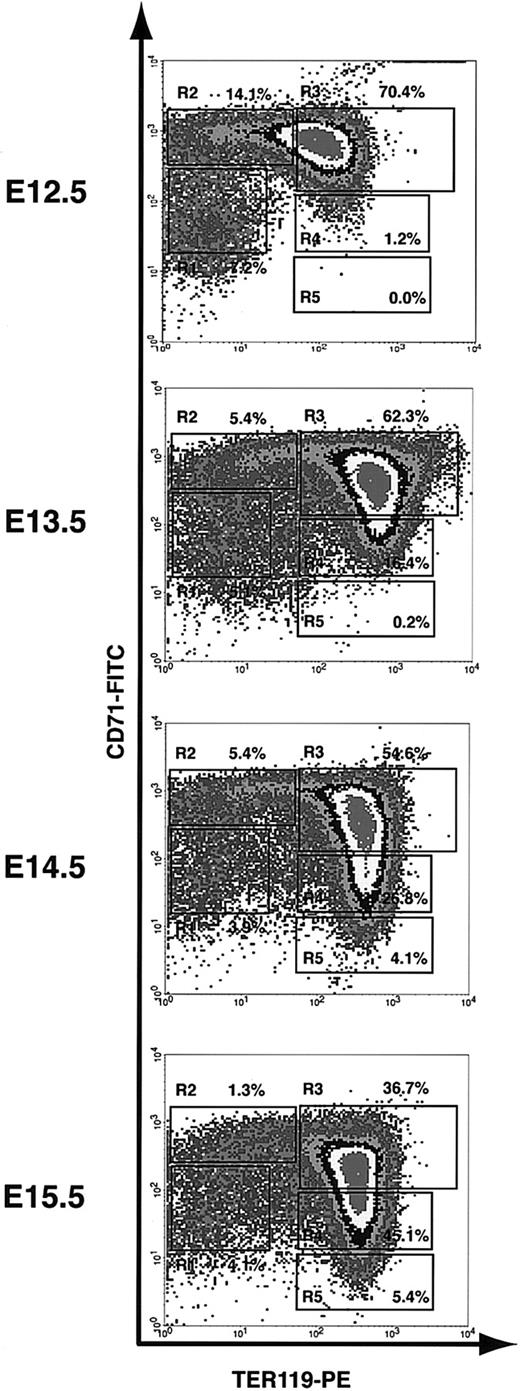
We used the flow cytometry analysis (as described) to monitor the first wave of definitive erythropoiesis in mouse fetal liver. On E12 in mice, the fetal liver becomes the major hematopoietic center, especially for erythropoiesis. Since most fetal liver cells are erythroid precursors, we analyzed total fetal liver cells. Although mouse definitive hematopoiesis starts on E12 in fetal liver, enucleated reticulocytes appear only after E13.27 Consistent with this notion, the flow cytometry analysis of E12.5 fetal liver cells showed only a few R4 cells and almost no R5 cells (1.2% and 0.0%, respectively; Figure 3). Starting from E13.5, R4 and R5 cells become more and more abundant. They comprised only 16.4% and 0.2%, respectively, of total fetal liver cells at E13.5, but 45.1% and 5.4%, respectively, at E15.5 (Figure 3). Conversely, the progenitor-rich R1 and R2 cells, which comprised 7.2% and 14.1%, respectively, of total fetal liver cells at E12.5, composed only 4.1% and 1.3%, respectively, at E15.5 (Figure 3). Both the flow cytometry profile and cell size distribution (measured by FACS forward scatter) of E16.5 fetal liver cells were very similar to those obtained from E15.5 fetal liver cells (data not shown), suggesting that the erythroid-differentiation process reaches a steady state after E15.5. At each time point, we tested more than 5 animals. Although the relative number of cells in each of the R1 to R5 populations varied somewhat among mice, the flow cytometry profiles were very consistent. Taken together, our results showed that the flow cytometry analysis that we have described can be used to monitor erythroid differentiation step by step.
Flow cytometry analysis of erythroid differentiation in vivo. E12.5 to E15.5 fetal liver cells were double stained for TER119 and CD71 and analyzed by flow cytometry as described in Figure 1. The relative number of cells from each region of R1 to R5 is indicated as a percentage of all viable cells and shown on each plot.
Flow cytometry analysis of erythroid differentiation in vivo. E12.5 to E15.5 fetal liver cells were double stained for TER119 and CD71 and analyzed by flow cytometry as described in Figure 1. The relative number of cells from each region of R1 to R5 is indicated as a percentage of all viable cells and shown on each plot.
An in vitro culture system supports normal terminal erythroid proliferation and differentiation
To study the role of signaling molecules in CFU-E differentiation, it is necessary to establish appropriate culture conditions that allow CFU-E progenitors to proliferate and differentiate properly in vitro. We purified TER119- cells from fetal livers. R1 and R2 cells comprised approximately 70% to 80% of this population, and there were essentially no R3 to R5 cells. Since the TER119- population contains both progenitor cells and all the differentiated nonerythroid lineages of hematopoietic cells, we labeled TER119- cells for lineage-specific markers as well as for c-Kit, which is expressed by most progenitors. We found that purified TER119- cells contained approximately 3% B220+ cells, approximately 1% CD3+ cells, essentially no Gr-1+cells, and approximately 9% Mac-1+ cells (data not shown). More than 90% of the TER119- cells were c-Kit+ (data not shown). These results suggest that the great majority of the TER119- population are erythroid progenitor cells. We first cultured the purified TER119- progenitor–rich cells using conventional conditions that maintain cells in suspension and in medium with serum and Epo alone or a combination of growth factors (interleukin 3 [IL-3], IL-6, stem cell factor [SCF], and Epo). However, these conditions did not support proper terminal proliferation and differentiation of early erythroblasts (data not shown). We therefore tested different culture conditions and examined erythroid-differentiation profiles by flow cytometry analysis and benzidine-Giemsa staining (see “Discussion”).
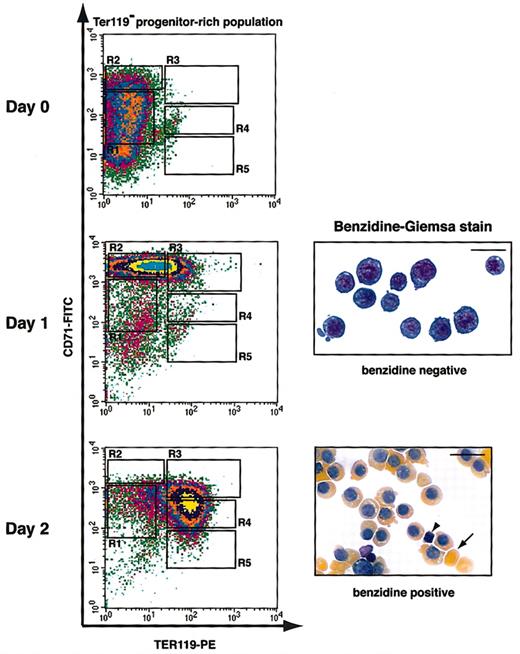
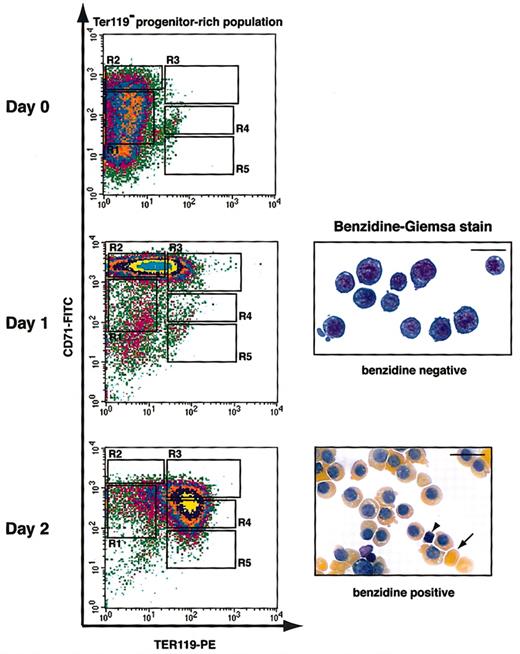
Figure 4 illustrates the erythroid-differentiation profile with the use of the best culture condition we identified. Purified TER119- cells were cultured in fibronectin-coated plates in medium with serum and Epo; Epo was removed from the medium after 1 day. After 1 day in culture, early erythroblasts (R1 and R2 cells) differentiated into R2 and R3 cells, most of which were negative for benzidine staining (Figure 4). At the end of 2 days, these cells further differentiated into R3 to R5 cells, which were all benzidine-positive (Figure 4). Many of these cells had lost their nuclei and formed reticulocytes (Figure 4). During the 2-day period, the number of erythroblasts increased 15- to 20-fold, corresponding to 4 to 5 cell divisions (data not shown). This correlates well with the number of terminal cell divisions that a CFU-E goes through to generate terminally differentiated erythrocytes.28,29 Thus, this culture condition supported both proper terminal proliferation and differentiation of CFU-E progenitors. In summary, the combination of the in vitro culture system we developed and the flow cytometry analysis of erythroid differentiation provides a novel experimental tool to study erythroid differentiation in a quantitative and step-by-step manner.
Flow cytometry analysis of fetal liver erythroblasts cultured in vitro. Fetal liver cells were stained with biotinylated anti-TER119 mAb, and TER119- progenitor-rich cells were purified. Purified TER119- cells (approximately 70% to 80% R1 and R2 cells; essentially no R3 to R5 cells) were cultured in vitro for 1 day on fibronectin-coated plates in medium containing serum and Epo. Epo was removed from culture at the end of 1 day. The differentiation profiles of cultured cells were examined by flow cytometry and benzidine-Giemsa stain. The arrowhead indicates an extruded nucleus, and the arrow indicates an enucleated reticulocyte. Scale bar: 20 μm.
Flow cytometry analysis of fetal liver erythroblasts cultured in vitro. Fetal liver cells were stained with biotinylated anti-TER119 mAb, and TER119- progenitor-rich cells were purified. Purified TER119- cells (approximately 70% to 80% R1 and R2 cells; essentially no R3 to R5 cells) were cultured in vitro for 1 day on fibronectin-coated plates in medium containing serum and Epo. Epo was removed from culture at the end of 1 day. The differentiation profiles of cultured cells were examined by flow cytometry and benzidine-Giemsa stain. The arrowhead indicates an extruded nucleus, and the arrow indicates an enucleated reticulocyte. Scale bar: 20 μm.
Oncogenic H-ras, but not dominant-negative H-ras, blocks erythroid differentiation
To study the role of Ras signaling in erythroid differentiation, we examined mouse erythroid progenitors expressing different H-ras mutants using CFU-E colony assay. H-ras mutants were expressed in purified TER119- cells with the use of a bicistronic retroviral vector (MSCV–H-ras–IRES–hCD4) that also encodes hCD4. Thus, Ras-expressing cells were labeled by their surface expression of hCD4 (hCD4+ cells); uninfected hCD4- cells served as internal controls. The titers of the different retroviruses and the expression levels of the different H-ras proteins in infected TER119- cells were very similar to each other (data not shown). Typically, a 60% to 90% infection efficiency in TER119- cells was achieved. Spin-infected TER119- cells were directly plated for CFU-E colony assay. Our results showed that oncogenic H-ras (H-ras.V12) reduced CFU-E colony formation to approximately 60% of that obtained from the control vector (Table 3). The 40% decrease of CFU-E colony number was lower than the actual infection efficiency, suggesting that oncogenic H-ras did not block CFU-E colony formation completely (as discussed in the next section). In contrast, dominant-negative H-ras (H-ras.N17) had no effect on CFU-E colony formation (Table 3; see also “Discussion”).
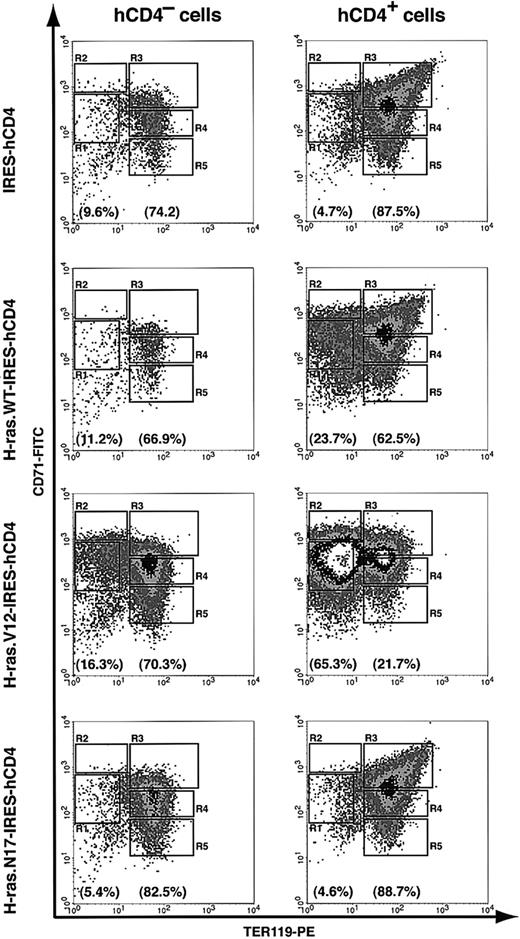
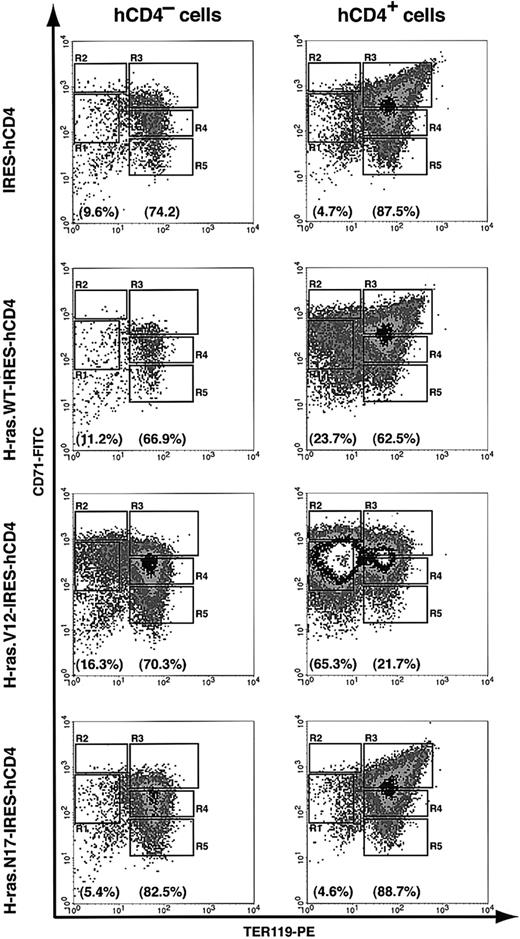
To study the cellular mechanisms underlying the colony assay result, we further analyzed erythroid-differentiation profiles in our in vitro culture system. We used uninfected hCD4- cells as internal controls. After 2 days in culture, 67% to 83% of the noninfected cells (hCD4- cells) differentiated into R3 to R5 cells (TER119+) (Figure 5). Compared with noninfected cells, erythroblasts infected with either control vector or dominant-negative H-ras (H-ras.N17) differentiated normally; approximately 88% of the infected cells were TER119+ (R3 to R5 cells) (Figure 5). Wild-type H-ras exerted a mild blocking effect on erythroid differentiation; 23.7% of infected cells remained TER119- (Figure 5). In contrast, most of the oncogenic H-ras–infected erythroblasts (hCD4+) accumulated in the R1 and R2 regions (65.3% of the infected cells; Figure 5), suggesting that oncogenic H-ras blocked terminal differentiation of CFU-E progenitors and early erythroblasts. However, the block in erythroblast differentiation by oncogenic H-ras was incomplete; 21.7% of infected cells still differentiated normally (Figure 5). The partial block of erythroid differentiation might be caused by insufficient expression level of oncogenic H-ras and/or late timing of its expression.
Blockage of erythroid differentiation by oncogenic, but not dominant-negative, H-ras. TER119- cells were purified as described in Figure 4 and infected with bicistronic retroviruses encoding hCD4 alone, H-ras wild-type (wt), oncogenic H-ras (H-ras.V12), or dominant-negative H-ras (H-ras.N17). Infected cells were cultured in vitro for 2 days as described in Figure 4, and the differentiation profiles were analyzed by flow cytometry. The left-hand panels show the density plots of all viable noninfected cells (hCD4- cells), and the right-hand panels display the density plots of all viable infected cells (hCD4+ cells) in the same culture. The percentages of TER119- cells (presented as total of R1 and R2 cells) and TER119+ cells (presented as total of R3 to R5 cells) are labeled at the bottom of each density plot.
Blockage of erythroid differentiation by oncogenic, but not dominant-negative, H-ras. TER119- cells were purified as described in Figure 4 and infected with bicistronic retroviruses encoding hCD4 alone, H-ras wild-type (wt), oncogenic H-ras (H-ras.V12), or dominant-negative H-ras (H-ras.N17). Infected cells were cultured in vitro for 2 days as described in Figure 4, and the differentiation profiles were analyzed by flow cytometry. The left-hand panels show the density plots of all viable noninfected cells (hCD4- cells), and the right-hand panels display the density plots of all viable infected cells (hCD4+ cells) in the same culture. The percentages of TER119- cells (presented as total of R1 and R2 cells) and TER119+ cells (presented as total of R3 to R5 cells) are labeled at the bottom of each density plot.
To confirm our flow cytometry analysis results, we performed benzidine-Giemsa staining. As we expected, erythroblasts expressing hCD4 only (control vector) or dominant-negative H-ras stained positive for benzidine and displayed morphologic features of terminally differentiated erythroid cells, whereas most of erythroblasts expressing oncogenic H-ras retained the larger cell size characteristic of undifferentiated cells and remained negative for benzidine staining (data not shown).
Oncogenic H-ras promotes abnormal proliferation of CFU-E progenitors and early erythroblasts
Our results suggest a block or attenuation in the capacity of oncogenic H-ras–expressing cells to undergo terminal erythroid differentiation. We further investigated the mechanism(s) underlying this phenotype. It has been reported that in human CD34+ cells expressing oncogenic N-ras, terminal erythroid differentiation is blocked because of enhanced apoptosis and reduced proliferation.15 When lethally irradiated mice were reconstituted with bone marrow cells infected with a retrovirus encoding an oncogenic N-ras, more than 60% of the mice developed myeloproliferative disorders with increased apoptosis rate.30 Therefore, we investigated whether increased apoptosis of late erythroblasts and/or abnormal proliferation of early erythroblasts accounts for the block of erythroid differentiation by oncogenic H-ras. We first measured the apoptosis rate in cultured erythroblasts by annexin V binding. Our results showed that the oncogenic H-ras construct had no significant effect on apoptosis rate (data not shown).
We then analyzed the effects of different H-ras proteins on cell cycle progression, using retroviral constructs that coexpress the GFP marker. Retrovirally transduced TER119- cells were cultured for 2 days as described, with Epo present only during the first day. Under this culture condition, most erythroblasts without transduced genes underwent terminal differentiation and became R4 and R5 cells by the end of 2 days (Figures 4, 5). To evaluate the cell cycle distribution of cultured cells, cellular chromosome DNA was saturated with Hoechst dye. As expected, more than 95% of noninfected erythroblasts (GFP-) exited the cell cycle permanently and were in G1 phase (data not shown). Erythroblasts infected with either control vector or dominant-negative H-ras (H-ras.N17) showed cell cycle distribution profiles similar to those of noninfected cells, suggesting that they did not interfere with erythroid differentiation (Table 4). In contrast, approximately 50% of erythroblasts expressing oncogenic H-ras (H-ras.V12) were in S or G2/M phase, indicating that these cells were actively proliferating and had not undergone normal erythroid differentiation (Table 4). Consistent with our flow cytometry analysis, wild-type H-ras had a mild effect on promoting erythroblast proliferation; approximately 24% of infected cells were in S or G2/M phase (Table 4).
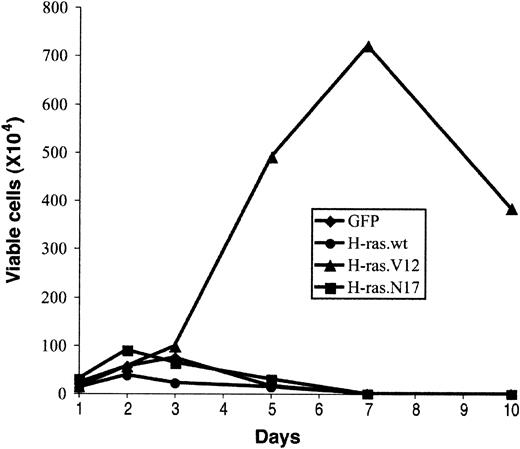
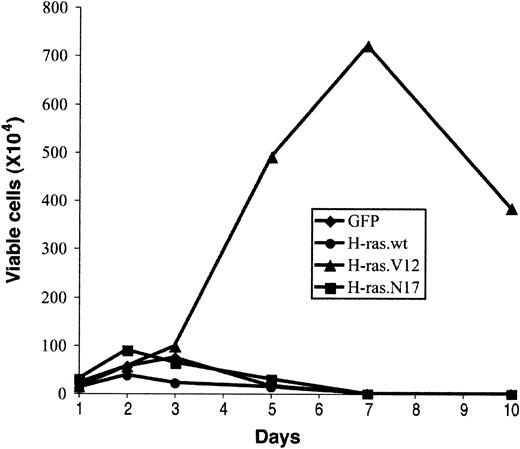
Expression of oncogenic Ras can induce growth factor–independent proliferation of several myeloma cell lines.31-33 To assess whether oncogenic H-ras supports prolonged proliferation of early erythroblasts in an Epo-independent manner, we examined the growth potential of erythroblasts expressing oncogenic H-ras in a culture medium without Epo (EDM; “Materials and methods”). We counted total viable cells in the culture, and the percentage of infected cells (GFP+) was determined by flow cytometry analysis. After 2 to 3 days in culture, the number of viable erythroblasts expressing only GFP (control vector) or H-ras.N17 started to decrease (Figure 6). Interestingly, wild-type H-ras, which displayed a mild effect on promoting erythroblast proliferation and blocking erythroid differentiation, failed to support extended growth of erythroblasts (Figure 6). After 7 days, no viable cells were detected in cultures infected with control vector, wild-type H-ras, or H-ras.N17 (Figure 6). In contrast, erythroblasts expressing oncogenic H-ras maintained active Epo-independent proliferation; the number of viable cells peaked around 7 days (Figure 6). However, these cells were not immortalized; they ceased to grow after 1 week and acquired a morphology similar to that of senescent cells (Figure 6; also data not shown). By the end of 2 weeks, no viable cells were detected. Thus, the growth potential and senescent morphology of these cells were similar to those of primary fibroblasts expressing oncogenic H-ras, suggesting that oncogenic H-ras induced cell senescence in primary erythroblasts as well.34
Effect of abnormal erythroblast growth on oncogenic ras expression. Expression of oncogenic ras induces abnormal growth of erythroblasts. Purified TER119- cells were infected with bicistronic retrovirus constructs encoding GFP alone, H-ras wild-type (wt), oncogenic H-ras (H-ras.V12), or dominant-negative H-ras (H-ras.N17) and cultured in fibronectin-coated wells as described in Figure 4. Cell numbers are presented as total viable GFP+ cells. Data are averages from triplicate cultures of 2 separate experiments and SDs were always less than 5% of the averages.
Effect of abnormal erythroblast growth on oncogenic ras expression. Expression of oncogenic ras induces abnormal growth of erythroblasts. Purified TER119- cells were infected with bicistronic retrovirus constructs encoding GFP alone, H-ras wild-type (wt), oncogenic H-ras (H-ras.V12), or dominant-negative H-ras (H-ras.N17) and cultured in fibronectin-coated wells as described in Figure 4. Cell numbers are presented as total viable GFP+ cells. Data are averages from triplicate cultures of 2 separate experiments and SDs were always less than 5% of the averages.
Discussion
An in vitro culture system that supports normal terminal proliferation and differentiation of erythroid progenitors
Analysis of the role of signaling molecules in CFU-E differentiation is generally conducted by means of CFU-E colony assays.6,16 However, CFU-E differentiation is a multistep process, and CFU-E colony assays do not allow one to monitor this process step by step. Therefore, the precise differentiation stage(s) affected by a signaling molecule cannot be identified, and the underlying cellular mechanisms cannot be studied.To overcome this limitation, we developed an in vitro culture system that supports terminal proliferation and differentiation of CFU-E progenitors and early erythroblasts. In this system, CFU-E differentiation is monitored step by step and in a quantitative manner by a flow cytometry analysis. Thus, erythroid cells at particular developmental stage(s) can be identified as the critical targets of the actions of a signaling molecule. In combination with other assays, we can begin to dissect the underlying molecular mechanisms that affect erythroid apoptosis, proliferation, and differentiation.
To find the best conditions to recapitulate CFU-E differentiation in vitro, we tested different culture conditions for their ability to support erythroid terminal differentiation. Two important factors have been shown to affect CFU-E differentiation: extracellular matrix (ECM) proteins and growth factors. Fibronectin is the only identified ECM protein that binds erythroblasts35 and plays multiple roles in erythroid differentiation.35-39 However, fibronectin has not been routinely used in culture to support terminal proliferation and differentiation of erythroid progenitors. We cultured purified TER119- cells in fibronectin-coated plates and found that fibronectin indeed greatly improved the survival and proliferation of early erythroblasts (data not shown). Since other or yet-unknown ECM proteins may be required to promote proper CFU-E differentiation, we cocultured purified TER119- cells with stromal cells purified from mouse fetal livers. However, purified stromal cells did not support erythroid proliferation and differentiation better than did fibronectin (data not shown).
Concerning growth factors, transforming growth factor–β1 (TGF-β1) has been shown to induce or accelerate erythroid differentiation in human cord blood CD34+ cells.40,41 However, we did not observe a significant effect of TGF-β1 on erythroid differentiation even when we added 25 ng/mL TGF-β1 to the culture (data not shown). The differentiation process from CFU-E progenitors to late basophilic erythroblasts is Epo dependent, whereas the steps after that are Epo independent.7 Under conventional culture conditions, in vitro erythroid differentiation occurs in the constant presence of Epo. We found that under this condition erythroblasts did up-regulate their hemoglobin level and extrude their nuclei. However, the level of CD71 surface expression remained high on the differentiated erythroid cells (data not shown). This observation is consistent with a previous report; when erythroid differentiation was induced in the constant presence of Epo in an in vitro differentiation system, CD71 expression was maintained during all stages of erythroid differentiation.42 This differentiation profile is different from that of primary erythroblasts in vivo, in which late erythroblasts have lower levels of the transferrin receptor (TfR) (or CD71) (Figures 2, 3; Table 3). This suggests that the differentiation process resulting from conventional culture conditions does not mimic erythroid differentiation in vivo. We therefore removed Epo from the culture medium on day 1 and found that erythroid differentiation was better coupled with down-regulation of CD71 expression (Figure 4).
The role of Ras and other signal transduction pathways in terminal erythroid proliferation and differentiation
In CFU-Es and early erythroblasts, Epo binding to the EpoR activates several downstream signaling pathways, including the Stat5–BclxL pathway, the phosphatidylinositol-3 (PI3) kinase–AKT pathway, and the Ras–mitogen-activated protein kinase (Ras-MAPK) pathways.8-10 We have previously shown that the Stat5-BclxL pathway is important for the survival of early, CD71highTER119high erythroblasts.18,43 In mice, deletion of both Stat5a and Stat5b leads to embryonic and adult anemia and significant increase in apoptosis of early erythroblasts.18,43-45
The PI3 kinase–AKT pathway downstream of the EpoR induces other important antiapoptotic signals. The F7Y479 EpoR mutant, in which all cytosolic tyrosines but Y479 are mutated to phenylalanine, activates PI3 kinase but not the Stat5-BclxL pathway and supports both proliferation and differentiation of erythroid cells to the same extent as the wild-type EpoR.46 The antiapoptotic function of PI3 kinase–AKT pathway might be through the phosphorylation and cytoplasmic relocalization of the proapoptotic forkhead rhabdomyosarcoma-like (FKHRL-1) transcription factor.47,48 The cytoplasmic relocalization of FKHRL-1 subsequently shuts down the transcription of tumor necrosis factor–related apoptosis-inducing ligand (TRAIL), a potent apoptosis inducer.48
The Ras-MAPK pathway is activated through the canonical growth factor receptor–bound protein 2 (Grb2)–binding site at phosphorylated Y464 of the EpoR.49 However, its role in the EpoR signaling and in CFU-E differentiation is confusing on the basis of experiments using erythroid and nonerythroid cell lines and CFU-E colony assays.16,49-51 In preliminary studies, we investigated this by culturing H-ras.N17 (dominant-negative H-ras)–infected TER119- fetal liver cells in suspension with IL-3, IL-6, and SCF for 1 or 2 days. Then we added Epo to induce terminal erythroid differentiation. Judging by our flow cytometry analysis, we did not observe any qualitative or quantitative difference between cells infected with control vector or dominant-negative H-ras (data not shown). These results, together with those of Figure 5, indicate that dominant-negative H-ras (H-ras.N17) has no obvious effect on terminal erythroid differentiation, suggesting that under normal physiologic conditions H-ras signaling is not crucial for EpoR signaling. This result is consistent with a report that H-ras knockout mice do not show any impairment in erythropoiesis.52
Effects of oncogenic Ras on erythroid progenitors
We identified the CFU-E progenitors (CD71medTER119low) and early erythroblasts (CD71highTER119low) as the principal targets of oncogenic H-ras. These cells express a high level of EpoR and are Epo dependent (Table 2). Our results suggest that constitutive Ras signaling blocks erythroid differentiation induced by EpoR signaling (Figure 5; also data not shown). When CFU-E progenitors and early erythroblasts were infected with oncogenic H-ras and directly cultured in medium with Epo, Epo-induced up-regulation of CD71 appeared normal on day 1 (data not shown). This might be due to the delayed expression of oncogenic H-ras. On day 2, erythroid differentiation was blocked; most cells that had differentiated into R2 and R3 regions on day 1 appeared to reside in the R1 and R2 regions on day 2 (Figure 5). This block in erythroid differentiation was measured by flow cytometry analysis and impaired hemoglobinization (Figure 5; also data not shown). Despite their large cell size, comparable to those of the R1 and R2 cells, the morphology of these cells was abnormal (data not shown). These data suggest that even when EpoR signaling initiates normal erythroid differentiation, it can still be disrupted by oncogenic H-ras signaling. We noticed that under this condition the block was incomplete; approximately 25% of the oncogenic Ras–infected erythroblasts still underwent normal terminal differentiation (Figure 5). Delays in expression of the oncogenic Ras or low levels of its expression in certain cells might account for this incomplete block.
Previously, it was shown that oncogenic Ras inhibited erythroid terminal differentiation in primary human CD34+ cells by blocking cell proliferation and promoting apoptosis.15 However, when introduced into erythroleukemia cells, oncogenic Ras was found to impair erythroid differentiation and support extended proliferation.53 In our system, we observed a phenotype similar to that of Zaker et al,53 in that oncogenic Ras blocked erythroid differentiation without affecting apoptosis. Moreover, the oncogenic Ras–infected erythroblasts underwent prolonged Epo-independent proliferation (Figure 5; Table 4). The abnormal growth lasted only about 7 days; thus, oncogenic H-ras was unable to immortalize these erythroid progenitors. This is not surprising since oncogenic H-ras is known to provoke premature cell senescence in primary mouse fibroblasts.34 This might also explain the results Darley et al15 obtained in human primary CD34+ cells, which usually take a much longer time to differentiate (7 days).
Mutations within Ras genes that lead to constitutively active/oncogenic forms of Ras are highly associated with myeloid disorders, including acute myeloid leukemia (AML) and MDS.54,55 These Ras mutations occur predominantly in the N-ras gene.56 We found that overexpression of oncogenic N-ras has similar effects as the overexpression of oncogenic H-ras: blocking terminal erythroid differentiation and promoting abnormal proliferation of CFU-Es and early erythroblasts (data not shown). This might explain, at least partially, the common anemia phenotype in patients with hematopoietic malignancies.
In conclusion, we developed an in vitro culture system that supports normal terminal erythroid proliferation and differentiation. In this system, terminal erythroid differentiation is monitored progressively and quantitatively by a flow cytometry analysis. Thus, the primary target cells affected by a particular signaling molecule can be identified, and the underlying cellular mechanisms can be studied. Potentially, this system can be used to study the functions of various signaling molecules in erythroid differentiation. Using this system, we introduced oncogenic H-ras into early erythroblasts and studied its effect on erythroid differentiation. We found that oncogenic H-ras blocks normal erythroid differentiation and confers prolonged Epo-independent proliferation of erythroblasts. We are in the process of dissecting how the several signaling pathways downstream of Ras contribute to the abnormal cell proliferation caused by oncogenic H-ras.
Prepublished online as Blood First Edition Paper, August 7, 2003; DOI 10.1182/blood-2003-05-1479.
Supported by National Institutes of Health/National Heart, Lung, and Blood Institute (NIH/NHLBI) PO1 grant HL 32262 (H.F.L.); a Howard Temin Award from the National Cancer Institute (M.S.); and a Fellow Grant from the Leukemia & Lymphoma Society (Z.J.).
The publication costs of this article were defrayed in part by page charge payment. Therefore, and solely to indicate this fact, this article is hereby marked “advertisement” in accordance with 18 U.S.C. section 1734.
We thank Drs Qiang Chang and Lily Jun-shen Huang for helpful discussion and critical comments on the manuscript, Glen Pardis for help with flow cytometry, and Dr Takaya Sato (Kobe University, Kobe, Japan) for permission to use the H-ras constructs.

