Abstract
The p53 system is highly stress sensitive and integrates diverse intracellular signals in a complex and poorly defined manner. We report on the high dependence of stress-induced p53 activation on mitochondrial activity. Down-regulation of mitochondrial transmembrane potential (MTMP) by inhibitors of electron transport (rotenone, thenoyltrifluoroacetone (TTFA)) and adenosine triphosphate (ATP) synthesis (oligomycin) prevented stress-induced p53 protein accumulation and abrogated p53-dependent apoptosis in a wild-type p53 leukemia cell line MOLT-3, in primary leukemia cells and in normal T lymphocytes. Using genome-wide gene expression analysis, stress-induced up-regulation of the p53 transcriptional targets and their specific inhibition by oligomycin has been demonstrated. Oligomycin did not impair p53-independent apoptosis and caused only a slight reduction of intracellular ATP levels. Reactive oxygen species (ROS) localized to mitochondria decreased in the presence of oligomycin, and stress-induced p53 activation showed strong ROS sensitivity both in leukemic and normal cells. These observations identify mitochondrial activity, described by MTMP and ROS levels, as a critical intracellular determinant of the p53 stress sensitivity and suggest potential implications of this linkage in the mechanisms of chemoresistance of acute leukemia cells. (Blood. 2005;105:4767-4775)
Introduction
Sublethal damage or impairment of cellular functions result in cellular responses, which include activation of repair mechanisms, cell-cycle checkpoints, and induction of endogenous apoptotic programs. Cellular stress response often implicates activation of the proapoptotic p53-dependent machinery, which determines the threshold level of cellular stress able to trigger apoptosis.1,2 p53 is regulated mainly at the posttranscriptional level and its protein level in the absence of stress is consistently low due to a high rate of p53 protein degradation via the proteasome pathway. Stress-induced signaling results in modification of the p53 protein either by phosphorylation or acetylation and in the resistance of p53 to proteasome degradation.3,4 A further basic regulatory mechanism of the p53 system is the interaction of p53 with its negative regulator Mdm2 protein, which acts as a p53-specific E3 ligase and is, in turn, transcriptionally regulated by p53.5 The importance of p53/Mdm2 interactions is underscored by the variety of mechanisms used by a cell to disrupt these interactions in response to stress, including posttranslational modifications, subcellular redistribution, inhibition of Mdm2 activity, and its transcription.5 More recently, nicotinamide adenine dinucleotide phosphate (NADH) quinone oxidoreductase 1 (NQO1) was demonstrated to regulate p53 stability.6 NQO1 was suggested to interact physically with p53 and to stabilize p53 through Mdm2-independent mechanisms.7,8
Intracellular p53 accumulation is the hallmark of the p53 activation pathway and results in p53 protein complexation, nuclear localization of p53 tetramers, and induction of their transcriptional activity. The resulting complex pattern of p53 target genes depends on stress conditions and cell type context, as indicated by gene profiling using oligonucleotide microarrays.9 The broad spectrum of p53 transcriptional targets indicates the interference of p53 stress-signaling with multiple cellular functions.10 The list of targets includes genes encoding for proteins critically involved in cell-cycle regulation (p21, GADD45A), apoptosis (Bax, PUMA, CD95, TRAIL), and the intracellular redox state (PIG3, PIG12).9-12
The mitochondrion plays a dual role in the cell as a regulator of apoptosis and as a cellular powerhouse, and multiple mitochondrial components are involved both in the regulatory processes of energy metabolism and in stress-induced apoptosis signaling.13,14 The molecular mechanism of mitochondrial energy transformation involves the electron transport chain, which consists of electron transfer complexes I-IV embedded in the inner mitochondrial membrane. The electron transport chain serves to convert the high energy potential of electrons from NADH and FADH2 molecules into the energy of the proton gradient across the inner membrane, defined as the mitochondrial transmembrane potential, MTMP (DeltaPsiM; ψm). The MTMP level is proportional to the number of protons pumped to the outer side of the inner mitochondrial membrane during electron transport and reflects the mitochondrial activity of the cell. It is the free energy of the proton gradient that finally drives the synthesis of ATP from adenosine diphosphate (ADP) and phosphate, occurring at the site of ATP synthase (complex V, F0/F1-ATPase).14 Mitochondrial activity critically contributes to the intracellular redox state as the major source of reactive oxygen species, ROS, which are generated as a result of occasional escape of electrons from the electron transport chain.15,16
In p53-dependent proapoptotic signaling, the key events leading to activation of caspases and apoptotic cell death are the permeabilization of the outer mitochondrial membrane and subsequent release of apoptogenic factors, especially of mitochondrial cytochrome c.17,18 Mitochondrial permeabilization is preceded by a complex decision phase, which involves integration of pro- and antiapoptotic signals and converges on the Bcl-2 family of proteins.18,19 Several genes encoding for proapoptotic Bcl-2 related proteins, including Bax and PUMA, are direct transcriptional targets of p53.20,21 It has recently been proposed that there is direct cooperation between Bax and mitochondrial ATP synthase during the process of mitochondrial cytochrome c release.22 Mitochondria are further involved critically at the later stages of apoptosis, and mitochondrial dysfunction defines the irreversible stage of apoptosis, characterized by MTMP loss, redox shift, and increase of intracellular ROS levels.23
Mitochondrial involvement in proapoptotic p53 signaling has been largely investigated downstream of p53 activation in cellular systems overexpressing either wild-type (wt) or temperature-sensitive mutant p53.17,22 Here we address the contribution of mitochondrial components to the early stress signaling upstream of p53 activation. To this end, we have investigated cellular systems with endogenously expressed wt p53, including normal T lymphocytes and a wt p53 leukemia MOLT-3 cell line.24-26 We also focused on primary cells from patients with acute leukemia at diagnosis, in which p53 mutations are infrequent.27-29 The results demonstrate that there is a strong dependence of stress-induced p53 activation on mitochondrial activity, which suggests that mitochondrial status is implicated in the mechanisms of chemoresistance in acute leukemia cells.
Materials and methods
Cells
Primary leukemia and normal cells were purified either from bone marrow (BM) and peripheral blood (PB) samples from pediatric acute lymphoblastic leukemia (ALL) patients or from PB of healthy donors by Ficoll-Hypaque density gradient centrifugation. The viability of cells was always more than 90% as determined by trypan blue or propidium iodide (PI; Sigma-Aldrich, Taufkirchen, Germany) exclusion. ALL samples contained more than 85% leukemic cells based on morphologic and immunophenotypic criteria. The ALL patients were enrolled in the multicenter ALL-BFM study and gave informed consent.
The human leukemia cell line MOLT-3 was obtained from the DSM Cell Culture Bank (Braunschweig, Germany). p53 gene status in MOLT-3 cells has been analyzed previously by a single-strand conformation polymorphism-polymerase chain reaction (SSCP-PCR) analysis.24
Cell culture and treatment
Cells were maintained in RPMI 1640 standard medium containing 2 mg/mL glucose and supplemented with 10% heat-inactivated fetal calf serum (Gibco Invitrogen, Karlsruhe, Germany) at 37°C in a humidified atmosphere of 5% CO2 in air. For ATP depletion assays, cells were washed and resuspended in glucose-free RPMI 1640 medium (Gibco Invitrogen).
To stimulate normal T cells, PB lymphocytes from healthy donors were incubated in the presence of 2.5 μg/mL phytohemagglutinin (PHA; Roche, Mannheim, Germany) and 60 U/mL of recombinant human interleukin-2 (IL-2; Strathmann Biotec, Hamburg, Germany) for 24, 48, and 72 hours. Control experiments showed that PB cell samples, incubated for 24 hours and longer, contained more than 90% of T cells.
To assess drug effects, 0.2 × 10⁶ of MOLT-3 cells/well or 0.5 × 10⁶ of primary cells/well were cultured in the presence or absence of drugs in 24-well or 96-well microtiter plates (Nunc, Wiesbaden, Germany), respectively. For short-time assays (< 6 hours) cells were preincubated for 2 hours or overnight.
Reagents
Mitochondrial inhibitors, purchased from Sigma, included the electron transport chain inhibitors rotenone (complex I inhibitor), thenoyltrifluoroacetone (TTFA; complex II inhibitor) and antimycin A (complex III inhibitor), an uncoupler of oxidative phosphorylation carbonyl cyanide p-(trifluoromethoxy)phenyl hydrazone (FCCP), and an inhibitor of ATP synthase, oligomycin.
Cellular stress/apoptosis was generated using doxorubicin (Pharmacia, Erlangen, Germany), etoposide (Sigma), lactacystin (Sigma), staurosporine (Merck, Schwalbach, Germany), and H2O2 (Sigma).
Death receptor-mediated apoptosis was induced by agonistic CD95 antibody (0.1 μg/mL; clone CH-11, Beckman Coulter, Marseille, France).
The antioxidant N-acetyl-l-cysteine (NAC) and the nonmetabolizable glucose analog 2-deoxy-d-glucose (2-DG) were purchased from Sigma.
Flow cytometry
Flow cytometric measurements were performed using FACScan flow cytometer (Becton Dickinson, San Jose, CA). Flow cytometric data were analyzed using either CellQuest Pro software (Becton Dickinson) or Cytomics RXP software (Beckman Coulter, Miami, FL). The CellQuest and RXP software use the same scaling of fluorescence (log scale, 4 decades) but different ranges (101-104 and 10-1 and 103). To avoid confusion, the channel numbers on dot plots or histograms have not been depicted in the Figures.
Assessment of mitochondrial transmembrane potential
To measure the mitochondrial potential (MTMP), cells were incubated with J-aggregate forming cationic dye JC-1 (Molecular Probes, Karlsruhe, Germany) at a concentration of 10 μg/mL for 10 minutes at 37°C. JC-1 fluorescence was detected by a FACScan flow cytometer.
Detection of apoptotic events
To detect activated caspase-3, cells were fixed and permeabilized using the fixation-permeabilization kit (Fix & Perm; Caltag, Hamburg, Germany) and stained with phycoerythrin (PE)-conjugated purified rabbit antiserum specific for activated caspase 3 (557091; BD Pharmingen, Hamburg, Germany), as described previously.30
To detect apoptotic cells by plasma membrane changes, cells were stained with fluoroscein isothiocyanate (FITC)-conjugated annexin V and PI using the annexin V kit (Caltag) as previously described.31 Thereafter, samples were analyzed by flow cytometry (FACScan) for the presence of viable (annexin V- and PI-), early apoptotic (annexin V+, PI-), and late apoptotic/necrotic (annexin V+ and PI+) cells.
Quantification of p53 by flow cytometry
To assess p53 accumulation, cell preparation (fixation and permeabilization using 1% paraformaldehyde and 100% methanol) and cell staining using anti-p53 monoclonal mouse antibodies (clone DO-1; Merck) were performed according to Bonsing et al.32 Antigen expression, defined as the difference between the p53-specific and isotype control fluorescences, was quantified by flow cytometry in molecules of equivalent soluble fluorochrome (MESF) units using calibration beads (DAKO FluoroSpheres; DAKO, Glostrup, Denmark) as fluorescence standards. To obtain fluorescence intensities in MESF units, calibration beads (with known numbers of fluorochrome molecules, ie, MESF values per bead) were measured with fluorescence-activated cell sorting (FACS) and a calibration curve was constructed. Thereafter, experimental samples were measured at identical FACS settings and MESF values were calculated using the calibration curve.
ROS detection
Hydroethidine (HE), dihydrofluorescein-diacetate (DCFDA), and nonyl acridine orange (NAO) were purchased from Molecular Probes.
To detect ROS, cells were incubated with HE and DCFDA for 30 minutes at 37°C at final concentrations of 10 μM and 5 μM, respectively. NAO staining was performed by incubating cells for 15 minutes at 37°C at final concentration of 0.25 μM.
Assessment of intracellular ATP
Intracellular ATP was detected using a luminescence ATP detection assay system (ATPlite; PerkinElmer, Rodgau-Jügesheim, Germany). Cells were treated according to the manufacturer's instructions, and luminescence was measured using the Microlumat LB96P luminometer (EG&G Berthold, Bad Wildbad, Germany).
Gene expression analysis by DNA microarrays
MOLT-3 cells were lysed in recombinant lymphotoxin (RLT) buffer (Qiagen, Hilden, Germany). Total RNA was extracted using the Qiagen RNeasy Mini Kit including QIAshredder homogenizer and DNase I on-column digest. Biotin-labeled cRNA (BioArray High Yield RNA Transcription kit; Enzo Diagnostics, Farmingdale, NY) was hybridized to the Affymetrix HG Focus Array (Affymetrix, Santa Clara, CA). GeneChips were stained with a biotinylated antistreptavidin antibody and a streptavidin-PE conjugate for further signal amplification. Microarrays were scanned by the GeneChip System confocal scanner (Hewlett-Packard, Santa Clara, CA). Normalized gene expression values were generated by global scaling methods to a target value of 200 using the Microarray Suite Version 5.0 software (Affymetrix). Normalized data were exported to the SPSS Version 12.0 statistical software (Chicago, IL) for ranking and filtering genes.
Statistical analysis
All experiments were performed in triplicate. Mean values are given as mean ± standard deviation (SD). Differences (P) were evaluated using the 2-tailed nonparametric Mann-Whitney test for continuous variables (t test) and Fisher exact test for categorical variables. Associations of continuous variables were evaluated using bivariate nonparametric Spearman correlation statistics. Differences were considered significant for P values less than .05. Statistical analysis was performed using the SPSS software.
Results
Inhibitors of oxidative phosphorylation down-regulate MTMP, prevent early accumulation of p53, and abrogate etoposide-induced apoptosis
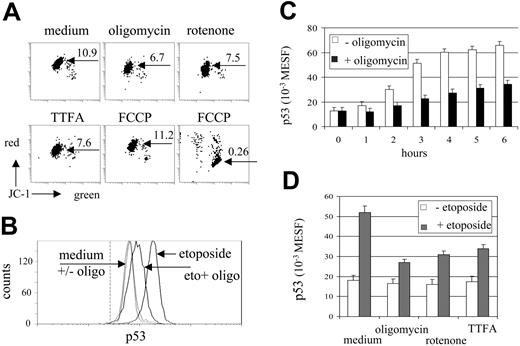
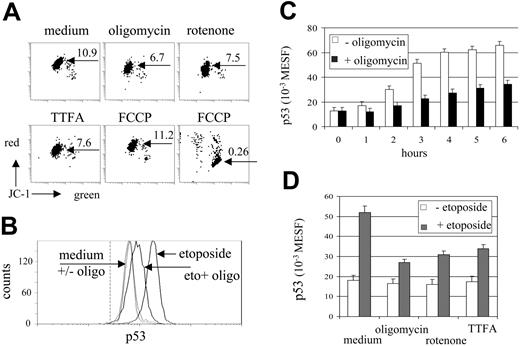
The effect of mitochondrial inhibitors on mitochondrial activity was investigated by analysis of MTMP changes in MOLT-3 cells. MTMP was assessed by staining of cells with the potentiometric dye JC-1. In aggregated form, JC-1 fluorescence shifts from green to red and thus provides a relative measure of MTMP, which can be quantified in arbitrary units by the intensity of red fluorescence or by the red-green fluorescence ratio.33 In our experimental setting both modes of MTMP quantification, red-green ratio (Figure 1A) or red fluorescence (not shown), provided similar results on modulation of MTMP levels by mitochondrial inhibitors in MOLT-3 cells. Rotenone (complex I), TTFA (complex II), and oligomycin (complex V, ATP synthase) effectively down-regulated MTMP (Figure 1A). Antimycin A (complex III inhibitor) and the electron transport uncoupler FCCP, however, either caused MTMP loss and cell death or, at lower concentrations, did not affect MTMP (Figure 1A and not shown).
Under etoposide treatment, MOLT-3 cells responded by accumulation of p53 (Figure 1B), which became detectable after 1 hour (P < .05, t test; Figure 1C). Oligomycin (10 μg/mL) effectively inhibited accumulation of p53 (Figure 1C). Rotenone (0.04 mM) and TTFA (0.2 mM) also prevented drug-induced increase of p53 protein levels (Figure 1D). When used without etoposide, oligomycin and rotenone caused a slight reduction of basal levels of the p53 protein (P > .05, t test not significant, Figure 1D).
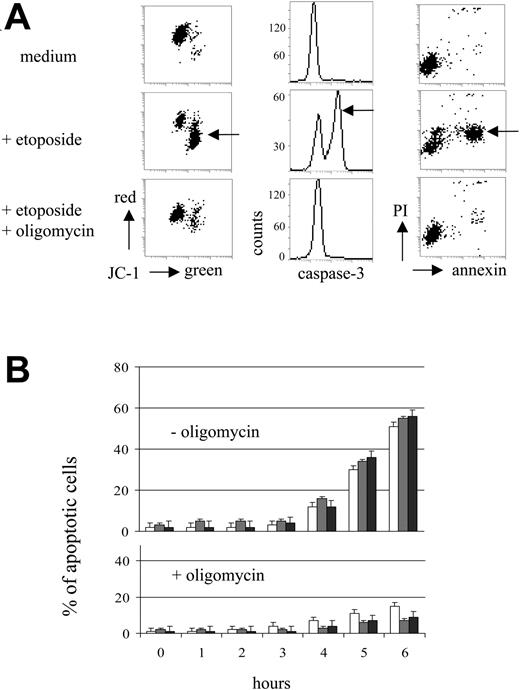
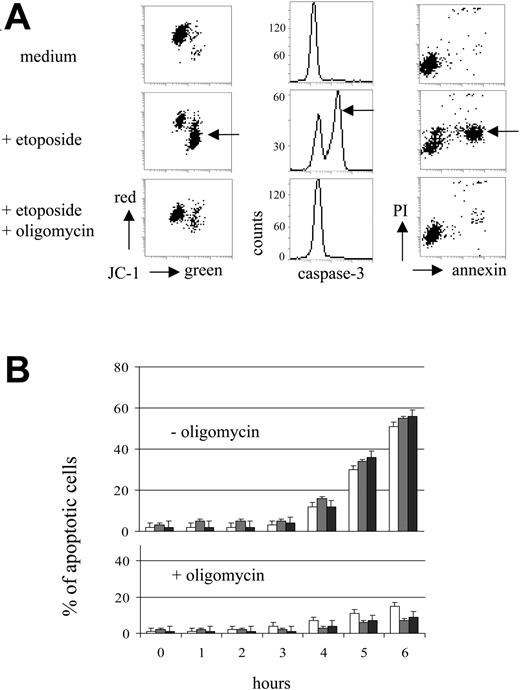
The apoptotic cascade in MOLT-3 cells was investigated at the mitochondrial, caspase-3, and plasma membrane levels (Figure 2A). Upon etoposide treatment, apoptotic changes become detectable after 4 hours of incubation (P < .01, t test; Figure 2B). Oligomycin was a highly effective inhibitor of apoptosis and almost totally abrogated the apoptotic cascade without induction of necrosis (Figure 2A-B). Rotenone (0.04 mM) and TTFA (0.2 mM) were also able to prevent etoposide-induced apoptosis, but revealed cytotoxicity after 6 hours of incubation (reduction of cell viability by 18% and 20%, respectively). By contrast, oligomycin (10 μg/mL) did not impair viability of MOLT-3 cells for at least 8 hours of incubation (data not shown).
Moderate reduction of intracellular ATP levels does not impair p53-dependent drug response
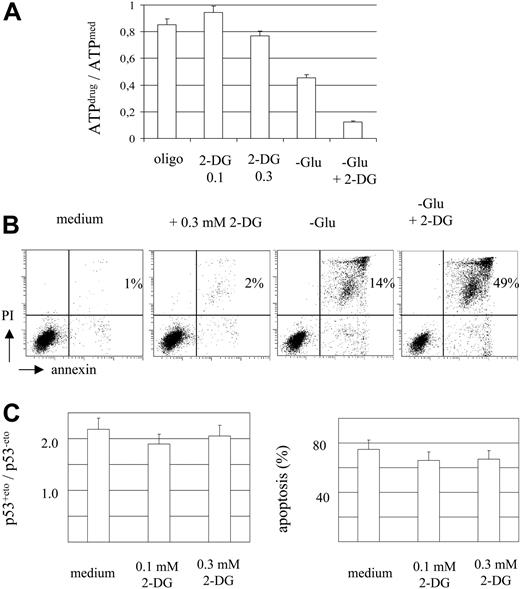
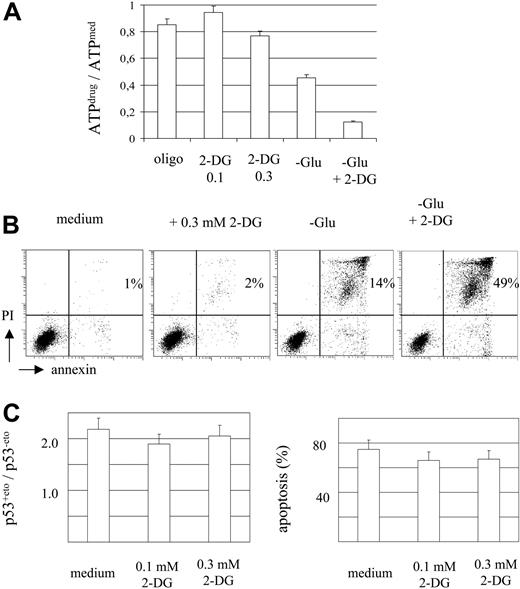
As oligomycin inhibits ATP production by oxidative phosphorylation, we investigated changes of intracellular ATP levels in the presence of oligomycin and their contribution to the observed interference with p53 signaling. The luminometric quantification of ATP in MOLT-3 cells revealed reduction of intracellular ATP levels by 15% in the presence of oligomycin (10 μg/mL) compared with MOLT-3 cells cultured in standard medium (P < .01, t test; Figure 3A).
Inhibitors of oxidative phosphorylation down-regulate MTMP and prevent etoposide-induced accumulation of p53. (A) MOLT-3 cells were incubated with oligomycin (10 μg/mL), rotenone (0.04 mM), TTFA (0.2 mM) and FCCP (1 and 5 μM, left and right dot plots, respectively) for 3 hours and assessed for MTMP levels by JC-1 (red-green fluorescence ratios indicated; x- and y-axes show 4-decade log scale). (B) Flow cytometric detection of p53 protein levels in MOLT-3 cells cultured for 3 hours in the presence of etoposide (1 μM) and/or oligomycin (10 μg/mL) (x-axis shows fluorescence intensity, 4-decade log scale). The dotted vertical line indicates the peak position of the isotype control. (C) Kinetics of p53 accumulation in MOLT-3 cells incubated with etoposide with or without oligomycin (10 μg/mL). (D) Inhibition of etoposide-induced p53 accumulation in MOLT-3 cells by mitochondrial inhibitors (10 μg/mL, 0.04 mM, 0.2 mM of oligomycin, rotenone and TTFA, respectively). MOLT-3 cells were incubated with or without etoposide (1 μM) for 3 hours.
Inhibitors of oxidative phosphorylation down-regulate MTMP and prevent etoposide-induced accumulation of p53. (A) MOLT-3 cells were incubated with oligomycin (10 μg/mL), rotenone (0.04 mM), TTFA (0.2 mM) and FCCP (1 and 5 μM, left and right dot plots, respectively) for 3 hours and assessed for MTMP levels by JC-1 (red-green fluorescence ratios indicated; x- and y-axes show 4-decade log scale). (B) Flow cytometric detection of p53 protein levels in MOLT-3 cells cultured for 3 hours in the presence of etoposide (1 μM) and/or oligomycin (10 μg/mL) (x-axis shows fluorescence intensity, 4-decade log scale). The dotted vertical line indicates the peak position of the isotype control. (C) Kinetics of p53 accumulation in MOLT-3 cells incubated with etoposide with or without oligomycin (10 μg/mL). (D) Inhibition of etoposide-induced p53 accumulation in MOLT-3 cells by mitochondrial inhibitors (10 μg/mL, 0.04 mM, 0.2 mM of oligomycin, rotenone and TTFA, respectively). MOLT-3 cells were incubated with or without etoposide (1 μM) for 3 hours.
In order to investigate the contribution of ATP reduction to cellular drug response, we modulated intracellular ATP levels by addition of the glucose antimetabolite 2-DG. A moderate reduction of ATP levels was achieved by addition of 0.3 mM 2-DG to the standard culture medium (77% of the control level; Figure 3A). Incubation of MOLT-3 cells in a glucose- and serum-free medium decreased ATP levels by more than 50%. Addition of 1 mM 2-DG to the glucose- and serum-free medium caused a severe depletion of ATP (Figure 3A).
Oligomycin abrogates drug-induced apoptosis in MOLT-3 cells. (A) Cascade of apoptotic events (indicated by arrows) as characterized by MTMP loss (JC-1 staining), activation of caspase-3 (immunofluorescence), and annexin V staining (annexin V/PI test) (JC-1, caspase-3, annexin V and PI fluorescence: 4-decade log scaling). MOLT-3 cells were incubated with etoposide (1 μM) and oligomycin (10 μg/mL) for 6 hours. (B) Kinetics of apoptotic events in MOLT-3 cells incubated with etoposide (1 μM) with or without oligomycin (10 μg/mL). □ indicates MTMP loss; □ indicates act. Caspase-3; ▪ indicates annexin V+.
Oligomycin abrogates drug-induced apoptosis in MOLT-3 cells. (A) Cascade of apoptotic events (indicated by arrows) as characterized by MTMP loss (JC-1 staining), activation of caspase-3 (immunofluorescence), and annexin V staining (annexin V/PI test) (JC-1, caspase-3, annexin V and PI fluorescence: 4-decade log scaling). MOLT-3 cells were incubated with etoposide (1 μM) and oligomycin (10 μg/mL) for 6 hours. (B) Kinetics of apoptotic events in MOLT-3 cells incubated with etoposide (1 μM) with or without oligomycin (10 μg/mL). □ indicates MTMP loss; □ indicates act. Caspase-3; ▪ indicates annexin V+.
ATP depletion in MOLT-3 cells resulted in cell death by necrosis as evidenced by the appearance of the annexin V+ and PI+ cell fraction (Figure 3B). In contrast, a moderate reduction of ATP level in the presence of 0.3 mM 2-DG did not affect cell viability (Figure 3B).
Basal levels of p53 in the presence of 0.1 and 0.3 mM 2-DG decreased by 5% (statistically not significant) and 22% (P < .01, t test), respectively. However, 2-DG at 0.1 mM and 0.3 mM (Figure 3C) was not able to prevent etoposide-induced p53 accumulation. Moreover, 2-DG did not significantly affect drug-induced apoptosis (Figure 3C). It is of note that MTMP levels did not change in the presence of 0.1-0.3 mM 2-DG (data not shown).
Moderate intracellular ATP reduction does not impair MOLT-3 cell viability and drug response. (A-B) MOLT-3 cells were incubated for 3 hours in standard medium, with oligomycin (10 μg/mL), 2-DG (0.1 mM and 0.3 mM), and in glucose- and serum-free medium (-Glu) in the absence or presence of 1 mM 2-DG. Cells were assessed for intracellular ATP levels using luminometric assay (A) and for apoptosis and necrosis (B) (annexin V/PI staining, percentages of necrotic cells in the upper right quadrant are indicated). (C) MOLT-3 cells were incubated with etoposide (1 μM) in standard medium in the absence or presence of 0.1 mM or 0.3 mM 2-DG. Cells were assessed for p53 protein levels after 3 hours of incubation and for apoptosis (annexin/PI staining) after 6 hours of incubation.
Moderate intracellular ATP reduction does not impair MOLT-3 cell viability and drug response. (A-B) MOLT-3 cells were incubated for 3 hours in standard medium, with oligomycin (10 μg/mL), 2-DG (0.1 mM and 0.3 mM), and in glucose- and serum-free medium (-Glu) in the absence or presence of 1 mM 2-DG. Cells were assessed for intracellular ATP levels using luminometric assay (A) and for apoptosis and necrosis (B) (annexin V/PI staining, percentages of necrotic cells in the upper right quadrant are indicated). (C) MOLT-3 cells were incubated with etoposide (1 μM) in standard medium in the absence or presence of 0.1 mM or 0.3 mM 2-DG. Cells were assessed for p53 protein levels after 3 hours of incubation and for apoptosis (annexin/PI staining) after 6 hours of incubation.
Oligomycin does not affect p53-independent apoptosis signaling
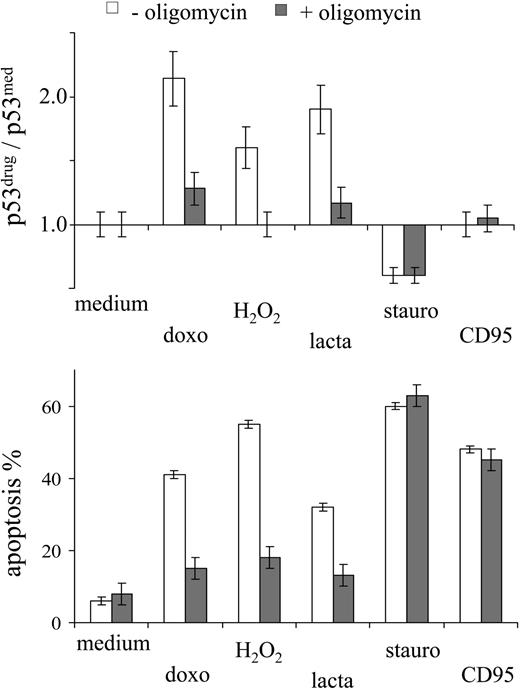
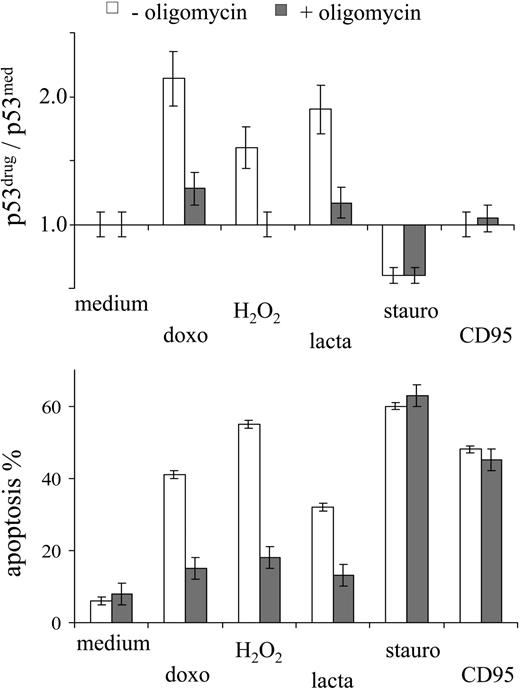
The effect of oligomycin on drug-induced apoptosis was investigated further in the context of different stress factors able to induce apoptosis. p53 accumulation in MOLT-3 cells was observed in response to DNA damage (doxorubicin), exogeneous oxidative stress (H2O2), and proteasome inhibition (lactacystin) (Figure 4). In all these cases, oligomycin prevented p53 accumulation and drug-induced apoptosis (Figure 4). By contrast, inhibition of the protein kinase C (staurosporine34 ) or triggering of the CD95 death receptor pathway (agonistic CD95 antibodies) did not engage the p53 system, and oligomycin did not affect the resulting apoptotic cell death (Figure 4). These observations suggest a specific link between mitochondrial activity and proapoptotic p53 signaling.
Oligomycin does not affect p53-independent apoptosis signaling. MOLT-3 cells were incubated in the presence or absence of oligomycin (10 μg/mL) with different apoptosis-inducing agents (1 μM doxorubicin, 30 μM H2O2, 2 μM lactacystin, 0.5 μM staurosporine, 0.1 μg/mL CD95) and assessed for intracellular p53 protein levels and apoptosis (by annexin/PI staining) after 3 hours and 6 hours of incubation, respectively.
Oligomycin does not affect p53-independent apoptosis signaling. MOLT-3 cells were incubated in the presence or absence of oligomycin (10 μg/mL) with different apoptosis-inducing agents (1 μM doxorubicin, 30 μM H2O2, 2 μM lactacystin, 0.5 μM staurosporine, 0.1 μg/mL CD95) and assessed for intracellular p53 protein levels and apoptosis (by annexin/PI staining) after 3 hours and 6 hours of incubation, respectively.
Gene expression profiling of drug- and oligomycin-treated MOLT-3 cells
Gene expression at the mRNA level in drug-stressed cells and its modulation by oligomycin was investigated by the DNA microarray technique using a Focus Affymetrix DNA chip, which harbors 8800 cDNA probe sets encoding known proteins. The quality of cRNA preparation and hybridization in all samples met minimum requirements, such as the 3′-5′ ratio (< 3), background noise (< 100), and percentage of positive calls (> 45%). Comparative analysis of MOLT-3 cells, either untreated (medium) or treated with etoposide and doxorubicin, in the presence and absence of oligomycin, identified a limited number of gene transcripts, whose levels changed by threefold or greater in at least one treated versus untreated sample (44 genes up-regulated, 29 genes down-regulated; data not shown). A list of genes, which changed their expression by at least threefold in at least 2 treated samples, is summarized in Table 1. Many of these genes have been described as p53 transcriptional targets, involved in the processes of cell-cycle regulation (p2135 ), cellular redox state (FDXR36 ), and DNA repair (GADDs, DDB237,38 ). Of the proapoptotic p53 targets, BAX and BIK,39 the up-regulation of BIK was particularly strong. In all these cases, oligomycin counteracted the up-regulation of p53 targets (Table 1). In most cases this effect was not absolute, consistent with the fact that oligomycin at the concentrations used (10 μg/mL) did not fully prevent p53 accumulation (Figure 1). Moreover, some of these p53 target genes have been also reported to be activated by cell damage directly in response to DNA damage (eg, GADD45A and DDB2 genes).37,38 Two early stress-response genes, SGK and EGR1, have been reported to be transcriptionally repressed by the wt p53,40,41 and their up-regulation in the presence of oligomycin indicates that oligomycin also inhibited p53 activity as a transcriptional repressor (Table 1). It should be noted that p53 mRNA levels did not change significantly in the presence of doxorubicin, etoposide, and/or oligomycin (Table 1), thus excluding the possibility that oligomycin could directly prevent p53 accumulation at the transcriptional level.
In addition to p53-specific targets, we observed an up-regulation of several genes (IKBA, TRAF4, and CD69) reported to be NFκB-specific transcriptional targets.42,43 Interestingly, up-regulation of these genes was not counteracted but even enhanced by oligomycin (Table1), thus indicating that oligomycin might differentially affect p53 and NFkB stress-induced signaling.
The expression of several genes was consistently up-regulated in the presence of oligomycin (Table 1). As expected, genes encoding for proteins involved in energy homeostasis and the adaptive regulation of metabolic pathways (VLDLR,44 TRB3,44 CEBP beta [CEBPb]45 ) were strongly up-regulated. Furthermore, strong up-regulation of the highly stress-sensitive ATF3 transcription factor46 in the presence of the drugs and of oligomycin indicated that the presence of oligomycin did not reduce the overall extent of intracellular stress. Oligomycin obviously did not suppress overall mRNA synthesis and only some genes have been found to be consistently down-regulated by oligomycin (23 genes down-regulated by 1.5-fold; Table 1 and data not shown). Among these genes were those encoding for the oxidoreductase-relevant protein NDUFC1 and the heat-shock protein HSP70B, a chaperone with multiple applications including regulation of NQO1 oxidoreductase.47
The p53 system is coupled to mitochondrial activity in activated T cells and in primary leukemia cells
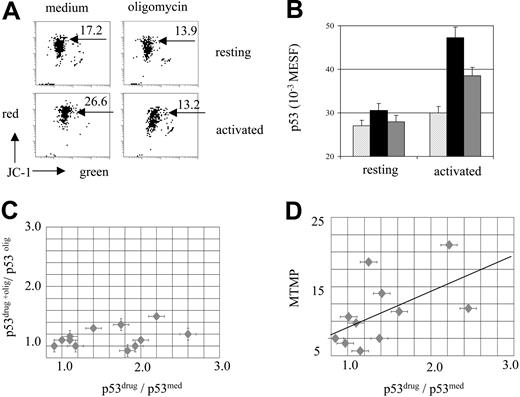
Linkage between mitochondrial activity and the p53 system was investigated further in primary cells. We studied resting and activated T cells from peripheral blood and found increased MTMP levels in activated T cells (Figure 5A). It was also found that oligomycin treatment down-regulated MTMP, and activated and resting cells disclosed similar levels of MTMP in the presence of oligomycin (Figure 5A). In the presence of etoposide, resting T cells showed only a small increase of p53 (Figure 5B). Upon activation for 24 hours (Figure 5B) and 72 hours (data not shown), T cells acquired drug sensitivity at the p53 level, in line with a previous report.48 Etoposide-induced p53 accumulation in activated T cells was effectively counteracted by oligomycin (Figure 5B).
Mitochondrial dependence of drug-induced p53 accumulation in activated T cells and primary leukemia. Normal PB T cells and ALL cells were incubated with oligomycin (10 μg/mL) and/or etoposide (30 μM) for 6 hours and assessed for MTMP and p53 levels. (A) MTMP (JC-1 fluorescence, 4-decade log scaling) is increased in activated T cells and is down-regulated by oligomycin (10 μg/mL). (B) Oligomycin prevents etoposide-induced p53 accumulation in activated T-cells. ▧ indicates medium; ▪ indicates etoposide; ▦ indicates etoposide plus oligomycin. (C) Heterogeneous sensitivity to etoposide and to oligomycin in a series of ALL samples. Each individual leukemic sample is presented as a point, positioned according to the value of drug-specific p53 accumulation in the presence (y-axis) and absence (x-axis) of oligomycin. (D) Constitutive MTMP levels correlate with p53 drug sensitivity in a series of ALL samples (Spearman analysis: rs = 0.68, P < .05).
Mitochondrial dependence of drug-induced p53 accumulation in activated T cells and primary leukemia. Normal PB T cells and ALL cells were incubated with oligomycin (10 μg/mL) and/or etoposide (30 μM) for 6 hours and assessed for MTMP and p53 levels. (A) MTMP (JC-1 fluorescence, 4-decade log scaling) is increased in activated T cells and is down-regulated by oligomycin (10 μg/mL). (B) Oligomycin prevents etoposide-induced p53 accumulation in activated T-cells. ▧ indicates medium; ▪ indicates etoposide; ▦ indicates etoposide plus oligomycin. (C) Heterogeneous sensitivity to etoposide and to oligomycin in a series of ALL samples. Each individual leukemic sample is presented as a point, positioned according to the value of drug-specific p53 accumulation in the presence (y-axis) and absence (x-axis) of oligomycin. (D) Constitutive MTMP levels correlate with p53 drug sensitivity in a series of ALL samples (Spearman analysis: rs = 0.68, P < .05).
In primary leukemia cells from ALL patients, low intrinsic levels of p53 protein were observed (data not shown). As p53 mutations usually result in increased intrinsic p53 levels, this observation pointed to the absence of p53 mutations in these cells, in line with the general infrequency of p53 mutations in childhood ALL at initial diagnosis.27-29 With respect to drug-induced p53 accumulation, ALL blasts showed a heterogeneous pattern of stress sensitivity, and oligomycin differentially prevented drug-induced p53 accumulation in ALL cells (Figure 5C). We also found a considerable heterogeneity in constitutive MTMP levels in leukemic samples (Figure 5D). Interestingly, the drug-induced p53 accumulation and constitutive MTMP levels were significantly correlated in the series of ALL samples (rs = 0.68, P < .05; Figure 5D).
p53 accumulation is ROS sensitive and oligomycin reduces mitochondrial ROS levels
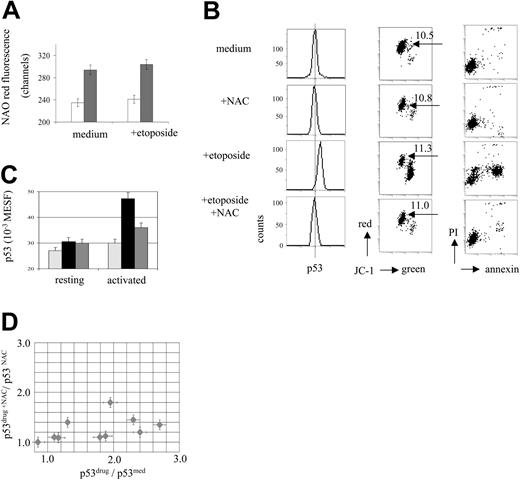
The electron transport chain of mitochondria is known to be a site of ROS generation resulting from the occasional escape of transported electrons.15,16 We therefore asked whether down-regulation of mitochondrial activity and MTMP levels by oligomycin might affect ROS levels in MOLT-3 cells. Oligomycin had only a small effect on the total cellular level of ROS as assessed by the ROS-sensitive dyes DCFDA and HE (decreased by 5%-10%; data not shown). In order to detect mitochondrially localized ROS, the mitochondria-specific dye NAO was used. NAO binds specifically to mitochondrial cardiolipin, and its binding affinity and fluorescence properties depend on the oxidation state of cardiolipin.49-51 NAO binds with high affinity to a nonoxidized cardiolipin in a 2:1 ratio, and its fluorescence shifts toward longer wavelength from 525 nm (green) to about 640 nm (red) as a result of NAO dimerization on the site of the mitochondrial membrane.49,50 In the case of oxidized cardiolipin, NAO has been reported to bind cardiolipin with a decreased affinity reflected by lower levels of red fluorescence.49 Therefore, oxidative stress localized to mitochondria can be assessed by red fluorescence measurement of NAO.51 Using this approach we observed a 26% increase of the NAO red fluorescence in MOLT-3 cells in the presence of oligomycin compared with cells cultured in the medium (P < .001, t test; Figure 6A). Therefore, oligomycin predominantly decreased levels of ROS localized at mitochondria.
Involvement of ROS in the drug-induced p53 accumulation in leukemic cells and activated T lymphocytes. (A) Increased NAO red fluorescence indicates decreased mitochondrial ROS levels in the presence of oligomycin. MOLT-3 cells were incubated with oligomycin (10 μg/mL) and/or with etoposide (1 μM) for 3 hours and assessed for NAO fluorescence. Open bars indicate -oligomycin; gray bars indicate +oligomycin. (B) NAC prevents etoposide-induced p53 accumulation and apoptosis. MOLT-3 cells were incubated with NAC (10 mM) and/or with etoposide (1 μM) and assessed for p53 protein levels after 3 hours of incubation and for apoptosis (JC-1 and annexin/PI staining) after 6 hours of incubation (JC-1, caspase-3, annexin V, and PI fluorescence: 4-decade log scaling). NAC did not affect MTMP levels, as indicated by JC-1 red-green fluorescence ratios in viable cell fractions (indicated by arrows). (C) NAC (10 mM) prevents etoposide-induced p53 accumulation in activated T cells. T cells were incubated with NAC (10 mM) and/or etoposide (30 μM) for 6 hours and assessed for p53 levels. Hatched bars indicate medium; black bars, etoposide; and gray bars, etoposide plus NAC. (D) NAC (10 mM) differentially prevents etoposide-induced p53 accumulation in a series of ALL samples. ALL cells were incubated with NAC (10 mM) and/or etoposide (30 μM) for 6 hours and assessed for p53 levels. Each individual leukemic sample is presented as a point, positioned according to the value of drug-specific p53 accumulation in the presence (y-axis) and absence (x-axis) of NAC.
Involvement of ROS in the drug-induced p53 accumulation in leukemic cells and activated T lymphocytes. (A) Increased NAO red fluorescence indicates decreased mitochondrial ROS levels in the presence of oligomycin. MOLT-3 cells were incubated with oligomycin (10 μg/mL) and/or with etoposide (1 μM) for 3 hours and assessed for NAO fluorescence. Open bars indicate -oligomycin; gray bars indicate +oligomycin. (B) NAC prevents etoposide-induced p53 accumulation and apoptosis. MOLT-3 cells were incubated with NAC (10 mM) and/or with etoposide (1 μM) and assessed for p53 protein levels after 3 hours of incubation and for apoptosis (JC-1 and annexin/PI staining) after 6 hours of incubation (JC-1, caspase-3, annexin V, and PI fluorescence: 4-decade log scaling). NAC did not affect MTMP levels, as indicated by JC-1 red-green fluorescence ratios in viable cell fractions (indicated by arrows). (C) NAC (10 mM) prevents etoposide-induced p53 accumulation in activated T cells. T cells were incubated with NAC (10 mM) and/or etoposide (30 μM) for 6 hours and assessed for p53 levels. Hatched bars indicate medium; black bars, etoposide; and gray bars, etoposide plus NAC. (D) NAC (10 mM) differentially prevents etoposide-induced p53 accumulation in a series of ALL samples. ALL cells were incubated with NAC (10 mM) and/or etoposide (30 μM) for 6 hours and assessed for p53 levels. Each individual leukemic sample is presented as a point, positioned according to the value of drug-specific p53 accumulation in the presence (y-axis) and absence (x-axis) of NAC.
The involvement of ROS in drug-induced p53 accumulation was further investigated by using the glutathione progenitor NAC as a general antioxidant known to reduce intracellular ROS levels.52 After titration experiments (data not shown), NAC at a concentration of 10 mM was found to prevent almost totally both the early accumulation of p53 and the consequent apoptotic events in the MOLT-3 cells treated with etoposide (Figure 6B). NAC also abrogated p53 accumulation in MOLT-3 cells treated with lactacystin, H2O2, and doxorubicin (data not shown). As MTMP levels remained almost constant in the presence of NAC in both etoposide treated and untreated cells (Figure 6B), the effect of NAC did not implicate changes of MTMP levels.
Discussion
In the present study we addressed the contribution of mitochondrial components involved in oxidative phosphorylation to proapoptotic stress signaling in cell systems endogenously expressing wt p53, and identified a link between mitochondrial activity and the stress responsiveness of the p53 system in leukemia cells and in normal lymphocytes. As a result of this linkage, down-regulation or constitutively low MTMP levels conferred chemoresistance to cells at the p53 level.
Of various mitochondrial inhibitors able to down-regulate MTMP, oligomycin revealed the highest efficacy to prevent stress-induced p53 accumulation and p53-dependent apoptosis. Oligomycin was recently reported to inhibit apoptosis in cellular systems with transiently activated p53.22 ATP synthase has been shown to cooperate with the p53 target Bax, thus indicating a contribution of mitochondrial components of oxidative phosphorylation to proapoptotic signaling downstream of p53 activation. Our investigations of cellular systems with endogenous wt p53 suggest a contribution of mitochondrial oxidative phosphorylation to the proapoptotic signaling upstream of p53 activation. Moreover, the observation that apoptotic signaling via p53-independent pathways, either mitochondrial (staurosporine) or extrinsic (CD95 death receptor), was not affected by mitochondrial inhibitors, indicates a selective linkage of mitochondrial activity to p53. This is further supported by genome-wide gene expression analysis of MOLT-3 cells, which has demonstrated a largely selective inhibition by oligomycin of p53-specific targets but not other stress-inducible (including NFκB-dependent) transcriptional targets.
At the concentrations able to effectively abrogate drug-induced p53 signaling and apoptosis, oligomycin caused a low to moderate reduction of intracellular ATP levels. In line with this, oligomycin did not impair the ATP-dependent cascade of (p53-independent) apoptotic events53,54 and did not cause a switch to necrotic cell death.54 It is of particular importance, that the moderate ATP decrease by inhibition of glycolysis did not inhibit stress-induced p53 accumulation and apoptosis. These data suggest that reduction of intracellular ATP levels is unlikely to be the mechanism of suppression of drug-induced p53 activation.
ROS have been implicated as second messengers in multiple signaling pathways.55,56 Mitochondrion is the main site of ROS generation, which results from the escape of transported electrons from the electron transport chain.15,16 Reduction of mitochondrial ROS by overexpression of mitochondrial redox-regulating thioredoxin has been reported to confer cellular resistance to etoposide.57 The general antioxidant NAC has been reported to prevent p53 accumulation, induced by drugs generating ROS, and to prevent cell death downstream of p53 activation.58-62 Redox dependence of the stress-induced signaling in our cell systems has been demonstrated by investigations of ROS levels and the effects of NAC. Our data demonstrated that ROS are involved in stress-induced signaling upstream of p53 activation. A striking similarity was observed in all cellular systems studied between the effects of oligomycin and NAC on the etoposide-induced p53 accumulation. Furthermore, oligomycin was found to down-regulate mitochondrial ROS, while NAC did not affect MTMP levels. These data suggest that mitochondrial ROS may be implicated as second messengers between mitochondrial electron transport activity and stress-induced p53 activation.
Redox-regulating oxidoreductases have recently emerged as a novel class of interaction partners of the p53 protein, indicating the importance of intracellular redox-regulating factors in the stress-induced p53-activation. Chang et al63 identified WOX1 oxidoreductase as a proapoptotic protein, which became phosphorylated in response to stress or apoptotic stimuli and formed a complex with activated p53. The p53 complex with a wild-type, but not mutant WOX1, translocated to the mitochondria and further to the nuclei to mediate apoptosis. In a series of studies Asher et al6,64,65 demonstrated that NQO1 oxidoreductase regulates p53 in a MDM2-independent manner. In addition, Anwar et al7 demonstrated that p53 stabilization requires the physical interaction of p53 with NQO1. It was also shown that heat-shock protein HSP70B interacts with an immature form of NQO1 and is responsible for the stability and functionality of this oxidoreductase.47 We observed down-regulation of the HSP70B encoding gene and of the gene encoding for a component of the mitochondrial complex I with a NADH dehydrogenase activity, NDUFC1. These changes, which indicate interference of oligomycin with cellular redox regulation at the transcriptional level, are of particular interest, as only a small number of genes were consistently down-regulated by oligomycin (Table 1). It remains to be elucidated, whether oxidoreductase-specific p53 regulation may be operative in the ROS-mediated linkage between mitochondrial activity and the p53 system.
Quantification of intracellular MTMP levels provides a useful intrinsic determinant describing mitochondrial activity. Heerdt et al66,67 have reported the dependence of intrinsic MTMP levels on the extent of growth arrest and apoptosis in cancer cells. Harper et al68 have found that decreased MTMP levels are characteristic of drug-resistant leukemia cell lines as compared to MTMP levels in their drug-sensitive counterparts. It is of particular interest that chemoresistant cells have been found to switch their energy metabolism from oxidative phosphorylation to anaerobic energy sources, thus preserving energy supply while reducing mitochondrial activity.68 Our data suggest that this cellular metabolic strategy would decrease or abolish cellular stress sensitivity at the p53 level, thus providing a clinically-relevant mechanism of chemoresistance of the wt p53 cells. It would be of interest to investigate whether differential MTMP levels observed in the primary ALL cells might be due to metabolic differences in these cells.
Recent studies have indicated the impact of wt p53 on mitochondrial function. Mouse embryos homozygous for a p53 null mutation showed mitochondrial deficiency at a stage in development when the embryo switches from an anaerobic to aerobic metabolism.69 In wt p53 cells, constitutive and stress-dependent colocalization of p53 with mitochondria have been reported.70,71 Mitochondrial targeting of the dominant-negative p53 mutant protein resulted in decreased MTMP levels.72 Our data provide experimental evidence that activation of the p53 system requires mitochondrial activity, and point to mitochondrial ROS as secondary messengers between respiratory chain and proapoptotic p53 machinery. This linkage has potential clinical implications in the mechanisms of chemoresistance in normal and malignant cells.
Prepublished online as Blood First Edition Paper, February 10, 2005; DOI 10.1182/blood-2004-09-3428.
Supported in part by a grant of the Federal Ministery for Education and Research (BMBF) in the National Genome Research Network (NGFN) to P.R.
The publication costs of this article were defrayed in part by page charge payment. Therefore, and solely to indicate this fact, this article is hereby marked “advertisement” in accordance with 18 U.S.C. section 1734.
We thank R. Hoffmann for excellent technical assistance, Dr C. Beltinger (Ulm) for giving advice on using NAO staining as a mitochondrial ROS indicator, and Prof Dr D. B. Davies (London) for a critical reading of the manuscript.

