Abstract
The extent and rapidity with which T cells are regenerated from graft-derived precursor cells directly influences the incidence of infection and the T-cell–based graft-versus-tumor effect. Measurement of T-cell receptor excision circles (TRECs) in peripheral blood is a means of quantifying recent thymic T-cell production and has been used after transplantation in many studies to estimate thymus-dependent T-cell reconstitution. We hypothesized that the quality of thymic function before transplantation affects thymus-dependent T-cell reconstitution after transplantation. We used real-time polymerase chain reaction (PCR) to quantify signal-joint TRECs (sjTRECs) before and after transplantation. T-cell reconstitution was evaluated by T-cell receptor β (TCRβ) CDR3 size spectratyping. We tested 77 healthy sibling donors and 244 samples from 26 pediatric recipients of allogeneic hematopoietic stem cell transplantation (AHSCT). Blood from the healthy donors contained 1200 to 155 000 sjTREC copies/mL blood. Patients who had greater than 1200 copies/mL blood before transplantation showed early recovery of sjTREC numbers and TCRβ repertoire diversity. In contrast, patients who had fewer than 1200 copies/mL blood before transplantation demonstrated significantly slower restoration of thymus-dependent T cells. We conclude that the rate of reconstitution of thymus-dependent T cells is dependent on the competence of thymic function in the recipients before transplantation. Therefore, pretransplantation measurement of sjTREC may provide an important tool for predicting thymus-dependent T-cell reconstitution after transplantation.
Introduction
The extent and pace of T-cell regeneration from graft-derived precursor cells directly affect the risk of infection and the T-cell–based graft-versus-tumor (GvT) effect. The T-cell population can be regenerated through 2 different pathways. The thymus-independent pathway involves expansion of graft-derived mature donor T cells, whereas the thymus-dependent pathway involves the regeneration of T cells with a more diverse T-cell receptor (TCR) repertoire from graft-derived precursor cells.1 Efficient recovery of thymus-dependent T cells is frequently associated with a lower incidence of graft-versus-host disease (GvHD) and infection.2,3
Thymus-dependent T-cell reconstitution has often been traced by using multiparameter flow cytometry to identify naive (CD45RA+) T cells. However, some CD45RO+ T cells can re-express CD45RA but remain functional memory T cells.1 Further, some CD45RA+ T cells (CD45RA+CD31-), while naive, may not be recent thymus emigrants and may undergo extensive post-thymic division.4 The measurement of T-cell receptor excision circles (TRECs) allows direct quantitation of recent thymic output.5 TRECs are episomal DNA circles generated by the TCRα locus recombination process and are found in thymocytes and mature T cells.5 TRECs cannot replicate and are not duplicated in the cells; they are therefore diluted out during cell division.5
Analysis of TCRβ repertoire diversity by complementarity-determining region 3 (CDR3) spectratyping6,7 is another powerful measure of thymus-dependent T-cell reconstitution. The TCR CDR3 region is the only non–germ line-encoded hypervariable region. This region in TCRαβ is generated in the thymus by recombination of the V, D, and J segments and by random insertion and deletion of junctional nucleotides so that the final products are quite heterogeneous in size.8 CDR3 spectratyping reveals that healthy individuals exhibit a highly diverse and polyclonal TCRβ repertoire with a typically gaussian-like distribution of the sizes of CDR3 regions.7 After transplantation, re-emergence of CD45+RA+ T cells is associated with recovery of TCRβ repertoire diversity.9,10
Many studies of T-cell reconstitution have relied on posttransplantation measurement of TREC and TCRβ repertoire diversity. A highly skewed repertoire and the absence of increased TRECs in the early posttransplantation stage corresponded to the expansion of CD45RO+ T cells.10 The reappearance of TRECs after transplantation was associated with the emergence of phenotypically naive T cells.9,10 A diverse repertoire and increased TRECs appeared at a later stage with the appearance of CD45RA+RO- T cells.9,10 The persistence of low TREC numbers was associated with a higher incidence of GvHD,2,3 infection,11 and leukemic relapse.12 Douek et al9 found that in adult patients, an increase in TREC numbers as early as 100 days after autologous hematopoietic stem cell transplantation predicted the recovery of naive T cells by 1 year after transplantation. Talvensaari et al13 found that patients with acute or chronic GvHD after allogeneic bone marrow transplantation showed lower pretransplantation levels of TRECs. Recently, Svaldi et al14 reported that adult patients with multiple myeloma who had greater than 136 copies of coding-joint TRECs (cjTRECs)/105 cells at the time of diagnosis had a higher probability of survival.
To date, no one has investigated the relationship of signal-joint TREC (sjTREC) production before allogeneic hematopoietic stem cell transplantation (AHSCT) to thymus-dependent T-cell reconstitution in pediatric patients. We hypothesized that in pediatric patients, the quality of thymic function before transplantation affects thymus-dependent T-cell reconstitution after transplantation, thereby influencing the risk of GvHD, infection, and transplantrelated mortality. In the present study, we longitudinally analyzed variations of sjTREC and TCRβ repertoire before and after AHSCT in pediatric patients. We used real-time polymerase chain reaction (PCR) to determine sjTRECs. T-cell reconstitution was evaluated with TCRβ CDR3 size spectratyping. We quantitatively analyzed chimerism to assess the influence of engraftment and also observed the recovery of other immune competence cells by flow cytometry.
Patients, materials, and methods
Subjects and transplantation regimens
To determine a reference range, we quantified sjTREC in 77 healthy sibling donors (33 female, 44 male) (Table 1). Their ages (1 to 20 years) approximated the age range of the patients tested in this study.
The 244 patient samples studied were obtained from 26 pediatric recipients of AHSC transplants. The characteristics of the patients and their transplantation conditions are listed in Table 2. This study was approved by the St Jude Children's Research Hospital Institutional Review Board, and informed consent was obtained from donors, patients, parents, or guardians, as appropriate.
Seventeen patients were conditioned with total body irradiation (TBI) (12 Gy), thiotepa, and cyclophosphamide. Three patients received total lymphoid irradiation (TLI) (8 Gy), cyclophosphamide, and fludarabine. One patient received TLI, melphalan, and fludarabine. Five patients were conditioned only with melphalan-thiotepa-fludarabine, or cyclophosphamide-thiotepa, or etoposide-thiotepa. The grafts consisted of either mobilized peripheral CD34+ cells positively selected from haploidentical donors as described by Handgretinger et al15 (16 patients) or mobilized peripheral stem cells obtained from haploidentical donors and depleted of CD3+ T cells as described by Gordon et al16 (3 patients). Seven patients received bone marrow from matched unrelated donors. The bone marrow was either unmanipulated (4 patients) or was enriched for CD34+ stem cells by positive selection and had 5 × 10⁵ CD3+ T cells/kg added back (3 patients). In addition to the stem cells, most patients received antithymocyte globulin (ATG) and/or anti-CD3 antibody (muromonab). Fourteen patients received GvHD prophylaxis as shown in Table2.
We also reviewed the pretransplantation therapy received by each of the 26 patients (Table 2). Nine patients received standard AML (sAML) therapy and 5 received standard acute lymphoblastic leukemia (sALL) therapy. Two patients had biphenotypic leukemias and received truncated forms of both sALL and sAML therapy. Other patients received multiple therapies described in Table 2. Four patients had nonmalignant diseases. Of these the 3 with aplastic anemia received only immunosuppressive therapy, and the 1 with Hurler syndrome received a prior matched unrelated transplant with busulfan and cyclophosphamide as conditioning (Table 2).
Detection and quantification of sjTREC
Real-time PCR was used to measure sjTREC as described previously17 with minor modifications. Briefly, the genomic DNA was purified from peripheral blood mononuclear cells (PBMNCs) with QIAamp Blood Mini Kit (QIAgen Valencia, CA). The PCR reaction mixture was prepared in a total volume of 25 μL containing 12.5 μL TaqMan universal PCR Master Mix (Applied Biosystems, Branchburg, NJ), 250 nM forward and reverse primer, 100 nM probe, and 100 ng PBMNC DNA. The sequences of the primers and probe were described previously.17 The conditions for the real-time PCR were 50°C for 2 minutes and 95°C for 10 minutes followed by 50 cycles of 95°C for 15 seconds and 60°C for 1 minute on an ABI Prism 7700 Sequence Detector (Applied Biosystems, Foster City, CA). All samples were measured in duplicate PCR reactions. The standard curve and sjTREC values were established by using Sequence Detection Software version 1.7 (Applied Biosystems, Foster City, CA). TREC copies per milliliter blood were calculated from the number of sjTREC molecules in the sample and corrected with lymphocyte-monocyte count in the same volume of blood, which was obtained from complete blood count (CBC). The Cα constant region was used as an internal control and to normalize for input DNA. The standards both for sjTREC and Cα were made by cloning sjTREC or Cα fragment into pCR 2.1-TOPO Vector by using TOPO TA Cloning Kit (Invitrogen, Carlsbad, CA) as described by the manufacturer.
TCRβ CDR3 size spectratyping
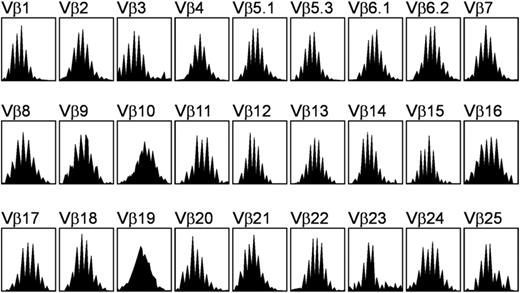
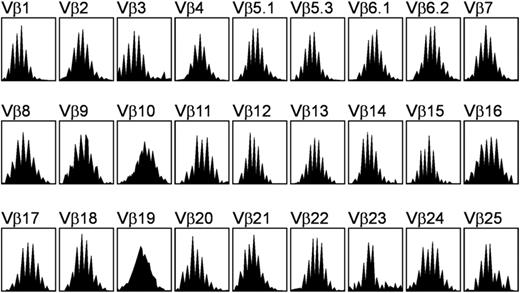
The size distribution of the TCRβ CDR3 was determined by reverse transcription (RT)–PCR. The total RNA was purified from PBMNCs with the RNeasy Mini Kit (QIAgen). Complementary DNA (cDNA) was synthesized by using Superscript II reverse transcriptase and random hexamers primer (Invitrogen) according to the manufacturer's instructions. PCR was performed in a volume of 25 μL that comprised 1 × PCR buffer, 2.5 mM MgCl2, 0.625 U AmpliTaq Gold (Applied Biosystems, Branchburg, NJ), 200 uM deoxyribonucleoside triphosphate (dNTP), and 500 nM of 1 of 27 TCRVβ primers combined with 1 Cβ primer conjugated to the fluorescent dye 6-carboxyfluorescein amino hexy (6-FAM). The sequences of the TCRVβ and Cβ primers were described previously.18 The PCR condition was 95°C for 10 minutes followed by 36 cycles of 94°C for 20 seconds, 55°C for 40 seconds, 72°C for 40 seconds, and a final extension step of 72°C for 5 minutes. The PCR fragments were then run on an ABI Prism 310 Genetic Analyzer (Applied Biosystems, Foster City, CA), and data were collected and analyzed by Genescan Analysis Software version 3.1.2 (Applied Biosystems, Foster City, CA). The normal TCRβ CDR3 size was characterized as a Gaussian distribution, containing 8 to 10 peaks for each Vβ subfamily (Figure 1). The overall complexity of TCRβ subfamilies was calculated by spectratype complexity scoring (SCS) as described by Wu et al.19
TCRβ repertoire profile obtained from the peripheral blood mononuclear cells of a healthy donor. Each Vβ subfamily contains 8 to 10 peaks and exhibits a gaussianlike distribution.
TCRβ repertoire profile obtained from the peripheral blood mononuclear cells of a healthy donor. Each Vβ subfamily contains 8 to 10 peaks and exhibits a gaussianlike distribution.
Determination of complete blood counts
The CBCs were measured from whole blood sample by using a Beckman Coulter GenS Hematology Analyzer (Fullerton, CA).
Flow cytometric analysis
The PBNMCs were collected from the heparinized blood by Ficoll-Hypaque density gradient centrifugation. The phenotypes were analyzed by using a 4-color FACScalibur flow cytometric analyzer (Becton Dickinson, San Jose, CA). The monoclonal antibodies used were anti-CD45–peridinin chlorophyll protein (PerCP), -CD3–allophycocyanin (APC), -CD4–fluorescein isothiocyanate (FITC), -CD8–phycoerythrin (PE), -CD19–APC, -CD56–PE, and -CD16–PE. All of these cell populations were measured by gating on CD45+ cells. The absolute cell numbers for each population were calculated from the CBC lymphocyte numbers.
Quantitative analysis of chimerism
The method used was described previously.20 Donor and recipient alleles were discriminated on the basis of short tandem repeat (STR) PCR with markers established for genetic fingerprinting. The PCR products were separated on an ABI 3100 Genetic Analyzer (Applied Biosystem, Foster City, CA), and the data were collected by Genescan Analysis Software. The final calculation of recipient chimerism was based on the ratio of the peak heights of informative donor and recipient signals.
Statistical analyses
The correlation between sjTREC level and patient age was analyzed by determining the Pearson correlation coefficient (r values) and by linear regression analysis after log10 transformation of the sjTREC count. The Wilcoxon rank-sum test was used to compare the difference between the median of sjTREC numbers in 2 groups. The STATA software version 6.0 (College Station, TX) was used for statistical analysis. A P value less than .05 was considered to indicate a statistically significant.
Results
SjTREC measurement in healthy donors
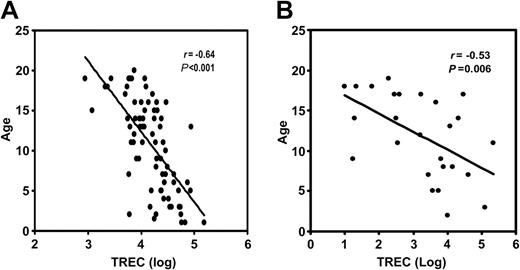
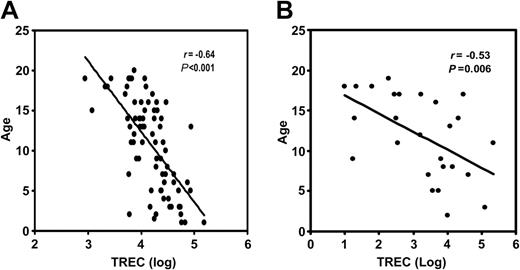
We measured sjTREC in 77 healthy sibling donors aged 1 to 20 years. The range of sjTREC numbers was 1200 to 155 000 copies/mL blood. The mean sjTREC number was 24 015 ± 2737 copies/mL blood. There was a statistically significant inverse correlation (r = -0.64, P = .001) between sjTREC numbers and donor age (Figure 2A). We divided the donors into 4 groups according to their age (Table 1). There was a significant inverse correlation between donor age and sjTREC number in the 16 to 20 age group (r = -0.64, P = .004). Some of the donors with the same age differed in sjTREC count by a factor of 2 or more. There was no significant difference between the sexes in sjTREC production. The lowest value obtained for sjTREC from healthy donors (1200 copies/mL blood) was established as the lower threshold of the normal range.
Inverse correlation between the sjTREC count and donor age. (A) Seventy-seven healthy sibling donors. The x-axis represents the log of the sjTREC numbers. The y-axis shows donor age in years. The correlation coefficient (r) is -0.64 (P < .001). (B) The same comparison in 26 pediatric patients. (r = -0.53; P = .006).
Inverse correlation between the sjTREC count and donor age. (A) Seventy-seven healthy sibling donors. The x-axis represents the log of the sjTREC numbers. The y-axis shows donor age in years. The correlation coefficient (r) is -0.64 (P < .001). (B) The same comparison in 26 pediatric patients. (r = -0.53; P = .006).
SjTREC measurement in pediatric patients before AHSCT
We assayed 244 samples from 26 pediatric patients. The pretransplantation sjTREC number was determined at study entry before the start of any treatment associated with AHSCT. The pretransplantation sjTREC counts varied widely (0 to 216 513 copies/mL blood; Table 2). The mean value was 19 507 ± 9360 copies/mL blood. The range of patient age was from 3 to 19 years. The mean age was 11.8 ± 1 years (Table 2). There was a statistically significant inverse correlation (r = -0.53, P = .006) between sjTREC number and patient age (Figure 2B). Before transplantation, 16 of 26 patients tested had sjTREC levels greater than 1200 copies/mL blood (range, 1620-216 513 copies/mL blood; group 1). The mean value was 31 597 ± 14 558 copies/mL blood. Ten patients had sjTREC levels below 1200 copies/mL blood (range, 0-398 copies/mL blood [group 2]; the mean was 164 ± 51 copies/mL blood). The patients with normal pre-sjTREC counts were younger (average age, 9.6 ± 1.2 years) than patients with low pre-sjTREC counts (average age, 15.5 ± 1 years). However, sjTREC numbers varied among patients of equivalent age (Table 2)
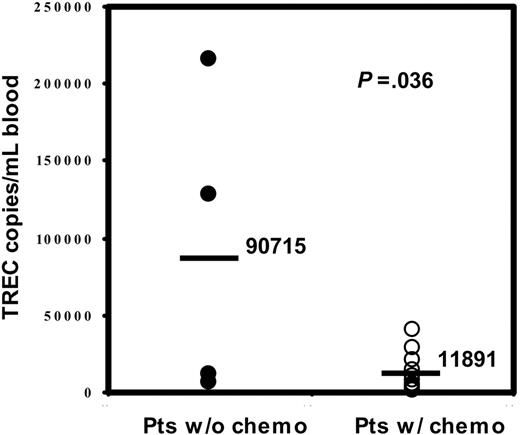
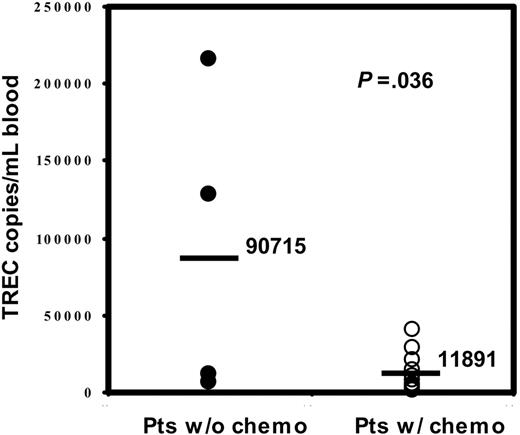
We evaluated the heterogenous therapies received by all of the patients prior to transplantation and did not find a significant correlation between a specific therapy and pretransplantation sjTREC values. However, all 4 patients with nonmalignant diseases, who had not received chemotherapy directed against a malignancy, had sjTREC levels greater than 1200 copies/mL blood (Table 2), and their mean of sjTREC number (90 715 ± 50 442 copies/mL blood) was statistically significant (P = .036) higher than the mean (11 891 ± 3578 copies/mL blood) in the patients with the chemotherapy in group 1 (Figure 3).
Comparison of the pretransplantation sjTREC count in patients with and without prior chemotherapy. The y-axis shows sjTREC numbers in the patients without chemotherapy (•) and in the patients with chemotherapy (○). The bar represents the mean sjTREC value for each group of patients (P = .036).
Comparison of the pretransplantation sjTREC count in patients with and without prior chemotherapy. The y-axis shows sjTREC numbers in the patients without chemotherapy (•) and in the patients with chemotherapy (○). The bar represents the mean sjTREC value for each group of patients (P = .036).
Longitudinal analysis of variation of sjTREC counts after AHSCT
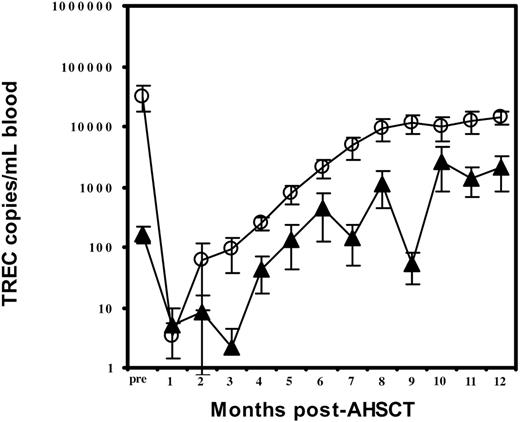
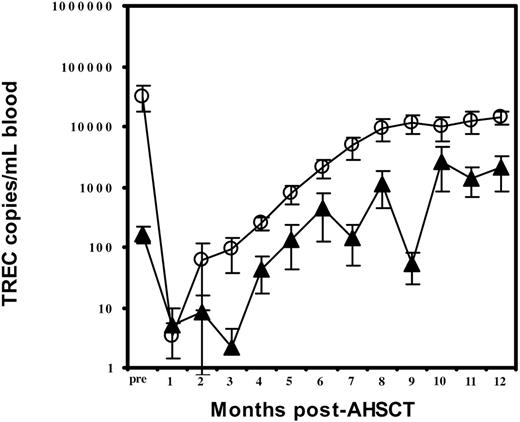
During the first month after transplantation, most recipients experienced a period of undetectable sjTREC. The mean sjTREC levels were 3.4 ± 2 or 5 ± 5 copies/mL blood, respectively, in groups 1 and 2 (Table 3; Figure 4). In group 1, the sjTREC count had begun to rise at the second month, and the level was 8 times that of group 2 (63 ± 53 copies/mL blood versus 8 ± 8 copies/mL blood). In group 2, however, TREC counts had begun to rise at the fourth month but were only one sixth the mean value of group 1 (44 ± 26 copies/mL blood versus 255 ± 66 copies/mL blood). During the next 8 months the sjTREC levels increased steadily in both groups. However, group 1 values had returned to the normal range by month 6, while the mean value in group 2 remained 5 times lower at this point (group 1, 2113 ± 698 copies/mL blood versus group 2, 450 ± 326 copies/mL blood). The sjTREC numbers in group 2 returned to normal range at month 10 but remained approximately one fourth those of group 1 (Table 3; Figure 4). Only 4 patients in each group were tested at the end of the study (12 months).
Longitudinal analysis of sjTREC counts. The mean sjTREC number is shown at monthly intervals for patients whose pretransplantation sjTREC counts were higher than 1200 copies/mL blood (○) or lower than 1200 copies/mL blood (▴).
Longitudinal analysis of sjTREC counts. The mean sjTREC number is shown at monthly intervals for patients whose pretransplantation sjTREC counts were higher than 1200 copies/mL blood (○) or lower than 1200 copies/mL blood (▴).
Analysis of TCRβ CDR3 size distribution before and after AHSCT
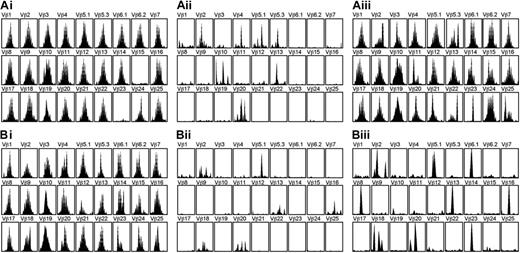
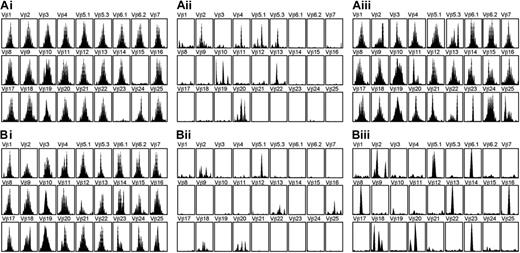
We determined the TCRβ CDR3 size distribution in 8 patients (4 from each group). Before transplantation, the majority of the TCRβ repertoires had shown a gaussian-like pattern in both groups. There was no significant difference in average SCS between the 2 groups before transplantation (Table 4). For the first month after AHSCT, the SCS descended to a very low level in both groups. At 3 months after AHSCT, the mean SCS had started to increase in group 1, which had high TREC count before transplantation, but remained lower in group 2. At 6 months after AHSCT, the average SCS for the group 1 had increased up to 172, which is close to the level observed before AHSCT. A gaussian-like pattern of TCR repertoire was observed in the majority of the Vβ subfamilies in all of 4 patients tested in group 1. In contrast, the average SCS remained relatively lower in the group 2. A skewed pattern of TCR repertoire was observed in 2 of the 4 patients in this group. In the other 2 patients, TCRβ repertoire profiles showed a Gaussian-like distribution in more than half of Vβ subfamilies, increasing the SCS to 150 and 116. Their sjTREC numbers, however, remained at a low level (157 and 450 copies/mL blood). Figure 5 shows the alteration of TCRβ repertoire pattern before and after AHSCT in 1 of 4 patients from each group.
Profiles of TCRβ repertoire diversity before and after AHSCT. Profiles are shown for a patient with pretransplantation sjTREC level of more than 1200 copies/mL blood (A) and a patient with pretransplantation sjTREC level fewer than 1200 copies/mL blood (B). Profiles are shown before AHSCT (Ai, Bi), 1 month after AHSCT (Aii, Bii), and 6 months after AHSCT (Aiii, Biii).
Profiles of TCRβ repertoire diversity before and after AHSCT. Profiles are shown for a patient with pretransplantation sjTREC level of more than 1200 copies/mL blood (A) and a patient with pretransplantation sjTREC level fewer than 1200 copies/mL blood (B). Profiles are shown before AHSCT (Ai, Bi), 1 month after AHSCT (Aii, Bii), and 6 months after AHSCT (Aiii, Biii).
Restoration of immune components estimated by flow cytometry
We also measured the T-, B-, and natural killer (NK) cell reconstitution by flow cytometry. Before transplantation, the mean numbers of CD3+, CD4+, and CD8+ cells in group 1 were within normal ranges (CD3+, 900-3700/μL blood; CD4+, 550-2150/μL blood; CD8+, 200-1400/μL blood), whereas the mean values for these 3 populations in group 2 were below the normal ranges (Table 3).
At the first month after AHSCT, the T-cell populations were dramatically decreased in both groups. The numbers in group 1, however, were higher than those in group 2 by a factor of 6 to 57 times at this time point. The numbers had begun to increase in both groups at the second month. T-cell populations were not found to differ statistically during the first 8 months after AHSCT, although counts in group 1 were 2 to 8 times those in group 2. Until 8 months, all of the T-cell populations in both groups were below the normal range, with the exception of CD8 cell numbers in group 1 at months 6, 7, and 8.
Prior to transplantation, the mean of CD4/CD8 ratio for group 1 was 2.8 times that of group 2 (Table3). During the first 3 months after AHSCT, the ratio was less than 1 in both groups. We observed no statistically significant difference between the 2 groups in the mean ratios during those 3 months. At the fourth month after AHSCT, the CD4/CD8 ratio was again greater than 1 in both groups and remained so for the remaining 4 months of study. The average CD4/CD8 ratio was not found to differ significantly between the 2 groups during these 4 months.
Before the transplantation, the NK (CD56+/CD16+/CD3-) cell numbers in both groups were below the normal range (100-750/μL blood; Table 3). The number in group 1, however, was 1.5 times that in group 2. At the first month after transplantation, the NK cell numbers in both groups had dramatically increased and were within the normal range. These counts remained normal in both groups during the next 7 months. No statistically significant difference was observed in NK cell numbers between the 2 groups.
In the population of B cells (CD19+ cells) before AHSCT, the mean number in group 1 (153 ± 85/μL blood) was in the normal range (100-1620/μL blood), while the number in group 2 (2 ± 1.8/μL blood) was extremely low (Table3). After decreasing at the first month after AHSCT, B cells in group 1 rebounded to the normal range (148 ± 80/μL blood) at month 2. However, at this time point, B cells within group 2 were still lower than the normal range (38 ± 28/μL blood). During the next 6 months, B-cell numbers in both groups were within the normal range. There was no significant difference in the B-cell numbers between the 2 groups during these 6 months.
Chimerism
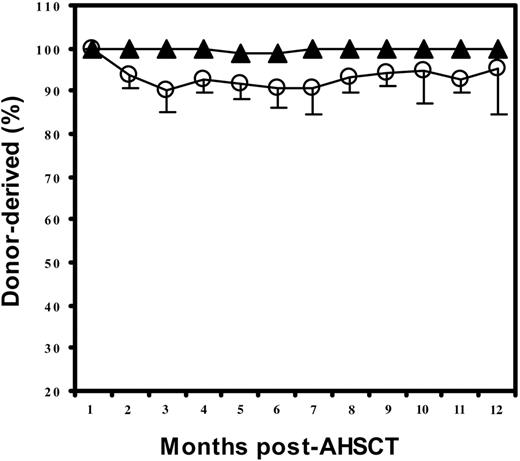
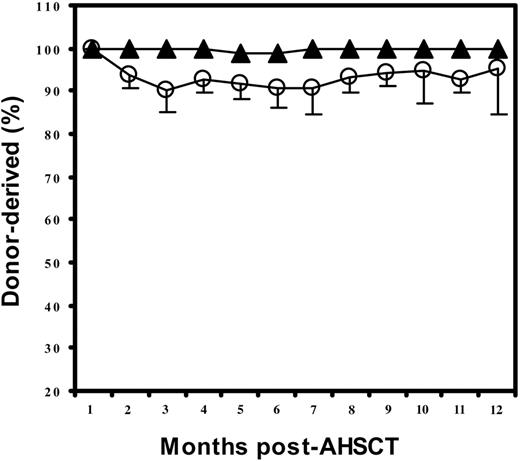
To evaluate the achievement of engraftment, we tested the length and number of short tandem repeat (STR) regions of the genome by PCR. The length of repeats within STR loci differs among individuals, thus distinguishing donor and recipient cells. Most patients in both groups had full-donor chimerism after transplantation, especially group 2. Six of the 16 patients in group 1 (high sjTREC levels before transplantation) showed mixed chimerism after the first month after AHSCT. Donor cells, however, dominated (mean, 90%-95% donor cells) throughout the period of testing (Table 3; Figure 6).
Chimerism after AHSCT. The mean percentage of donor-derived chimerism in patients whose pretransplantation sjTREC counts were greater than 1200 copies/mL blood (○) or fewer than 1200 copies/mL blood (▴).
Chimerism after AHSCT. The mean percentage of donor-derived chimerism in patients whose pretransplantation sjTREC counts were greater than 1200 copies/mL blood (○) or fewer than 1200 copies/mL blood (▴).
Discussion
In this study we have demonstrated, for the first time, a positive relationship between high sjTREC production in PBMNCs before AHSCT and rapid thymus-dependent T-cell reconstitution after AHSCT in pediatric patients.
To establish the normal range of sjTREC production in PBMNCs, we examined 77 healthy sibling donors within the same age range as the patients in this study. The sjTREC counts ranged from 1200 to 155 000 copies/mL blood among healthy donors. Variable TREC production in PBMNCs has been observed previously in healthy individuals.19,21 Possible explanations include the influence of age and genetic determinants. Steffens et al21 reported an inverse relation between age and TREC production in healthy donors, especially in the age ranges 0 to 5 and 23 to 57 years. We also found a statistically significant inverse correlation between age (0-20 years) and sjTREC numbers in our cohort of 77 healthy donors. Among these healthy donors, the inverse correlation was more prominent in the 16 to 20 age group. However, sjTREC counts also varied among healthy donors of the same age. Therefore, genetic determinants other than age may contribute to thymic function.
The sjTREC levels in our patients before AHSCT also varied widely (from 0 to 216 513 copies/mL blood). A statistically significant inverse correlation between age and sjTREC levels was also found in the 26 patients. These results agree with the reports of other groups.3,9,21 There was also an overlap in the ages of patients with distinctly different sjTREC levels. We noticed a relatively higher average age (15.5 years) in group 2, which had lower pretransplantation sjTREC counts. This finding not only implies an inverse correlation between age and TREC, but also suggests that individuals with relatively high age and lower thymic function are more sensitive to the influence of disease and chemotherapy. This consideration has also been raised in another of the studies in our lab (W.L., unpublished data, August, 2003), which showed the inverse correlation to be more significant in patients than in healthy donors in same age range. Overall, the sjTREC level before AHSCT may be superior to age as a predictor of posttransplantation thymopoiesis.
We found that patients who had not undergone cancer chemotherapy had a statistically significantly higher mean number of sjTRECs than others. This result implied that additional to the age and genetic determinants, the chemotherapy prior to transplantation is another factor which affects sjTREC levels.
After transplantation, most recipients in both groups experienced a period of immunodeficiency with almost undetectable sjTREC and a highly skewed pattern of TCRβ repertoire. These results agree with the observations of other groups3,9,10 and reflect mainly the inhibition of thymopoiesis caused by immunosuppressive therapy before transplantation. The sjTREC count rose at month 2 in group 1, but did not rise until month 4 in group 2. The TCRβ repertoire diversity score started to increase at 3 months in group 1 but remained low in group 2. The sjTREC level returned to normal after 6 months in group 1 but only after 10 months in group 2. At the 6-month time point, a gaussianlike pattern of TCRβ repertoire was observed in the majority of the Vβ subfamilies in all 4 patients tested in group 1. The average SCS of group 1 patients was close to the average SCS before transplantation. In group 2 patients, however, a skewed pattern of Vβ repertoire was retained in 2 of 4 patients. Overall, patients who had normal levels of sjTREC before transplantation had higher sjTREC counts and a more diverse TCRβ repertoire after transplantation. These results strongly indicate that the patients with normal pretransplantation TREC values underwent much more rapid and efficient thymus-dependent T-cell reconstitution. It suggests that the recipient's thymus status prior to transplantation determines the pace and the extent of recovery of the thymopoiesis after AHSCT.
Up to now, there has been no uniformly standardized assay for evaluation of TRECs and, therefore, no clearly defined demarcation between normal and low TREC counts. In this study, the lowest sjTREC value in healthy donors was 1200 copies/mL blood. We therefore chose this value as the threshold level for normal versus low counts and to assign the patients to different groups. Sixteen of 26 patients had pretransplantation sjTREC levels above this value, and 10 had levels below this value.
We determined the TCRβ repertoires in 8 patients (4 cases from each group) before AHSCT. All showed a gaussianlike distribution of TCRβ repertoires, and the mean SCS showed no significant difference between the 2 groups. This finding indicates that despite relatively low thymus function prior to transplantation, patients in group 2 had sufficient activity to generate a complete TCR repertoire and did not have inherently compromised thymopoiesis. We observed 2 patients with low pre-sjTRECs levels who developed a gaussianlike distribution of TCRβ repertoire at 6 months, yet their sjTREC levels remained low (157 and 450 copies/mL blood). One possible explanation for this observation is peripheral reconstitution of the TCR repertoire. Another possibility is that a thymus with low function can still regenerate T cells, but at a relatively slow pace. The latter possibility is supported by the observation that patients with low sjTREC levels before AHSCT generated complete TCRβ repertoires.
We also studied the variation of T-cell numbers along with the sjTREC production in the patients prior to transplantation and during the 8 months after transplantation. The patients with normal pre-AHSCT TREC value had CD3+, CD4+, or CD8+ T-cell numbers within the normal range before transplantation, while patients in the other group had numbers below the normal range in all T-cell populations tested. This result corresponds to the sjTREC level before transplantation and further supports the difference in thymus function between the 2 groups.
At the first month after transplantation, the T-cell numbers of both groups were dramatically decreased, but the numbers in group 1 were higher than those in group 2. One possibility is that peripheral T cells remained in group 1, given the low sjTREC numbers at that time point. Although the T-cell numbers started to increase during the second month in both groups, patients whose pretransplantation TREC counts were normal had T-cell counts several times those observed in the other group. However, the sjTREC numbers increased only in group 1 at that time point. This finding implies that at the second month, thymus-dependent T-cell proliferation had already occurred in group 1, while mature T-cell expansion was dominant in the group 2 until month 4. The slight difference of T-cell numbers between 2 groups remained for the duration of the study period. Because T-cell numbers are influenced by both thymus-dependent T-cell production and peripheral proliferation of mature T cells, there was no statistically significant difference in the numbers between the 2 groups during the posttransplantation period. However, the significant differences between the 2 groups in the rate and the extent at which sjTRECs increased suggest that thymus-dependent T-cell production was dominant after AHSCT in the patients with normal pretransplantation TREC values. We noticed that in both groups, the CD4/CD8 ratio rebounded to greater than 1 at 4 months. It is possible that some of CD8+ cells in group 1 were thymus-dependent naive cells.
Before the transplantation, the NK (CD56+/CD16+/CD3-) cell numbers in both groups were abnormally low, but the number was slightly higher in group 1. The NK cell numbers in both groups were dramatically increased at the first month after AHSCT. This result agrees with the reports of other researchers.22 During the subsequent 7 months, the mean numbers of NK cells were in the normal range in both groups, suggesting that distinct thymus functions in the 2 groups did not influence NK cell production in the periphery.
Prior to transplantation, B-cell numbers were normal in patients with normal pretransplantation TREC value, but very low in the other group. After the immunosuppression during the first month, B-cell numbers rebounded to the normal range at the second month in group 1 and at the third month in group 2. These results imply that thymus function not only determines the rate of T-cell recovery but also influences the recovery of B cells.
Most patients in both groups had full donor chimerism after transplantation, especially the group with low sjTRECs before transplantation. This result indicated that effective overall engraftment was not the main cause of early T-cell reconstitution in this study. Six of 16 patients with normal sjTRECs before transplantation showed mixed chimerism after the first month after AHSCT. Donor cells, however, dominated (mean, 90%-95%; Table 3; Figure 6) throughout a 12-month period, suggesting that thymus-dependent T cells were reconstituted mainly from donor progenitors. Slightly mixed chimerism indicated that some of the reconstituted T-cell compartments were derived from the host. Because all patients in both groups experienced a period of immunodeficiency with almost undetectable TRECs and showed 100% donor cell engraftment at the first month after transplantation, we believe that thymus-dependent T cells were newly reconstituted after transplantation and therefore should be counted in the pace of the reconstitution despite their possible origin from the recipient's progenitors. The mixed chimerism has been observed in both adults and children by other groups.22 In adult patients, mixed chimerism is reportedly associated with graft rejection and a high frequency of disease relapse. However, these associations have not been found in pediatric patients.22 In the present study, mixed chimerism was found mainly in the group of patients with normal pretransplantation TREC values, a group that had successful engraftment and a lower rate of disease relapse (X.C., unpublished data, June 2002, which showed 6% of patients in group 1 developed relapse versus 20% in group 2; notably, the patients in group 1 survived after relapse, while the patients in group 2 died after relapse).
In conclusion, the rate of reconstitution of thymus-dependent T cells is proportional to thymic competence before transplantation. Therefore, assessment of pretransplantation sjTREC levels might help to predict the pace of T-cell reconstitution after transplantation and thereby offer a tool to improve clinical management.
Prepublished online as Blood First Edition Paper, September 9, 2004; DOI 10.1182/blood-2004-04-1405.
Supported in part by the Assisi Foundation of Memphis and the American Lebanese Syrian Associated Charities (ALSAC).
X.C. and R.B. contributed equally to this work.
The publication costs of this article were defrayed in part by page charge payment. Therefore, and solely to indicate this fact, this article is hereby marked “advertisement” in accordance with 18 U.S.C. section 1734.
We thank all scientists, physicians, and nurses in the Division of Stem Cell Transplantation for their contribution to this study. We also thank the scientists in the Department of Pathology and in the Hartwell Center at St Jude Children's Research Hospital for performing the assays of chimerism and flow cytometry, and for making the primers used in this study.

