Abstract
ETS2 and ERG are transcription factors, encoded on human chromosome 21 (Hsa21), that have been implicated in human cancer. People with Down syndrome (DS), who are trisomic for Hsa21, are predisposed to acute megakaryoblastic leukemia (AMKL). DS-AMKL blasts harbor a mutation in GATA1, which leads to loss of full-length protein but expression of the GATA-1s isoform. To assess the consequences of ETS protein misexpression on megakaryopoiesis, we expressed ETS2, ERG, and the related protein FLI-1 in wild-type and Gata1 mutant murine fetal liver progenitors. These studies revealed that ETS2, ERG, and FLI-1 facilitated the expansion of megakaryocytes from wild-type, Gata1-knockdown, and Gata1s knockin progenitors, but none of the genes could overcome the differentiation block characteristic of the Gata1-knockdown megakaryocytes. Although overexpression of ETS proteins increased the proportion of CD41+ cells generated from Gata1s-knockin progenitors, their expression led to a significant reduction in the more mature CD42 fraction. Serial replating assays revealed that overexpression of ERG or FLI-1 immortalized Gata1-knockdown and Gata1s knockin, but not wild-type, fetal liver progenitors. Immortalization was accompanied by activation of the JAK/STAT pathway, commonly seen in megakaryocytic malignancies. These findings provide evidence for synergy between alterations in GATA-1 and overexpression of ETS proteins in aberrant megakaryopoiesis.
Introduction
Megakaryopoiesis is regulated by a complex interplay of transcription factors, including GATA-1 and ETS proteins. Many megakaryocyte-specific promoters harbor coupled GATA-ETS motifs, suggesting that these families of proteins cooperate to promote terminal differentiation of megakaryocytes.1-4 Moreover, ETS proteins, including ETS2, ERG, and FLI-1, mediate lineage commitment by promoting megakaryopoiesis at the expense of erythropoiesis.5-8
ETS2 and ERG, 2 members of the ETS family of transcription factors, are oncogenes that have been implicated in various types of neoplasia, including prostate and breast cancer as well as leukemia.9-11 ETS2 and ERG are encoded by adjacent genes on Hsa21 and are similarly arranged on the mouse homologous region of chromosome 16 (Mmu16). High expression of ERG is a poor prognostic indicator in both acute myeloid leukemia (AML) and acute lymphoid leukemia (ALL),12,13 and high levels of both ERG and ETS2 mRNAs have been observed in AML patients with complex karyotypes and abnormal chromosome 21.14 With respect to normal hematopoiesis, a recent study has shown that ERG is required for definitive hematopoiesis and for maintenance of proper platelet numbers.15 Alterations in the closely related ETS protein FLI-1 are also associated with malignant transformation, including Ewing sarcoma and erythroleukemia.16,17
Whereas altered expression or translocations of ETS proteins are associated with a variety of tumors, mutations in GATA1 are specifically found in the myeloid leukemia of Down syndrome (DS). Children with DS face a 500-fold increased risk for acute megakaryoblastic leukemia (AMKL), which is characterized by an expansion of immature megakaryocyte progenitors that harbor mutations in GATA1.18,19 Infants with DS are also uniquely affected by transient myeloproliferative disorder (TMD), an expansion of immature GATA1 mutant megakaryoblasts, that often undergoes spontaneous remission.20,21 Although TMD is diagnosed in less than 1% of neonates with DS, it is estimated to affect between 4% to 10% of these newborns.20,22 In both disorders, mutations in GATA1 block expression of the full-length protein, but allow for expression of a shorter isoform, GATA-1s.21 Although GATA-1s can substitute for GATA-1 in most aspects of megakaryocyte terminal maturation, it fails to rescue the excessive proliferation of megakaryocyte progenitors.23-25 Gata1s knockin mice (Gata1Δex2), which express GATA-1s in place of full-length GATA-1, exhibit a transient expansion of megakaryocytes within the fetal liver.25 Humans with somatic GATA1 mutations that lead to the exclusive production of GATA-1s suffer from defects in the erythroid and megakaryocytic lineages, but do not develop leukemia.26 Taken together, these studies reveal that GATA1 mutations contribute to aberrant proliferation of fetal megakaryocyte progenitors, but are not sufficient for the development of leukemia.
To study how ETS family members affect development of megakaryocytes from wild-type and Gata1 mutant hematopoietic progenitors, we ectopically expressed these factors in fetal liver progenitors and assessed the consequences on megakaryocyte development. Here we show that ERG and FLI-1, and to a lesser extent ETS2, each potently induce expansion of megakaryocytes in liquid culture and colony assays. Overexpression of ETS proteins, however, failed to rescue the differentiation block caused by loss of GATA-1. Furthermore, we demonstrate that ectopic expression of ERG and FLI-1 immortalize Gata1-knockdown and Gata1s knockin, but not wild-type, fetal liver progenitors. ERG and FLI-1 also induce similar changes in gene expression within Gata1-knockdown progenitors in a manner that is distinct from that of ETS2. Finally, we show that both ERG and FLI-1 enhance JAK/STAT signaling in immortalized Gata1-knockdown fetal liver progenitors, providing a likely mechanism by which ETS proteins drive immortalization. These results reveal that there is robust synergy between alterations in GATA-1 activity and overexpression of ETS proteins. Moreover, the effect of ETS proteins varied depending on whether megakaryocytes expressed full-length, the short GATA-1 isoform (GATA-1s), or no GATA-1 protein. We conclude that an increased dosage of ETS proteins can significantly alter megakaryopoiesis independent of GATA-1 status, but that alterations in GATA-1 contribute to these effects on growth and differentiation.
Methods
Isolation and culture of megakaryocytes
Fetal livers were isolated from E12.5 or E13.5 wild-type (C57Bl/6), Gata1s knockin (Gata1Δex2), and Gata1-knockdown (Gata1ΔneoΔHS) mice. Single-cell suspensions of disaggregated fetal livers were subjected to lineage antigen depletion using a kit purchased from StemCell Technologies (Vancouver, BC) or custom cocktail including antibodies against CD45, CD5, GR1, Ter119, and CD8a. For expansion of fetal liver progenitors, cells were maintained in a serum-free expansion media during retroviral transduction as previously described.23 To promote megakaryopoiesis, cells were removed from expansion media and placed in differentiation media composed of RPMI 1640 with 10% fetal calf serum, penicillin/streptomycin, SCF-conditioned media (1/100), and TPO (10 ng/mL; R&D Systems, Minneapolis, MN) for 72 hours. For the quantitative reverse-transcription–polymerase chain reaction (qRT-PCR) studies in Figure S1 (available on the Blood website; see the Supplemental Materials link at the top of the online article), megakaryocytes were enriched by passing through a 1.5%/3% discontinuous bovine serum albumin (BSA) gradient before isolating RNA.
Retroviral transduction
Lineage-depleted fetal liver progenitors were infected by the spinoculation method and cultured as previously described.23 Protein expression for ERG and ETS2 from the MIGR1 construct was confirmed by Western blotting (Figure S1) with antibodies from Santa Cruz Biotechnology (Santa Cruz, CA; anti-ERG sc-354, anti-ETS2 sc-351) and FLI-1 expression was confirmed by qRT-PCR (data not shown).
Flow cytometry
Cells were stained for surface marker expression and DNA content as previously described.27 The antibodies used included rat anti-CD41 antibody PE conjugate (BD Biosciences, San Jose, CA), rat anti–mouse CD42 PE conjugate (EMFRET, Würzburg, Germany), and rat anti–mouse c-kit-APC conjugate (BD Biosciences). For DNA content analysis, cells were stained with 1 μg/mL DAPI (Sigma-Aldrich, St Louis, MO). To analyze intracellular STAT phosphorylation, cells were isolated from methylcellulose after 4 weeks of culture, and washed and incubated in RPMI with Nutridoma SP, IL-3, IL-6, IL-11, and TPO with and without JAK inhibitor 1 (Calbiochem, San Diego, CA) for a minimum of 2 hours before start of fixation. Cells were then washed, fixed in 2% paraformaldehyde, and stained with mouse anti–phospho-Stat5 (Alexa Fluor 647; BD Biosciences) or mouse anti–phospho-Stat3-PE conjugate (BD Biosciences). Acquisition of data for the cell-surface markers, DNA content, and the intracellular flow was performed with a LSRII flow cytometer (BD Biosciences, San Jose, CA). All flow data were analyzed with FlowJo software (TreeStar, Ashland, OR). Sorting of GFP-positive cells was performed with a MoFlo high-speed sorter (DakoCytomation, Fort Collins, CO).
qRT-PCR
For Figures 1D and 2D, RNA was isolated from infected wild-type or Gata1-knockdown fetal liver progenitors sorted for GFP expression 24 hours after the second spinoculation using Trizol (Invitrogen, Carlsbad, CA) according to the manufacturer's instructions. RNAs for gene expression profiling were isolated from immortalized cells with the QIAGEN RNeasy Plus mini kit (Germantown, MD). For qRT-PCR, cDNA was generated using Superscript III Reverse Transcriptase (Invitrogen). qRT-PCR was performed as described previously.23 All expression values were normalized to GAPDH (glyceraldehyde-3-phosphate dehydrogenase). Primer sequences are either published23,27,28 or provided in Table S1. For each analysis, 3 separate experiments were performed, and each qPCR was run in triplicate. The Student t test was used for the statistical analyses (2-tailed distribution with the assumption of equal variance).
Colony assays
For colony assays in Figure 5, sorted GFP-positive cells infected with MIGR1, MIGR1-ETS2, or MIRG1-ERG were plated in Megacult-C (StemCell Technologies) supplemented with IL-3, IL-6, IL-11, and TPO following the manufacturer's instructions. After 7 days, slides were dehydrated and stained for acetylcholinesterase per the manufacturer's instructions. For serial replating assays, 10 000 wild-type or 5000 Gata1-knockdown or Gata1s knockin GFP-positive transduced cells were plated in Methocult 3234 (StemCell Technologies) supplemented with IL-3, IL-6, IL-11, and TPO (R&D Systems). After each week, cells were collected in media, washed, counted, and replated at the same amounts as the initial plating in fresh methylcellulose. To increase the number of cells surviving in the MIGR1-transduced Gata1-knockdown cultures for the preparation of RNA for gene array studies, all cells were replated after the initial plating of 5000 GFP-positive cells.
Expression profiling
Cells from the fourth replating were collected from methylcellulose and RNAs for gene expression profiling were isolated with the QIAGEN RNeasy Plus mini kit. The integrity of the RNA samples was verified before amplification/hybridization with an Agilent 2100 bioanalyzer (Santa Clara, CA). The samples were hybridized to the Illumina Mouse Ref8v1.1 Expression Beadchip Array following the manufacturer's instructions (San Diego, CA). The Bioconductor lumi package29,30 (Fred Hutchinson Cancer Research Center, Seattle, WA) was used to analyze the data. To remove batch effects, the complete data set was normalized by the quantile method. Before statistical analysis, the probe sets were filtered by present/absent calls using the Wilcoxon signed rank-based algorithm. Of the 24 613 genes, 13 227 were retained and the remaining ones were removed as “absent” to reduce the false-positive rate. The lists of differentially expressed genes were generated by fitting linear models to the normalized expression values. The empirical Bayes shrinkage model31 was applied to t-statistics using the lumi package, which integrates the limma package, in Bioconductor. Because batch effects were still observed after quantile normalization, 14 balanced samples from the same batch were selected to identify significantly differentially expressed genes and to reduce the potential artifacts. Gene ontology analysis of these genes was also performed by the lumi package. For principal component analysis, the multidimensional scaling algorithm32 was adopted to describe the relationship between samples. The analysis was based on 13 079 genes identified as “present” after batch effects removal. Gene array data can be accessed through the Gene Expression Omnibus database (series GSE14506).33
Mice
Gata1-knockdown mice (Gata1ΔneoΔHS strain) harbor a targeted deletion of a DNase I–hypersensitive site between the 2 GATA-1 promoters, and as a consequence, fail to express detectable GATA-1 in megakaryocytes but express normal levels in the erythroid lineage.34 Gata1s knockin mice (Gata1Δex2), which express GATA-1s in place of GATA-1,25 were obtained from Dr Stuart Orkin (Children's Hospital of Boston, Boston, MA). Wild-type C57Bl/6 mice were purchased from The Jackson Laboratory (Bar Harbor, ME). Animal studies were approved by the University of Chicago (Chicago, IL) and Northwestern University Institutional Animal Care and Use Committees.
Constructs
ERG (also known as ERG1; NM_182918) cDNA was isolated from human bone marrow Marathon Ready cDNA (purchased from Clontech, Mountain View, CA) by PCR and subcloned into the retroviral vector MIGR1. hETS2 (NM_005238) was amplified from the pCMVsport plasmid containing hETS2 cDNA (Invitrogen) by PCR and subcloned into the MIGR1 plasmid. mFli1 was subcloned into MIGR1. All constructs were verified by DNA sequencing. Accession numbers for protein BLAST35 for homology comparison were NP_891548.1 for human ERG1 and NP_002008 for human FLI1.
Results
Overexpression of ETS2 or ERG promotes megakaryopoiesis in wild-type, Gata1-knockdown, and Gata1s knockin fetal liver progenitors
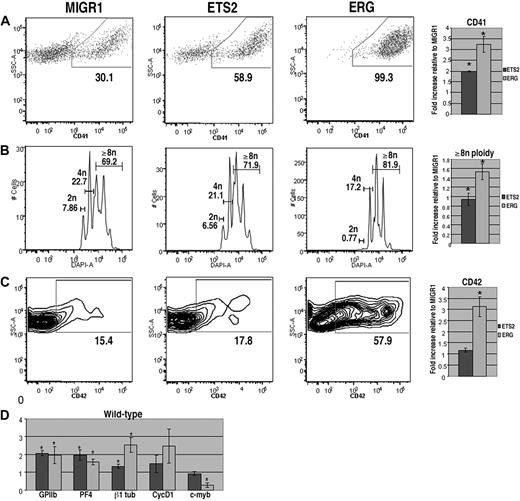
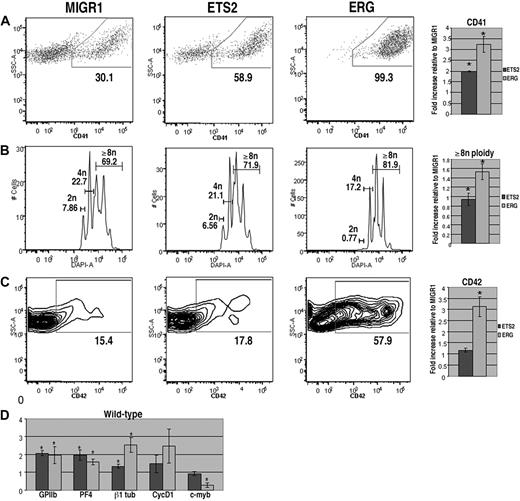
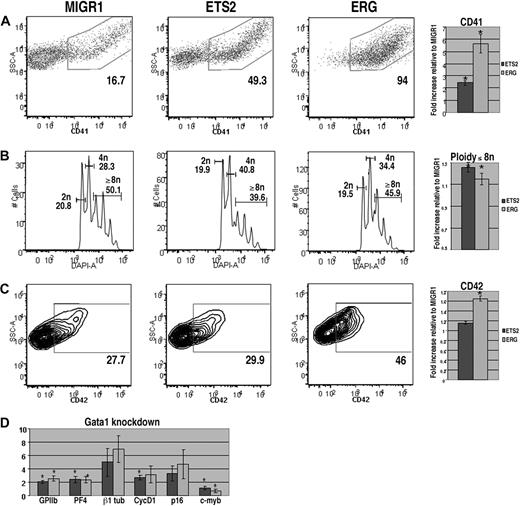
To assess the effects of overexpression of ETS2 or ERG on megakaryopoiesis, lineage-depleted wild-type E12.5 to E13.5 fetal liver hematopoietic progenitors were transduced with the MIGR1 vector (GFP alone), MIGR1-ETS2, or MIGR1-ERG. Transduced cells were cultured in megakaryocyte differentiation media for 72 hours and stained for the megakaryocyte markers CD41 and CD42 and for DNA content, and the GFP-positive populations were analyzed by flow cytometry. We found that cultures overexpressing either ETS2 or ERG demonstrated significantly increased proportions of CD41+ cells in comparison with GFP control cultures (Figure 1A). This effect was most pronounced in cells transduced with ERG, as nearly 100% of GFP-positive cells expressed CD41. In addition, megakaryocyte polyploidization was dramatically affected by ERG overexpression, with a prominent decrease in 2N cells and a concomitant increase in cells with 8N or greater DNA content (Figure 1B). CD42, a marker of more mature megakaryocytes, was also significantly up-regulated by ERG expression (Figure 1C). Although ETS2 induced a 2-fold increase in the abundance of CD41+ cells, it did not affect CD42 expression or polyploidization, suggesting that ETS2 promotes earlier stages of megakaryopoiesis, whereas ERG has a strong positive effect on all phases of megakaryocyte development.
ERG and ETS promote megakaryopoiesis in wild-type fetal liver progenitors. (A) Fetal liver cells transduced with MIGR1, MIGR1-ETS2, or MIGR1-ERG were differentiated for 72 hours and the GFP+ fraction was assessed for CD41 expression by flow cytometry. (B) The degree of polyploidization was determined by DAPI staining of GFP, CD41 double-positive differentiated fetal liver cells. (C) CD42 expression within the GFP-positive population was assessed by flow cytometry. Fold changes for CD41, percentage of cells with DNA content of 8N or more, and CD42 expression in the transduced cells relative to MIGR1 control-infected cells are shown to the right of the representative flow plots. Graphs display average fold changes plus or minus standard error. * P less than .02. For all experiments, n = 4. (D) qRT-PCR analysis of expression of genes that characterize megakaryocyte maturation in wild-type lineage-depleted fetal liver hematopoietic progenitors transduced with MIGR1, MIGR1-ETS2, and MIGR1-ERG. Data depict mean plus or minus standard error for a minimum of 3 independent experiments performed in triplicate. * P less than .05.
ERG and ETS promote megakaryopoiesis in wild-type fetal liver progenitors. (A) Fetal liver cells transduced with MIGR1, MIGR1-ETS2, or MIGR1-ERG were differentiated for 72 hours and the GFP+ fraction was assessed for CD41 expression by flow cytometry. (B) The degree of polyploidization was determined by DAPI staining of GFP, CD41 double-positive differentiated fetal liver cells. (C) CD42 expression within the GFP-positive population was assessed by flow cytometry. Fold changes for CD41, percentage of cells with DNA content of 8N or more, and CD42 expression in the transduced cells relative to MIGR1 control-infected cells are shown to the right of the representative flow plots. Graphs display average fold changes plus or minus standard error. * P less than .02. For all experiments, n = 4. (D) qRT-PCR analysis of expression of genes that characterize megakaryocyte maturation in wild-type lineage-depleted fetal liver hematopoietic progenitors transduced with MIGR1, MIGR1-ETS2, and MIGR1-ERG. Data depict mean plus or minus standard error for a minimum of 3 independent experiments performed in triplicate. * P less than .05.
ERG shares significant homology with another ETS family member FLI-1 (Friend leukemia integration 1), and for human ERG and FLI-1, the 2 proteins are 63% identical overall, 72% identical in the PNT domain, and 97% identical within the ETS domain (protein BLAST, National Center for Biotechnology Information [NCBI]; Figure S2G). FLI-1 has an established role in megakaryopoiesis as demonstrated by gene ablation studies and work performed in cell line models of megakaryopoiesis.36-40 To determine whether ERG and FLI-1 overlap functionally in their ability to stimulate megakaryopoiesis, we evaluated the effect of FLI-1 overexpression in wild-type fetal liver progenitors (Figure S2A-C). Overexpression of FLI-1 significantly increased CD41 and CD42 expression and also increased the degree of polyploidization in a manner that was nearly identical to that of ectopic ERG. Of note, we found that the endogenous expression of FLI-1 and ETS2 increased during megakaryocyte differentiation of fetal liver progenitors, whereas the level of ERG remained relatively unchanged (Figure S2D,E). Given that ERG levels did not change appreciably, and that FLI-1 is known to promote megakaryopoiesis,41 we hypothesize that ectopic ERG stimulates megakaryocyte differentiation by mimicking FLI-1 activity.
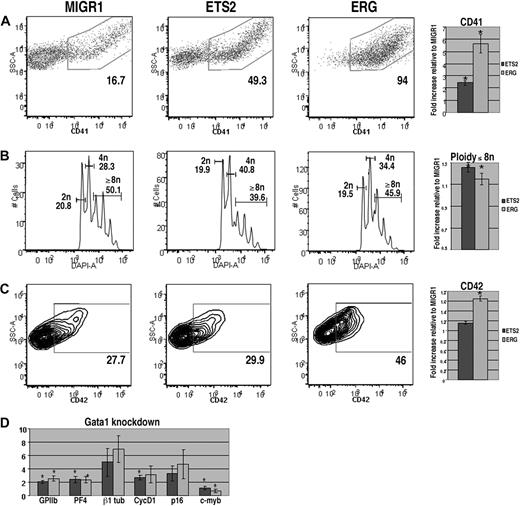
In the absence of GATA-1, megakaryocyte progenitors show reduced CD42 expression, achieve a lower polyploidization state, and give rise to very few platelets, which display multiple abnormalities.34,42 To determine whether ectopic ETS2 or ERG could overcome these deficiencies, we overexpressed each gene in fetal liver cells isolated from Gata1-knockdown mice,34 which do not express GATA-1 in the megakaryocyte lineage. Overexpression of either ERG or ETS2 increased CD41 expression to an even greater extent than that observed in the wild-type background (Figure 2A). In addition, there was a significant increase in the expression of CD42 in the ERG-transduced population. However, in contrast to its effect on wild-type cells, ectopic ERG only minimally altered polyploidization in the Gata1-knockdown megakaryocytes. Thus, although ERG can stimulate the survival or proliferation of megakaryocyte precursors, it cannot rescue the terminal differentiation defects associated with loss of GATA-1, including polyploidization or proplatelet production (Figure 2B and data not shown).
ERG and ETS promote megakaryopoiesis in Gata1-knockdown progenitors but cannot overcome block in maturation associated with a GATA-1 deficiency. (A) Gata1-knockdown fetal liver cells transduced with MIGR1, MIGR1-ETS2, or MIGR1-ERG were differentiated for 72 hours and the GFP+ fraction was assessed for CD41 expression by flow cytometry. (B) The degree of polyploidization was determined by DAPI staining of GFP, CD41 double-positive differentiated fetal liver cells. (C) CD42 expression within the GFP-positive population was assessed by flow cytometry. Fold changes for CD41, percentage of cells with DNA content of 8N or more, and CD42 expression in the transduced cells relative to MIGR1 control-infected cells are shown to the right of the representative flow plots. Graphs display average fold changes plus or minus SE. * P less than .01. For all experiments, n = 4. (D) qRT-PCR analysis of expression of genes that characterize megakaryocyte maturation in Gata1-knockdown lineage-depleted fetal liver hematopoietic progenitors transduced with MIGR1, MIGR1-ETS2, and MIGR1-ERG. Data depict mean plus or minus SE for a minimum of 3 independent experiments performed in triplicate. * P less than .05.
ERG and ETS promote megakaryopoiesis in Gata1-knockdown progenitors but cannot overcome block in maturation associated with a GATA-1 deficiency. (A) Gata1-knockdown fetal liver cells transduced with MIGR1, MIGR1-ETS2, or MIGR1-ERG were differentiated for 72 hours and the GFP+ fraction was assessed for CD41 expression by flow cytometry. (B) The degree of polyploidization was determined by DAPI staining of GFP, CD41 double-positive differentiated fetal liver cells. (C) CD42 expression within the GFP-positive population was assessed by flow cytometry. Fold changes for CD41, percentage of cells with DNA content of 8N or more, and CD42 expression in the transduced cells relative to MIGR1 control-infected cells are shown to the right of the representative flow plots. Graphs display average fold changes plus or minus SE. * P less than .01. For all experiments, n = 4. (D) qRT-PCR analysis of expression of genes that characterize megakaryocyte maturation in Gata1-knockdown lineage-depleted fetal liver hematopoietic progenitors transduced with MIGR1, MIGR1-ETS2, and MIGR1-ERG. Data depict mean plus or minus SE for a minimum of 3 independent experiments performed in triplicate. * P less than .05.
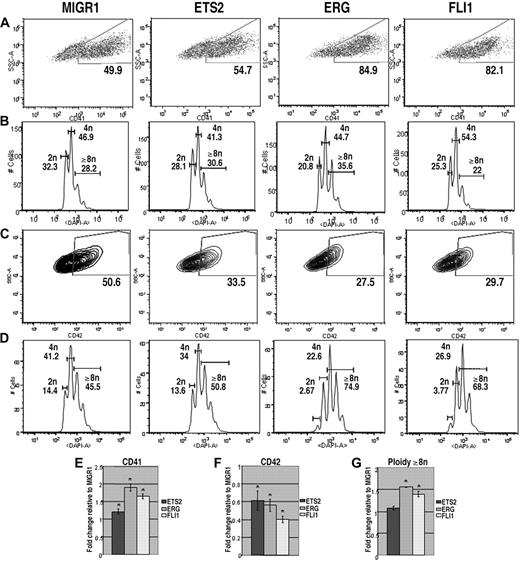
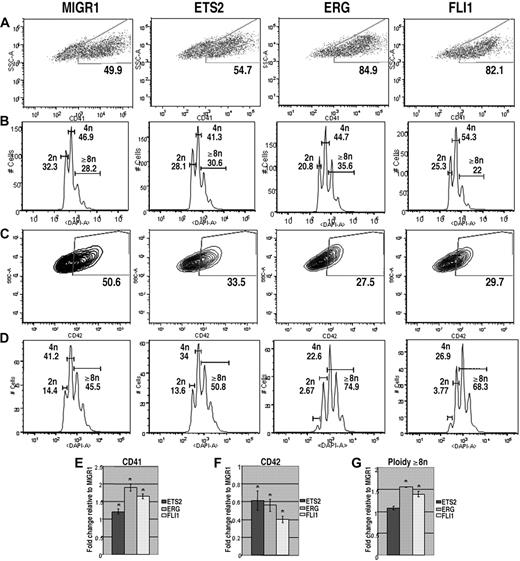
Malignant cells in children with TMD and DS-AMKL express only the GATA-1s isoform of GATA-1. Previous studies have shown that GATA-1s can rescue most of the differentiation defects of GATA-1–deficient megakaryocytes, but that fetal liver megakaryocyte progenitors continue to proliferate excessively.23,24 Moreover, experiments with the Gata1s knockin strain demonstrated that GATA-1s can promote terminal maturation of megakaryocytes, but that its exclusive expression causes a transient expansion of megakaryocytes in the fetal liver.25 To determine how overexpression of ETS proteins affected growth and differentiation of cells that express only GATA-1s, we repeated the liquid culture differentiation experiments with Gata1s knockin progenitors. Similar to the results for Gata1-knockdown progenitors, overexpression of ERG and FLI-1 significantly increased the proportion of CD41+ cells and had only modest affects on polyploidization (Figure 3A,B). Surprisingly, overexpression of ETS2, ERG, or FLI-1 resulted in a decrease in the extent of CD42 expression in the Gata1s knockin cells, although overexpression of ERG and FLI1 led to a significant increase in polyploidization within the CD42-positive population. These intriguing results suggest that overexpression of ERG and FLI-1 drive a subset of Gata1s knockin cells to undergo terminal maturation (as evidenced by increased polyploidization in the CD42+ fraction), but overall reduce the extent of differentiation of GATA-1s–expressing mutant cells. Together, these results show that Gata1s knockin progenitors respond to elevated expression of ETS proteins in a manner distinct from wild-type or Gata1-knockdown cells.
ETS2, ERG, and FLI-1 promote megakaryopoiesis in Gata1s knockin progenitors. (A) Gata1s knockin fetal liver cells transduced with MIGR1, MIGR1-ETS2, MIGR1-ERG, or MIGR1-FLI-1 were differentiated for 72 hours and the GFP+ fraction was assessed for CD41 expression by flow cytometry. (B) The degree of polyploidization was determined by DAPI staining of GFP, CD41 double-positive differentiated fetal liver cells. (C) CD42 expression within the GFP-positive population was assessed by flow cytometry. (D) The degree of polyploidization was determined by DAPI staining of GFP, CD42 double-positive differentiated fetal liver cells. Fold changes for CD41 (E), CD42 (F) expression, and percentage of cells with DNA content of 8N or more (G) in the transduced cells relative to MIGR1 control-infected cells are shown below the representative flow plots. Graphs display average fold changes plus or minus SE. * P less than or equal to .03. For all experiments, n = 3.
ETS2, ERG, and FLI-1 promote megakaryopoiesis in Gata1s knockin progenitors. (A) Gata1s knockin fetal liver cells transduced with MIGR1, MIGR1-ETS2, MIGR1-ERG, or MIGR1-FLI-1 were differentiated for 72 hours and the GFP+ fraction was assessed for CD41 expression by flow cytometry. (B) The degree of polyploidization was determined by DAPI staining of GFP, CD41 double-positive differentiated fetal liver cells. (C) CD42 expression within the GFP-positive population was assessed by flow cytometry. (D) The degree of polyploidization was determined by DAPI staining of GFP, CD42 double-positive differentiated fetal liver cells. Fold changes for CD41 (E), CD42 (F) expression, and percentage of cells with DNA content of 8N or more (G) in the transduced cells relative to MIGR1 control-infected cells are shown below the representative flow plots. Graphs display average fold changes plus or minus SE. * P less than or equal to .03. For all experiments, n = 3.
ETS2 and ERG promote megakaryocyte gene expression
To study the effects of ETS2 and ERG on gene expression, we extracted mRNA from GFP+ cells purified from wild-type or Gata1-knockdown progenitors transduced with GFP alone, ETS2, or ERG. Next, we assessed changes in expression of megakaryocytic-specific genes as well as several cell-cycle and transcriptional regulators implicated in late-stage megakaryocyte development (Figures 1D, 2D). qRT-PCR analysis revealed that several megakaryocytic genes, including GPIIB, PF4, and β1-tubulin, were significantly up-regulated by ETS2 and ERG in both wild-type and Gata1-knockdown cells in comparison with the MIGR1-transduced cells. These findings are consistent with the effects of ETS family overexpression seen in the liquid culture studies. In analysis of cell-cycle regulators, we found that expression of cyclin D1, which promotes the endomitotic cell cycle,27 was more strongly induced by ERG than ETS2, consistent with the increased polyploidization observed in the ERG-infected cells. Although expression of cyclin D1 was also increased in ETS2- and ERG-transduced Gata1-knockdown cells relative to MIGR1-infected cells, p16, which has a potent inhibitory effect on polyploidization27 was also strongly induced. Finally, expression of c-myb was significantly reduced upon ERG overexpression in both wild-type and Gata1-knockdown cells. Given that low levels of c-myb favor megakaryopoiesis,43 we surmise that the potent promegakaryocytic effect of ERG may in part be mediated by inhibition of c-myb expression.
ETS2 and ERG stimulate CFU-Mk formation in wild-type cells
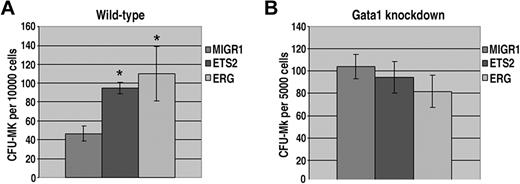
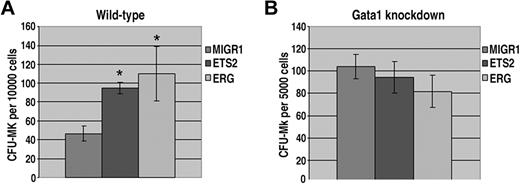
Our liquid culture studies demonstrated that ERG and ETS2 have potent promegakaryocytic effects in fetal liver hematopoietic progenitors. To determine whether overexpression of ETS2 or ERG promotes megakaryopoiesis by increasing progenitor numbers, we next performed colony-forming unit megakaryocyte (CFU-Mk) assays. Enumeration of megakaryocytes revealed a significant increase in CFU-Mk's for both ETS2- and ERG-transduced wild-type progenitors (Figure 4A). In contrast, CFU-Mk assays performed with ETS2- or ERG-transduced Gata1-knockdown progenitors showed no differences in megakaryocyte colony numbers compared with the MIGR1 construct (Figure 4B). Given that Gata1-knockdown fetal livers give rise to a far greater number of megakaryocyte colonies than their wild-type counterparts,33,42 it is likely that the effects of ETS2 and ERG overexpression on megakaryocyte commitment are masked by the already dramatic effects of GATA-1 deficiency on the megakaryocyte lineage. These findings demonstrate that overexpression of either ETS or ERG in wild-type fetal liver cells increases the number of megakaryocyte progenitors.
ETS2 and ERG promote CFU-Mk formation from wild-type but not Gata1-knockdown progenitors. (A) The number of megakaryocyte colonies generated by GFP+ wild-type fetal liver progenitors transduced with MIGR1, MIGR1-ETS2, or MIGR1-ERG. * P less than .05. (B) The number of megakaryocyte colonies generated by GFP+Gata1-knockdown fetal liver progenitors transduced with MIGR1, MIGR1-ETS2, or MIGR1-ERG. Note that none of the differences are statistically significant.
ETS2 and ERG promote CFU-Mk formation from wild-type but not Gata1-knockdown progenitors. (A) The number of megakaryocyte colonies generated by GFP+ wild-type fetal liver progenitors transduced with MIGR1, MIGR1-ETS2, or MIGR1-ERG. * P less than .05. (B) The number of megakaryocyte colonies generated by GFP+Gata1-knockdown fetal liver progenitors transduced with MIGR1, MIGR1-ETS2, or MIGR1-ERG. Note that none of the differences are statistically significant.
Ectopic ERG, ETS2, and FLI-1 cooperate with alterations in Gata1 to immortalize fetal liver progenitors
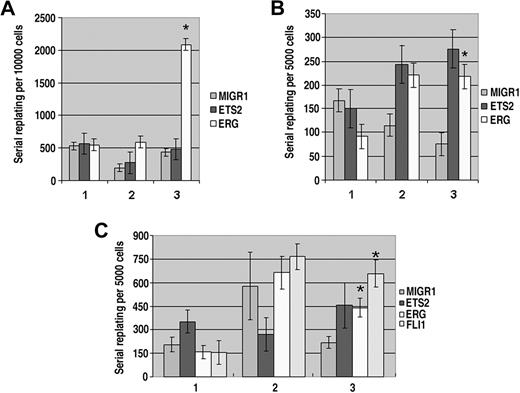
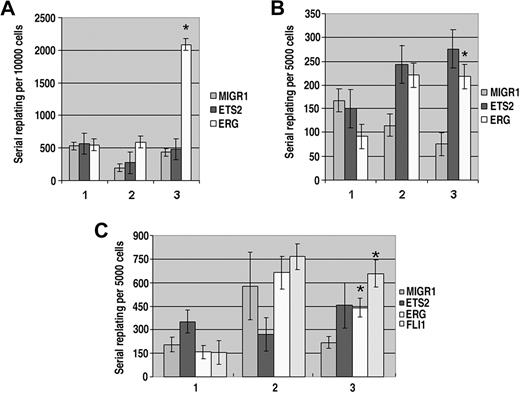
Several studies have suggested that ETS2 and ERG directly contribute to malignant transformation of multiple cell types, including breast, hematopoietic, and prostate cancers.9 To determine whether overexpression of these factors could promote immortalization of hematopoietic progenitors, we performed serial replating assays in vitro. GFP+ sorted fetal liver hematopoietic progenitors from wild-type, Gata1-knockdown, or Gata1s knockin fetal livers infected with MIGR1, MIGR1-ETS2, or MIGR1-ERG were cultured in Methocult supplemented with IL-3, IL-6, IL-11, and TPO. After 7 days, the numbers of total colonies were enumerated and cells were recovered from the methylcellulose, counted, and replated in fresh methylcellulose. This serial replating was continued for 3 to 6 generations. In the wild-type background, only ectopic ERG had a significant effect on colony formation, leading to a dramatic rise in the number of colonies in the third generation (Figure 5A). However, these colonies were small and failed to replate to the fourth generation (data not shown). Thus, ERG has a limited ability to increase the proliferation or survival of wild-type colonies, but is unable to immortalize them in serial replating assays. In sharp contrast, expression of either ETS2 or ERG enhanced colony formation of Gata1-knockdown progenitors in the second and third generations (Figure 5B). More strikingly, in comparison with the few, very small colonies generated in the third generation MIGR1-infected Gata1-knockdown culture, the colonies formed in the ETS2- and ERG-overexpressing cultures were numerous and macroscopic (Figure S3A). Furthermore, ETS2- and ERG-transduced cells showed sustained replating activity through 6 generations (data not shown). Taken together, these results reveal a potent synergy between the loss of GATA-1 and overexpression of ETS2 and ERG that leads to transformation of hematopoietic progenitors.
Overexpression of ETS2 and ERG promote immortalization of Gata1-knockdown and Gata1s knockin fetal liver hematopoietic progenitors. (A) The numbers of total colonies derived from plating sorted GFP+ wild-type fetal liver progenitors transduced with MIGR1, MIGR1-ETS2, or MIGR1-ERG for 3 generations. Ten thousand cells were plated each time. No differences were significant except for the ERG third replating. P value less than .03; n = 3 in all experiments. (B) The numbers of total colonies derived from plating sorted GFP+Gata1-knockdown fetal liver progenitors transduced with MIGR1, MIGR1-ETS2, or MIGR1-ERG for 3 generations. Five thousand cells were plated each time. * P less than .05. (C) The numbers of total colonies derived from plating sorted GFP+Gata1s knockin fetal liver progenitors transduced with MIGR1, MIGR1-ETS2, MIGR1-ERG, or MIGR1-FLI1 for 3 generations. Five thousand cells were plated each time. * P less than or equal to .05.
Overexpression of ETS2 and ERG promote immortalization of Gata1-knockdown and Gata1s knockin fetal liver hematopoietic progenitors. (A) The numbers of total colonies derived from plating sorted GFP+ wild-type fetal liver progenitors transduced with MIGR1, MIGR1-ETS2, or MIGR1-ERG for 3 generations. Ten thousand cells were plated each time. No differences were significant except for the ERG third replating. P value less than .03; n = 3 in all experiments. (B) The numbers of total colonies derived from plating sorted GFP+Gata1-knockdown fetal liver progenitors transduced with MIGR1, MIGR1-ETS2, or MIGR1-ERG for 3 generations. Five thousand cells were plated each time. * P less than .05. (C) The numbers of total colonies derived from plating sorted GFP+Gata1s knockin fetal liver progenitors transduced with MIGR1, MIGR1-ETS2, MIGR1-ERG, or MIGR1-FLI1 for 3 generations. Five thousand cells were plated each time. * P less than or equal to .05.
Because FLI-1 overexpression affected megakaryocyte expansion in a manner very similar to ERG, we next assayed whether its expression could promote immortalization of Gata1-knockdown fetal liver progenitors. We determined that overexpression of FLI-1, like ERG and ETS2, resulted in an increase in colony number/size through 4 generations (data not shown).
Serial replating assays conducted with the Gata1s knockin fetal liver progenitors resulted in an intermediate phenotype
Overexpression of ERG or FLI-1 consistently resulted in the generation of macroscopic colonies and replating through at least 4 generations (Figure 5C and Figure S3B). Surprisingly, however, overexpression of ETS2 did not lead to consistent replating or generation of macroscopic colonies. These results show that ERG and FLI-1 have the greatest ability to immortalize hematopoietic progenitors and that expression of GATA-1s does not prevent (or facilitate) immortalization mediated by ERG and FLI-1.
Overlapping gene expression profiles in ETS2-, ERG-, and FLI-1–immortalized Gata1-knockdown cells
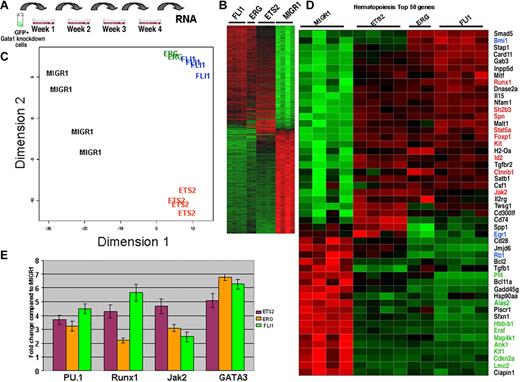
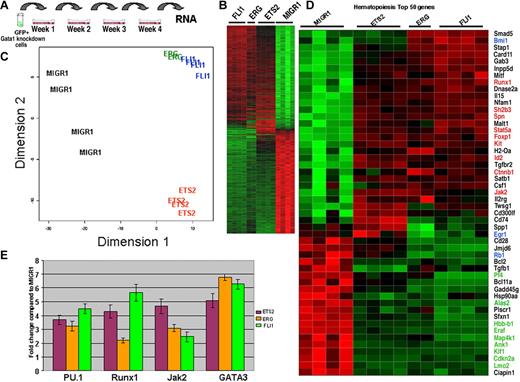
As shown in Figure 5, we observed immortalization of Gata1-knockdown fetal liver progenitors by ectopic expression of ETS2, ERG, or FLI-1. To investigate how these proteins drive immortalization of Gata1-deficient progenitors, we performed genome-wide expression profiling using RNA isolated from cells within the fourth-generation methylcellulose cultures (Figure 6A). To obtain sufficient RNA from the MIGR1 Gata1-knockdown control sample, we replated all cells at every generation. RNA from these cells was reverse transcribed and the resultant labeled cDNA was used to probe the Illumina Mouse Ref8v1.1 array. Unsupervised hierarchic clustering, using the criteria of more than 2-fold change, a FDR less than 0.01, and a P value less than .001, revealed that 726 genes were differentially expressed in FLI-1-, ERG-, ETS2-immortalized cells compared with MIGR1 control cells (Figure 6B; Table S1). Principal component analysis revealed that the ERG and FLI-1 gene expression patterns clustered tightly with one another and were well separated from both the MIGR1 and ETS2 signatures (Figure 6C).
Expression profiling reveals that ERG and FLI-1 have signatures that are distinct from both ETS2 and MIGR1. (A) RNA for genome-wide expression profiling was extracted from fourth-generation Gata1-knockdown colonies transduced with the MIGR1, MIGR1-ERG, MIGR1-ETS2, and MIGR1-FLI-1. (B) Heat map generated by unsupervised hierarchic clustering reveals that 726 genes discriminate ETS2-, ERG-, and FLI1-overexpressing colonies from MIGR1-transduced cells. (C) Principal component analysis reveals that the ERG and FLI-1 signatures are close to each other and are well separated from MIGR1 and ETS2. This implies that ERG and FLI-1 are more similar to each other than to MIGR1. (D) Heat map showing the top 50 hematopoiesis genes that are differentially expressed in the samples. Red indicates increased expression by 2-fold or more, whereas green depicts decreased expression by 2-fold or more. Genes within blue boxes are those whose expression differs among the ETS family–transduced cells. (E) qRT-PCR confirmation of several differentially expressed genes in the colonies derived from Gata1-knockdown fetal liver hematopoietic cells. Graph depicts mean plus or minus SE for a minimum of 3 independent experiments performed in triplicate. All differences are significant at the 5% level.
Expression profiling reveals that ERG and FLI-1 have signatures that are distinct from both ETS2 and MIGR1. (A) RNA for genome-wide expression profiling was extracted from fourth-generation Gata1-knockdown colonies transduced with the MIGR1, MIGR1-ERG, MIGR1-ETS2, and MIGR1-FLI-1. (B) Heat map generated by unsupervised hierarchic clustering reveals that 726 genes discriminate ETS2-, ERG-, and FLI1-overexpressing colonies from MIGR1-transduced cells. (C) Principal component analysis reveals that the ERG and FLI-1 signatures are close to each other and are well separated from MIGR1 and ETS2. This implies that ERG and FLI-1 are more similar to each other than to MIGR1. (D) Heat map showing the top 50 hematopoiesis genes that are differentially expressed in the samples. Red indicates increased expression by 2-fold or more, whereas green depicts decreased expression by 2-fold or more. Genes within blue boxes are those whose expression differs among the ETS family–transduced cells. (E) qRT-PCR confirmation of several differentially expressed genes in the colonies derived from Gata1-knockdown fetal liver hematopoietic cells. Graph depicts mean plus or minus SE for a minimum of 3 independent experiments performed in triplicate. All differences are significant at the 5% level.
Next, we used Gene Ontology analysis to probe the expression differences between control and ETS family–transduced cells. The top 50 differentially expressed genes classified as hematopoiesis, cell cycle, leukemia, apoptosis, or cell proliferation are shown (Figure 6D and Figure S3). In ETS family–transduced cells, genes associated with the erythroid lineage, such as Klf1, Lmo2, Hbb-b1, Gypa, Egr1, Ank1, and Eraf, were strongly repressed (Figure 6D; Table S1). Based upon our liquid culture studies and the recently described cross-antagonism between FLI-1 and EKLF7,8 this observation is not surprising. Overexpression of the ETS family proteins also led to inhibition of Rb1, which is consistent with a previous report that FLI-1 directly inhibits Rb expression.44 Our comparison also revealed that, in stark contrast to the increased expression of Cdkn2a detected in ETS2- and ERG-transduced Gata1-knockdown megakaryocytes (Figure 2D), expression of ETS family members was associated with decreased expression of Cdkn2a in immortalized cells. This observation highlights the difficulty in directly comparing gene expression in a committed endomitotic megakaryocyte with that of a proliferating immortalized progenitor.
Notably, we did not observe significant increases in the expression of Hox genes or Meis1, genes whose expression is often associated with transformed hematopoietic cells.45,46 However, we did observe increased expression of Jak2 and Stat5a, 2 genes whose activation is associated with myeloproliferative disease and megakaryocytic transformation.47,48 Finally, we used qRT-PCR to validate the changes in a set of genes in RNA samples collected from fourth-generation cultures (Figure 6E). Expression of Spfi1, Runx1, Jak2, and Gata3 were elevated in ETS2-, ERG-, and FLI-1–transduced cells in accordance with the microarray data.
ERG and FLI-1 induce alterations in c-kit/CD41 expression and JAK/STAT signaling in Gata1-knockdown immortalized cells
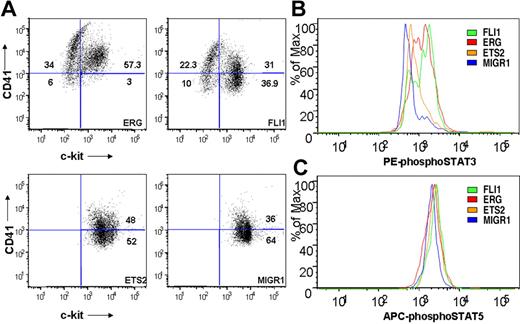
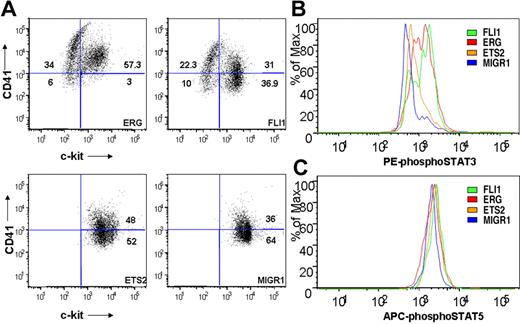
To determine whether ETS family expression affected the immunophenotype of Gata1-knockdown fetal liver progenitors, cells from fourth-generation colonies were assessed for surface expression of c-kit and CD41 by flow cytometry. ERG- and FLI-1–expressing cultures included a substantial proportion of CD41+/c-kit− cells, indicative of megakaryocytic maturation (Figure 7A). Note that this population was absent from both the ETS2 and MIGR1 Gata1-knockdown cultures. Furthermore, ectopic ERG expression resulted in greater than 90% of the cells expressing CD41, suggesting that nearly all of the cells within the immortalized colonies are of the megakaryocyte lineage.
ETS-, ERG-, and FLI-1–immortalized cells express CD41 and c-kit and show enhanced STAT-3 phosphorylation. (A) Comparison of CD41 and c-kit expression in ETS2-, ERG-, and FLI-1–overexpressing Gata1-knockdown fetal liver hematopoietic cells isolated from methylcellulose after 4 weeks of culture. Plots are representative of 3 independent experiments. Significance levels for differences for ERG and FLI-1 in comparison with MIGR1 are for CD41 expression (singly positive) only: ERG (P < .01), FLI-1 (P < .04); for CD41/c-kit double-positive gate: ERG (P < .02); c-kit expression: ERG (P < .008), FLI-1 (P < .03). (B,C) Comparison of phospho-STAT3 and phospho-STAT5(a/b) staining of fourth-generation ETS2-, ERG-, and FLI-1-overexpressing Gata1-knockdown fetal liver hematopoietic cells. Significance levels for differences in phospho-STAT3 signaling in comparison with MIGR1: ERG (P < .01), FLI-1 (P < .009), and ETS2 (not significant). P values were calculated by comparing the percentage of cells stained for phospho-STAT3 in the different groups for 3 independent experiments.
ETS-, ERG-, and FLI-1–immortalized cells express CD41 and c-kit and show enhanced STAT-3 phosphorylation. (A) Comparison of CD41 and c-kit expression in ETS2-, ERG-, and FLI-1–overexpressing Gata1-knockdown fetal liver hematopoietic cells isolated from methylcellulose after 4 weeks of culture. Plots are representative of 3 independent experiments. Significance levels for differences for ERG and FLI-1 in comparison with MIGR1 are for CD41 expression (singly positive) only: ERG (P < .01), FLI-1 (P < .04); for CD41/c-kit double-positive gate: ERG (P < .02); c-kit expression: ERG (P < .008), FLI-1 (P < .03). (B,C) Comparison of phospho-STAT3 and phospho-STAT5(a/b) staining of fourth-generation ETS2-, ERG-, and FLI-1-overexpressing Gata1-knockdown fetal liver hematopoietic cells. Significance levels for differences in phospho-STAT3 signaling in comparison with MIGR1: ERG (P < .01), FLI-1 (P < .009), and ETS2 (not significant). P values were calculated by comparing the percentage of cells stained for phospho-STAT3 in the different groups for 3 independent experiments.
Because our gene array data showed increased Jak2 and Stat5 mRNA levels in ETS family–transduced cells (Figure 6D), and activating mutations in JAK3 are associated with AMKL,47 we next assessed whether JAK/STAT signaling was altered in the immortalized cells. Using flow cytometry, we observed no differences in phospho-STAT5 levels in immortalized samples (Figure 7C). In contrast, cells from the ERG and FLI-1 cultures consistently showed significant increases in phospho-STAT3 staining in comparison with the MIGR1 control, whereas ETS2 expression led to a modest but reproducible increase in staining (Figure 7B and data not shown). The increases in STAT3 phosphorylation indicate that ERG and FLI-1 activate the JAK/STAT pathway in the Gata1-knockdown fetal liver progenitors during immortalization.
Discussion
The model that pediatric leukemias are initiated by genetic events during fetal hematopoiesis49 is an attractive one for TMD and DS-AMKL, as both disorders likely derive from a fetal liver progenitor that acquires an initiating mutation in GATA1.21 Sequencing of the GATA1 gene in DNA extracted from Guthrie cards has revealed that as many as 4% of infants with DS acquire GATA1 mutations that frequently lead to the development of TMD or overt leukemia.22,50 In contrast, GATA1 mutations are only rarely found in people without DS. This latter group includes infants with TMD who have acquired trisomy 21 in the malignant clone(s)51 and family members with somatic mutations in GATA1 that lead to ineffective hematopoiesis, but not leukemia.26 Thus, GATA1 mutations and trisomy 21 are inextricably linked in DS-AMKL. However, the specific gene or genes on Hsa21 that synergize with GATA1 mutations in leukemogenesis have been unknown. Furthermore, the role of trisomy 21 in the initiation of disease has remained enigmatic. Here, we assessed the effects of overexpression of ETS2 and ERG, 2 candidate leukemia oncogenes on Hsa21, as well as FLI-1, a related ETS family member, on megakaryocyte growth and development.
Our most striking discovery was that ETS2, ERG, and FLI-1 could each promote immortalization of Gata1 mutant, but not wild-type, hematopoietic progenitors. These results reveal thatthere is a specific synergy between loss of full-length GATA-1 and overexpression of ETS family members in the control of self-renewal of megakaryocyte progenitors. In our studies, immortalization was not accompanied by increased expression of HOX genes or Meis1, suggesting that this in vitro transformation occurs by a mechanism that is different from other events that can drive AML, such as MLL fusion proteins. Of note, we did observe increased expression of Bmi1, which has an essential role in regulating the proliferative capacity of both normal and malignant hematopoietic progenitors,52 specifically in ERG- and FLI-1–immortalized cells. We also discovered that immortalized cells derived from Gata1-knockdown fetal liver cells transduced with ETS2, ERG, and FLI-1 showed increased phosphorylation of STAT3, but not STAT5. Interestingly, STAT3 activation is common in AML patient specimens, even in those without characteristic JAK2 mutations.53 Despite the robust in vitro immortalization caused by ERG and FLI-1 overexpression in Gata1-knockdown or Gata1s knockin progenitors, we did not observe any leukemia in animals that received a transplant of these cells (data not shown). We attribute this outcome to the insufficient engraftment of Gata1-knockdown and Gata1s knockin fetal liver cells in recipient animals. It has been established that Gata1-knockdown and Gata1s knockin cells express high levels of GATA-2, whose up-regulation is associated with poor engraftment.54 Thus, alternative strategies to assess the contribution of human GATA1 mutations to transformation mediated by ETS proteins are necessary.
With respect to the role of ETS proteins in hematopoiesis, several loss-of-function studies have confirmed that the ETS family members, including GABPα, ERG, and FLI-1, are required for normal megakaryopoiesis.15,37,38,40,55 Moreover, recent reports have demonstrated that overexpression of ERG or ETS2 promotes a megakaryocytic switch in the differentiation of K562 cells.5,6 In these experiments, expression of ETS2 or ERG was associated with increased expression of genes characteristic of megakaryocytes, such as GPIIb and GPIIIa, with a concomitant decrease in markers of the erythroid lineage, such as glycophorin A, ERAF, HBA2/hemoglobin α2, and EKLF.5,6 Similarly, another group previously demonstrated that ectopic FLI-1 facilitated megakaryocyte differentiation of K562 cells in the absence of any differentiation stimulus.41 Our studies confirm that overexpression of ETS family members has the same effect on primary hematopoietic cells, regardless of the GATA-1 status. Furthermore, ERG and FLI-1 showed similar effects on development of megakaryocytes in liquid culture and colony assays in all genotypes tested. ERG and FLI-1 function along the same pathway in megakaryopoiesis and these data suggest that ERG may promote megakaryocyte development by mimicking FLI-1.
Our microarray study revealed that expression of ETS2, ERG, or FLI-1 leads to reduced expression of erythroid lineage genes, including Eraf, Klf1, Lmo2, Tfrc, and Alas2. These findings are consistent with the antagonistic effects of ectopic ETS protein expression on erythroid cell development and with the recent reports that FLI-1 and EKLF play antagonistic roles in cell fate determination of the MEP, where EKLF drives erythroid cell development, in part by, suppressing expression of FLI-1.7,8 In contrast, human DS-AMKL blasts showed increased expression of erythroid genes, such as GYPA, CD36, and TRFC, compared with non-DS AMKL blasts.56 Previous reports have also noted that DS-AMKL blasts display a mixed erythroid/megakaryocyte phenotype with expression of genes characteristic of both lineages.57 We surmise that there are many reasons why there is a discrepancy between the primary cells in our study and AMKL blasts. For example, DS-AMKL blasts harbor mutations in other genes besides GATA1, such as FLT3 and JAK3. These other mutations likely impact the phenotype and gene expression of the cells. Another explanation for the discrepancy could be that DS-AMKL and AMKL blasts are blocked at different stages downstream of the MEP, which could also account for phenotypic differences.
In summary, our work shows that the ETS family members ETS2 and ERG, which localize within the Down syndrome critical region on Hsa21, can promote megakaryopoiesis independent of GATA-1 and specifically cooperate with loss of full-length GATA-1 to immortalize fetal liver progenitors. We also reveal that ERG and FLI-1 promote immortalization while reducing the degree of differentiation of Gata1s knockin progenitors. As ERG and FLI-1 share extensive homology and demonstrate similar activities when overexpressed, it is likely that ERG mimics FLI-1 activity and enforces a megakaryocytic program independent of GATA1. Nevertheless, there are notable differences in megakaryocyte growth and differentiation in response to ETS protein overexpression in wild-type, Gata1s, and Gata1-deficient progenitors. These studies underscore the importance of ETS proteins in megakaryopoiesis and suggest that altered levels of these proteins may contribute to human disease.
The online version of this article contains a data supplement.
The publication costs of this article were defrayed in part by page charge payment. Therefore, and solely to indicate this fact, this article is hereby marked “advertisement” in accordance with 18 USC section 1734.
Acknowledgments
The authors thank the University of Chicago Flow Cytometry Core Facility for assistance with cell sorting, Gerd Blobel for the mFli-1 cDNA, Stuart Orkin and Zhe Li for the Gata1Δex2 mice, Gina Kirsammer for critical reading of the paper, and Shai Izraeli and Hugh Brady for sharing data prior to publication. The authors also thank Drs Gilbert Feng and Simon Lin for excellent bioinformatics support.
This work was supported in part by grant research grant number 6-FY07-280 from the March of Dimes Foundation (White Plains, NY) and an R01 from the National Cancer Institute (CA101774; Bethesda, MD). J.D.C. is a Scholar of the Leukemia & Lymphoma Society (White Plains, NY). M.J.S. was supported by the Cancer Biology Program Training Grant at the University of Chicago and by the Katten Muchin Rosenman Travel Scholarship Award from the Robert H. Lurie Comprehensive Cancer Center of Northwestern University.
National Institutes of Health
Authorship
Contribution: M.J.S. designed and performed all experiments and contributed to writing the paper; and J.D.C. assisted in experiment design, data interpretation, and writing of the paper.
Conflict-of-interest disclosure: The authors declare no competing financial interests.
Correspondence: John D. Crispino, Northwestern University, Division of Hematology/Oncology, 303 East Superior St, Lurie 5-113, Chicago, IL 60611; e-mail: j-crispino@northwestern.edu.

