Key Points
Glutamine removal and knockdown of the glutamine transporter SLC1A5 have antileukemic activity in AML.
The glutaminase activity of l-asparaginase inhibits mTORC1 and protein synthesis and induces a strong autophagy in AML.
Abstract
Cancer cells require nutrients and energy to adapt to increased biosynthetic activity, and protein synthesis inhibition downstream of mammalian target of rapamycin complex 1 (mTORC1) has shown promise as a possible therapy for acute myeloid leukemia (AML). Glutamine contributes to leucine import into cells, which controls the amino acid/Rag/mTORC1 signaling pathway. We show in our current study that glutamine removal inhibits mTORC1 and induces apoptosis in AML cells. The knockdown of the SLC1A5 high-affinity transporter for glutamine induces apoptosis and inhibits tumor formation in a mouse AML xenotransplantation model. l-asparaginase (l-ase) is an anticancer agent also harboring glutaminase activity. We show that l-ases from both Escherichia coli and Erwinia chrysanthemi profoundly inhibit mTORC1 and protein synthesis and that this inhibition correlates with their glutaminase activity levels and produces a strong apoptotic response in primary AML cells. We further show that l-ases upregulate glutamine synthase (GS) expression in leukemic cells and that a GS knockdown enhances l-ase–induced apoptosis in some AML cells. Finally, we observe a strong autophagic process upon l-ase treatment. These results suggest that l-ase anticancer activity and glutamine uptake inhibition are promising new therapeutic strategies for AML.
Introduction
The serine threonine kinase mammalian target of rapamycin (mTOR) forms 2 functionally and structurally distinct complexes, mTORC1 and mTORC2. MTORC1, comprising mTOR, Raptor, and MLST8, positively regulates protein translation through the phosphorylation of its substrates, protein S6 Kinase (P70S6K) and eukaryotic initiation factor 4E-binding protein 1 (4E-BP1). Cap-dependent translation is controlled by the translational repressor 4E-BP1. 4E-BP1 phosphorylation at its serine 65 residue is absolutely required to initiate the formation of the translation initiation complex eukaryotic initiation factor 4F.1 In most primary acute myeloid leukemia (AML) samples, the mTORC1 complex is activated by an as-yet–unknown mechanism.2,3 Recently, it was shown in a raptor deficiency mouse model that mTORC1 inactivation induces apoptosis in differentiated leukemic cells and maintains immature leukemic cells with leukemia initiation potential in a dormant state, underlying the critical role of mTORC1 in leukemia.4 In vitro, in primary AML cells, mTORC1 inhibition with rapamycin has cytostatic effects but does not induce apoptosis,2-5 mainly because it does not inhibit 4E-BP1 phosphorylation on ser65.6 In contrast, mTOR kinase inhibitors fully inhibit 4E-BP1 phosphorylation, suppress protein synthesis, and induce apoptosis.7,8 Thus, full inhibition of mTORC1 activity represents a promising therapy in AML.
Many upstream signals regulate mTORC1 activation, including growth factors, the energy status of the cell via the LKB1/AMPK pathway, hypoxemia, and low glucose content, all converging at the TSC1/TSC2 axis that negatively affects the activity of the Ras homolog enriched in brain (Rheb) protein toward mTORC1.9 However, a major process controlling mTORC1 activity is the availability of amino acids (AAs), mainly leucine.10,11 Indeed, intracellular leucine is required to activate the Ras-related GTPases proteins, which enable the localization of the mTORC1 complex at the lysosome surface close to its activator, Rheb.12,13 Leucine is imported into the cell in exchange for glutamine by the bidirectional transporter SLC7A5/3A2. Thus, the level of leucine depends on the intracellular glutamine concentrations. Glutamine uptake is essentially mediated by the high-affinity SLC1A5 transporter, which cooperates with SLC7A5/3A2.14 The cellular uptake and subsequent rapid efflux of glutamine in the presence of leucine make glutamine availability a limiting step for mTORC1 activation.15
We herein tested the effects of glutamine depletion in AML cells. We show from our experiments that leukemic cells are sensitive to glutamine removal, leading to mTORC1 inhibition and apoptosis. Knockdown of the SLC1A5 transporter induces apoptosis and inhibits tumor formation in an AML mouse xenotransplantation model. Moreover, we find that l-ase inhibits mTORC1 activity, suppresses protein synthesis, and induces apoptosis in AML through its glutaminase activity. However, l-ase also upregulates glutamine synthase (GS) protein expression, which may limit the l-ase–induced antileukemic effects in AML in some cases. Finally, we demonstrate that l-ase strongly triggers an autophagic process. Taken together, these results indicate that AML cells absolutely require glutamine and that targeting glutamine uptake represents a promising therapeutic approach.
Material and methods
Patients
Bone marrow or peripheral blood samples with >70% blast cell content were obtained from 27 patients with newly diagnosed AML. Cells were isolated using Ficoll-Hypaque density-gradient separation. Cells were collected after obtaining patients’ written informed consent in accordance with the Declaration of Helsinki and approval obtained by the Cochin Hospital Institutional ethic committee. Patient characteristics are listed in supplemental Table 1. The CD34+ cells from healthy donors were purified using MIDIMACS immunoaffinity columns (Milteny Biotech, Bergish Badgash, Germany).
Cell culture
Human leukemic cell lines were purchased from DSMZ (Braunschweig, Germany) for MV4-11 and from the American Type Culture Collection (Molsheim, France) for HL-60, MOLM-14, and OCI-AML3. Cells were cultured in minimum essential medium (MEM) α medium containing 10% fetal bovine serum (FBS) and 4 mM glutamine. To induce AA starvation, cells were cultured in MEM α medium without glutamine, asparagine, and leucine supplemented with 10% dialyzed FBS in the presence or absence of 4 mM glutamine, 0.4 mM leucine, or 0.4 mM l-ase (Sigma, St. Louis, MO). HEK-293T cells were cultured in Dulbecco's modified Eagle medium with 10% FBS without glutamine and leucine and then supplemented or not with AAs.
Reagents
We used from 0.1 to 10 UI/mL of Escherichia colil-asparaginase (l-ase; Kidrolase) or Erwinia chrysanthemil-ase (Erwinase), both purchased from EUSA Pharma Inc (Lyon, France).
Western blotting
Whole-cell extracts and western blots were performed as previously described.6 Antibodies against phospho-p70S6K T389, 4EBP1, phospho-4EBP1 S65, phospho-AKT S473, AKT, phospho-NDRG1 T346, poly ADP-ribose polymerase (PARP), caspase 3, SLC1A5, c-Myc, Mcl-1, LC3b, ATG5, and beclin were purchased from Cell Signaling Technology; anti-GS antibodies from BD Bioscience (San Jose, CA); anti-p70S6K and anti-SQSTM1 from Santa Cruz Biotechnology; anti-actin and anti-Flag antibodies from Sigma; and anti-p85 antibodies were raised in house.
Flow cytometry
Apoptosis was quantified by Annexin V-PE (Becton Dickinson, Le Pont De Claix, France) and 7-aminoactinomycin D (Sigma) staining.
Measurement of extracellular and intracellular AA levels
For the quantification of extracellular AAs, culture supernatants were deproteinized with a 30% (w/v) sulfosalicylic acid solution, incubated for 5 minutes at room temperature, and centrifuged (10 000 rpm, 10 minutes, 4°C). Supernatants were then stored at −80°C until analysis. AA levels were measured by ion exchange chromatography using an AA auto analyzer (model Aminotac; Jeol, Tokyo, Japan). For quantification of AA in cell extracts, 5 × 10⁶ cells were sonicated and centrifuged (10 000 rpm, 10 minutes). Homogenized samples were then deproteinized and again centrifuged. The resulting supernatant was subsequently used for AA measurements by ion exchange chromatography.
Lentiviral constuctions expressing sh/siRNAS
SLC1A5 (TCRN0000043120 [short hairpin RNA (shRNA)1] and TCRN0000043122 [shRNA2]), GS (TCRN0000045628 [shRNA1] and TCRN0000045630 [shRNA2]), and nontargeted (control) shRNAs were from Open Biosystems and cloned into a pLKO-Tet-On inducible or pLKO.1 plasmids (plasmid numbers 21915 and 8453 from Addgene, Cambridge, MA).16 Lentiviral particles were produced using HEK-293T packaging cells. Supernatants were collected 48 hours after transfection and then stored at −80°C. Leukemic cell lines were plated at 2.5 × 10⁶ cells/mL in serum-free medium to which 10 µL of lentiviral supernatants were added. The transfection of anti-Atg5 and anti-beclin small interfering RNAs (siRNAs) was performed in the OCI-AML3 cell line using the Amaxa nucleofector kit (Lonza, Basel, Switzerland). The pLJM1 Flag Raptor Rheb15 (Addgene plasmid 26634) or control vector were transfected in 293T cells using 10 µL of lentiviral supernatant.
[35S] Methionine incorporation assay
Cells were pretreated without or with l-ase (E coli) at 10 UI/mL in Dulbecco's modified Eagle medium without methionine (Eurobio, Courtaboeuf, France) for 6 hours and pulse-labeled with 160 µCi of [35S] methionine for an additional 2 hours. The amount of radioactivity incorporated into the proteins was determined by trichloroacetic acid precipitation.
AML xenografts in nude mice
MOLM-14 infected with either a lentiviral vector containing the doxycycline-inducible SLC1A5 shRNA or a nonspecific shRNA were subcutaneously injected into nude mice as previously reported.17 All mice were treated with doxycycline given ad libitum 5 days per week (n = 12). Tumor growth was measured 3 times per week. All experiments were conducted in accordance with the guidelines of the Association for Assessment and Accreditation of Laboratory Animal Care International.
Electron microscopy
Cells were fixed for 1 hour in 3% glutaraldehyde in 0.1 M sodium phosphate buffer, pH 7.4, post-fixed for 1.5 hours with 1% osmium tetraoxide, dehydrated by successive ethanol washes (70%, 90%, 100%, 100%), and impregnated with epoxy resin. After polymerization, 80- to 90-nm sections were prepared using a Reichert Ultracut S ultramicrotome, stained with 2% uranyl acetate plus Reynold’s lead citrate, and visualized under a JEOL 1011 transmission electron microscope with a GATAN Erlangshen CCD camera.
Statistical analysis
Data from this study are expressed as mean values with standard deviations. Statistical significance in the differences between experimental groups was determined using the Student t test. *, ** and *** indicate P < .05, P < .01, and P < .001, respectively. The experiments performed in AML cell lines were performed in independent triplicates.
Results
Glutamine removal inhibits mTORC1 and induces apoptosis in AML cells
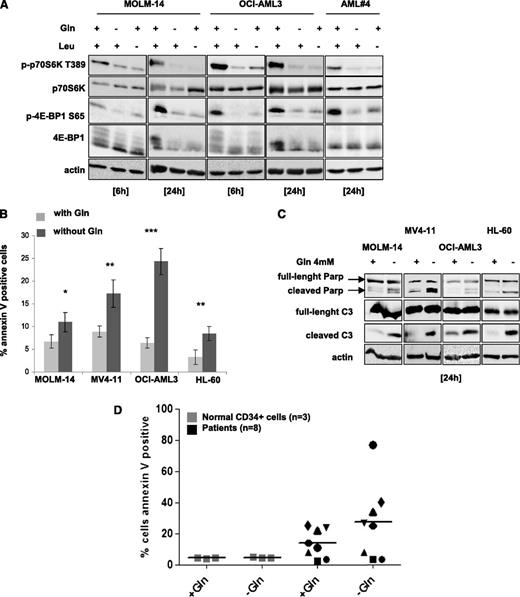
We tested the effects of either leucine or glutamine deprivation on mTORC1 activity in AML cells. Leucine- or glutamine-starved cells exhibited, in a time-dependent manner, a decrease of p70S6K T389 and 4E-BP1 S65 phosphorylation in all AML cell lines tested as well as in a representative AML sample (Figure 1A; supplemental Figure 1A). However, glutamine or leucine starvation did not inhibit the phosphorylation of AKT on S473 (supplemental Figure 1B). Glutamine removal for 24 hours induced significant apoptosis in all cell lines, with the most dramatic effects seen in MV4-11 and OCI-AML3, as assessed by Annexin V binding and caspase-3 and PARP cleavage assays (Figure 1B-C). We then tested the hypothesis that AML cells have a higher level of glutamine dependence than normal CD34+ cells. As shown in Figure 1D, normal CD34+ cells from 3 donors were resistant to apoptosis induction following glutamine removal. In contrast, an analysis of 8 primary AML samples indicated that some samples are glutamine dependent, whereas others are not. These results indicate that glutamine deprivation induces mTORC1 inhibition and apoptosis in AML cells.
Glutamine removal inhibits mTORC1 activity and induces apoptosis in AML cells. (A) The MOLM-14 and OCI-AML3 cell lines, and primary AML cells from a representative patient, were cultured for 6 or 24 hours with or without 4 mM glutamine (Gln) and/or 0.4 mM leucine (Leu). Cells were lysed in Laemmli buffer and western blotting was performed to analyze the p70S6K T389 and 4E-BP1 S65 phosphorylation status. (B) MOLM-14, OCI-AML3, MV4-11, and HL-60 cell lines were cultured with or without Gln for 24 hours and apoptosis was quantified by flow cytometry analysis of Annexin-V binding. (C) The indicated cell lines were cultured for 24 hours with or without glutamine and then assessed for caspase-3 and PARP cleavage by western blotting. (D) Normal CD34+ cell were obtained from 3 healthy allogeneic transplant donors after positive sorting and primary AML cells from 8 AML patients were also tested. Cells were cultured 48 hours with or without glutamine (4 mM), and the apoptotic responses were quantified by flow cytometry analysis of Annexin-V binding.
Glutamine removal inhibits mTORC1 activity and induces apoptosis in AML cells. (A) The MOLM-14 and OCI-AML3 cell lines, and primary AML cells from a representative patient, were cultured for 6 or 24 hours with or without 4 mM glutamine (Gln) and/or 0.4 mM leucine (Leu). Cells were lysed in Laemmli buffer and western blotting was performed to analyze the p70S6K T389 and 4E-BP1 S65 phosphorylation status. (B) MOLM-14, OCI-AML3, MV4-11, and HL-60 cell lines were cultured with or without Gln for 24 hours and apoptosis was quantified by flow cytometry analysis of Annexin-V binding. (C) The indicated cell lines were cultured for 24 hours with or without glutamine and then assessed for caspase-3 and PARP cleavage by western blotting. (D) Normal CD34+ cell were obtained from 3 healthy allogeneic transplant donors after positive sorting and primary AML cells from 8 AML patients were also tested. Cells were cultured 48 hours with or without glutamine (4 mM), and the apoptotic responses were quantified by flow cytometry analysis of Annexin-V binding.
Targeting the SLC1A5 glutamine transporter has antileukemic effects
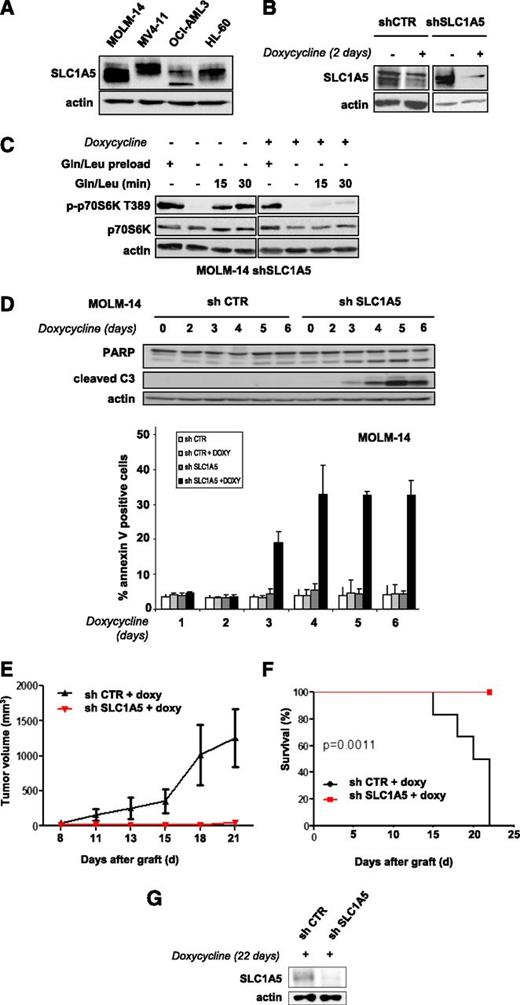
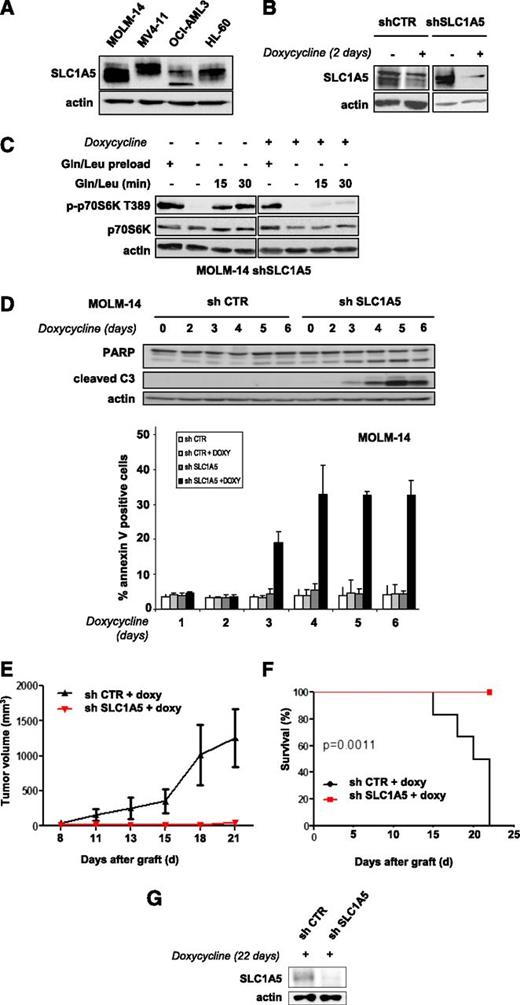
We tested whether inhibiting glutamine uptake via a knockdown of the glutamine transporter SLC1A5 exerts antileukemic activity. The SLC1A5 protein is expressed in all leukemic cell lines tested (Figure 2A). We engineered 2 different doxycycline-inducible shRNAs that were transduced in AML cells using a lentivirus construct and inhibited SLC1A5 expression with similar efficiency (results are reported for shRNA1). SLC1A5 knockdown in MOLM-14 cells was maximal from day 2 (Figure 2B). We investigated the role of this transporter in the control of mTORC1 activation. SLC1A5 shRNA-infected MOLM-14 cells cultured with or without doxycycline were starved of leucine and glutamine for 6 hours to inhibit mTORC1 and then stimulated for 15 and 30 minutes with these 2 AAs. MTORC1 activation was strongly reinduced in the doxycycline-untreated cells but not when SLC1A5 was knocked down (Figure 2C).
Targeting the SLC1A5 glutamine transporter has proapoptotic effects and in vivo antileukemic activity. (A) SLC1A5 expression was studied by western blotting in the 4 indicated AML cell lines. (B-F) MOLM-14 cells were infected with a lentiviral vector expressing either an inducible SLC1A5 or a control (CTR) shRNA. Stably infected cell lines were established after selection in puromycin. (B) MOLM-14 cells infected with SLC1A5 or CTR shRNA were cultured with or without doxycycline for the indicated times. The inhibition of SLC1A5 expression with doxycycline was assessed by western blotting. (C) MOLM-14/SLC1A5 shRNA cells and MOLM-14/CTR shRNA cells were starved or not for 6 hours of glutamine and leucine to inhibit mTORC1, as detected by the inhibition of p70S6K T389 phosphorylation. Previously starved cells were then stimulated for 15 or 30 minutes with leucine + glutamine in the presence or absence of doxycycline. The reactivation of mTORC1 was then determined. (D) Apoptosis was evaluated in MOLM-14/SLC1A5 shRNA cells and MOLM-14/CTR shRNA cells in the presence of doxycycline by flow cytometry analysis of Annexin-V fixation or by western blotting analysis of PARP and caspase-3 cleaved fragments. Analysis was performed every day from day 2 to day 6. (E) MOLM-14/SLC1A5shRNA cells (red) or MOLM-14/CTR shRNA cells (black) were injected into nude mice. The mice were then treated with doxycycline by oral gavage, and the tumor volumes were determined at the indicated times. The means of the individual tumor sizes were then plotted (n = 8 in each group). (F) Kaplan-Meier survival curves of nude mice treated with doxycycline. (G) SLC1A5 expression was detected by western blotting analysis of tumor extracts from MOLM-14/SLC1A5 shRNA or MOLM-14/CTR shRNA mice treated with doxycycline (day 22).
Targeting the SLC1A5 glutamine transporter has proapoptotic effects and in vivo antileukemic activity. (A) SLC1A5 expression was studied by western blotting in the 4 indicated AML cell lines. (B-F) MOLM-14 cells were infected with a lentiviral vector expressing either an inducible SLC1A5 or a control (CTR) shRNA. Stably infected cell lines were established after selection in puromycin. (B) MOLM-14 cells infected with SLC1A5 or CTR shRNA were cultured with or without doxycycline for the indicated times. The inhibition of SLC1A5 expression with doxycycline was assessed by western blotting. (C) MOLM-14/SLC1A5 shRNA cells and MOLM-14/CTR shRNA cells were starved or not for 6 hours of glutamine and leucine to inhibit mTORC1, as detected by the inhibition of p70S6K T389 phosphorylation. Previously starved cells were then stimulated for 15 or 30 minutes with leucine + glutamine in the presence or absence of doxycycline. The reactivation of mTORC1 was then determined. (D) Apoptosis was evaluated in MOLM-14/SLC1A5 shRNA cells and MOLM-14/CTR shRNA cells in the presence of doxycycline by flow cytometry analysis of Annexin-V fixation or by western blotting analysis of PARP and caspase-3 cleaved fragments. Analysis was performed every day from day 2 to day 6. (E) MOLM-14/SLC1A5shRNA cells (red) or MOLM-14/CTR shRNA cells (black) were injected into nude mice. The mice were then treated with doxycycline by oral gavage, and the tumor volumes were determined at the indicated times. The means of the individual tumor sizes were then plotted (n = 8 in each group). (F) Kaplan-Meier survival curves of nude mice treated with doxycycline. (G) SLC1A5 expression was detected by western blotting analysis of tumor extracts from MOLM-14/SLC1A5 shRNA or MOLM-14/CTR shRNA mice treated with doxycycline (day 22).
SLC1A5 knockdown induced significant apoptosis, attested to by caspase-3 and PARP cleavage assays and by Annexin V fixation (Figure 2D). In contrast, no apoptosis was detected in the HL-60 cell line when SLC1A5 expression was fully inhibited (data not shown). This result was further supported by our finding that in SLC1A5 knockdown HL-60 cells, mTORC1 was reactivated by AA stimulation, suggesting that other glutamine transporters control glutamine-mediated mTORC1 activation in this cell line (supplemental Figure 2). The antileukemic effects of SLC1A5 inhibition were tested in vivo. Two groups of nude mice were subcutaneously injected with MOLM-14 cells transduced with SLC1A5 or control shRNAs and then treated with doxycycline. SLC1A5 ablation prevented tumor development (Figure 2E) and statistically improved overall survival of the mice (P = .0011) (Figure 2F). Western blotting analysis of tumor samples confirmed this inducible SLC1A5 inhibition in mice injected with SLC1A5 shRNA-MOLM-14 cells (Figure 2G). These results reveal that targeting the SLC1A5 glutamine transporter has antileukemic activity both in vitro and in vivo.
The glutaminase activity of l-ase inhibits mTORC1 and protein translation in AML cells
The l-ases have glutaminase activity and transform extracellular glutamine into glutamate. In OCI-AML3 cells, l-ase drastically reduces the intracellular glutamine levels (Figure 3A). Similar results were observed in MOLM-14 and MV4-11 cell lines (not shown). We tested l-ase effects on mTORC1 activity in AML cells. We compared the effects of l-ase from E coli with those of the l-ase from E chrysanthemi, whose glutaminase activity is fourfold higher despite the similar levels of asparaginase activity. In OCI-AML3 cells, both l-ases induced the dose- and time-dependent inhibition of p70S6K T389 and 4E-BP1 S65 phosphorylations (Figure 3B). Similar results were obtained in 3 other AML cell lines (supplemental Figure 3A-B). E chrysanthemil-ase was found to induce a maximal inhibition of mTORC1 at lower concentrations than E colil-ase (Figure 3B). Moreover, mTORC1 inhibition by l-ase correlated with extracellular glutamine depletion (Figure 3C). These results suggest that l-ase–induced mTORC1 inhibition is due to extracellular glutamine degradation. Indeed, asparagine starvation did not inhibit mTORC1 in all AML cell lines tested in contrast to the findings for leucine or glutamine privation (supplemental Figure 3C). Moreover, the E colil-ase dramatically inhibited mTORC1 activity in several primary AML samples (Figures 3D). Glutamine starvation and l-ase overactivated mTORC2 signaling, attested by the increased phosphorylations of AKT on S473 and NDRG1 on T346 (supplemental Figure 3D).
The glutaminase activity of l-ase inhibits mTORC1 and protein translation in AML cells. (A) OCI-AML3 cells were cultured for 24 hours with the indicated doses of E colil-ase, and the levels of glutamine and asparagine in the intracellular compartment were quantified by ion exchange chromatography. (B) The OCI-AML3 cell line was cultured for 6 or 24 hours with or without E coli or E chrysanthemil-ases at an equal level of asparaginase activity (0.1-10 UI/mL) and then lysed in Laemmli buffer. Western blotting was performed with anti-phospho-p70S6K T389, anti-phospho-4E-BP1 S65, anti-p70S6K, anti-4E-BP1, and anti-actin antibodies. (C) Cells were treated as indicated in B, and the level of Gln in the extracellular medium was quantified by ion exchange chromatography. (D) Primary bone marrow leukemic cells from AML patients were treated as in A, and the same analysis was assessed by western blotting. The intensities of phospho-p70S6K T389, phospho-4E-BP1 S65, and actin signals were quantified in different AML samples. Ratios of phospho-p70S6K T389 or phospho-4E-BP1 S65 to actin were calculated and assigned a reference value of 1 in the control culture. (E) HEK-293T cells were transfected with a Flag-Raptor-Rheb15 expression vector or a control vector and then cultured for 24 hours with or without glutamine at 4 mM or E colil-ase (10 UI/mL). Western blotting was then performed with anti-flag, anti-actin, or anti-phospho-p70S6K T389 antibodies. (F) [S35] methionine pulses were performed in MOLM-14, OCI-AML3, MV4-11, and HL-60 cells to evaluate the global protein synthesis profile with or without E colil-ase at 10 UI/mL during a 6-hour period. (G) OCI-AML3, MOLM-14, MV4-11, and HL-60 cell lines and a representative AML sample were cultured for 24 hours with or without E colil-ase. The expression of Mcl-1 and c-Myc was then analyzed by western blotting.
The glutaminase activity of l-ase inhibits mTORC1 and protein translation in AML cells. (A) OCI-AML3 cells were cultured for 24 hours with the indicated doses of E colil-ase, and the levels of glutamine and asparagine in the intracellular compartment were quantified by ion exchange chromatography. (B) The OCI-AML3 cell line was cultured for 6 or 24 hours with or without E coli or E chrysanthemil-ases at an equal level of asparaginase activity (0.1-10 UI/mL) and then lysed in Laemmli buffer. Western blotting was performed with anti-phospho-p70S6K T389, anti-phospho-4E-BP1 S65, anti-p70S6K, anti-4E-BP1, and anti-actin antibodies. (C) Cells were treated as indicated in B, and the level of Gln in the extracellular medium was quantified by ion exchange chromatography. (D) Primary bone marrow leukemic cells from AML patients were treated as in A, and the same analysis was assessed by western blotting. The intensities of phospho-p70S6K T389, phospho-4E-BP1 S65, and actin signals were quantified in different AML samples. Ratios of phospho-p70S6K T389 or phospho-4E-BP1 S65 to actin were calculated and assigned a reference value of 1 in the control culture. (E) HEK-293T cells were transfected with a Flag-Raptor-Rheb15 expression vector or a control vector and then cultured for 24 hours with or without glutamine at 4 mM or E colil-ase (10 UI/mL). Western blotting was then performed with anti-flag, anti-actin, or anti-phospho-p70S6K T389 antibodies. (F) [S35] methionine pulses were performed in MOLM-14, OCI-AML3, MV4-11, and HL-60 cells to evaluate the global protein synthesis profile with or without E colil-ase at 10 UI/mL during a 6-hour period. (G) OCI-AML3, MOLM-14, MV4-11, and HL-60 cell lines and a representative AML sample were cultured for 24 hours with or without E colil-ase. The expression of Mcl-1 and c-Myc was then analyzed by western blotting.
l-ase may inhibit leucine entry into the cells by depleting intracellular glutamine, thereby preventing mTORC1 activation by Rheb at the lysosomal surface.12,13 To further investigate this mechanism, we used a chimeric Raptor-Rheb15 protein in which the mTORC1 partner protein Raptor was fused to the 15-AA Rheb sequence. This chimeric protein produces the constitutive localization of mTORC1 at the lysosomal surface, leading to AA-independent mTORC1 activation.18 In HEK-293T cells expressing the Raptor-Rheb15 protein, glutamine removal only partially inhibited p70S6K T389 phosphorylation. Interestingly, mTORC1 activation was maintained in Raptor-Rheb15–expressing cells treated with l-ase, which strongly suggests that l-ase inhibits mTORC1 in an AA-dependent manner (Figure 3E).
Finally, as l-ase inhibits 4E-BP1 phosphorylation at residue S65, which is absolutely required to maintain active cap-mRNA translation, we evaluated the effects of l-ase on protein synthesis. In all leukemic cell lines tested, l-ase significantly inhibited [35S] methionine incorporation into newly synthesized proteins, indicative of global protein synthesis inhibition (Figure 3F). Moreover, in AML cell lines and a representative primary AML sample, l-ase inhibited c-Myc and Mcl-1 expression, whose translation is cap dependent, in a dose-dependent manner (Figure 3G).
Overall, these results indicate that the glutaminase activity of l-ase leads to mTORC1 inhibition in AML cells, resulting in protein synthesis inhibition, and that this effect is due, at least in part, to an inhibition of the AA/mTORC1-sensing machinery.
l-ase induces apoptosis in AML cells through its glutaminase activity
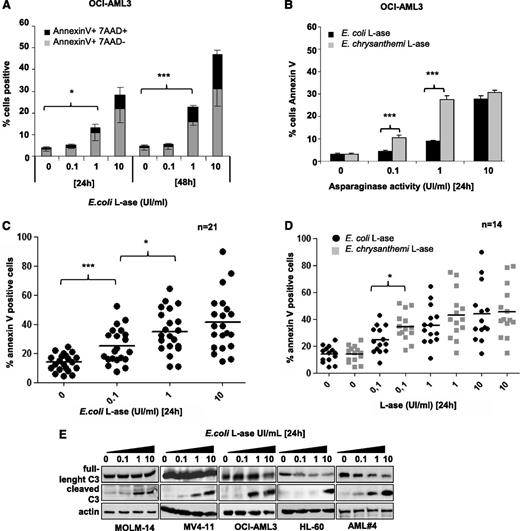
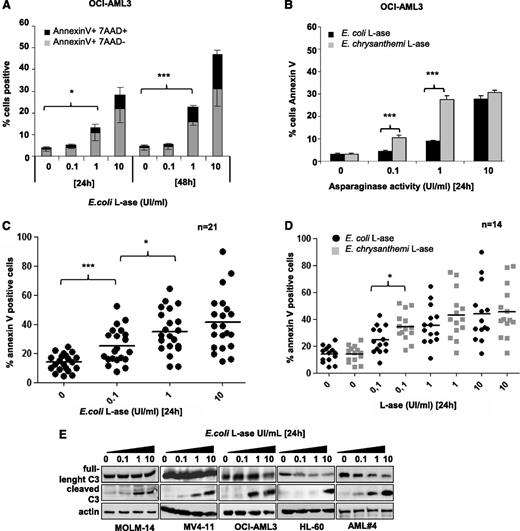
The functional effects of l-ase were tested in leukemic cell lines and primary AML cells. In OCI-AML3 cells, E colil-ase induced both time- and dose-dependent apoptosis (Figure 4A), with higher potency seen for E chrysanthemil-ase than E colil-ase (Figure 4B). This difference is probably due to the higher rate of glutamine depletion obtained with E chrysanthemil-ase (Figure 3C). Similar results were observed in the MOLM-14, MV4-11, and HL-60 cell lines (supplemental Figure 4A). Significant apoptosis was also induced by E colil-ase in almost all primary AML samples examined (Figure 4C). E chrysanthemil-ase–induced apoptosis was statistically superior to E colil-ase at the 0.1 UI/mL dose in these samples (Figure 4D). In the AML cell lines and patient samples analyzed, l-ase induced caspase-3 cleavage (Figure 4E).
l-ase induces apoptosis in leukemic cells. OCI-AML3 cells and primary AML samples were cultured for 24 or 48 hours in 10% FBS MEM with or without 0.1, 1, or 10 UI/mL of E coli or E chrysanthemil-ase. Apoptosis was determined by Annexin V +/− 7AAD binding using flow cytometry (A-D) or by western blotting using an anti-caspase 3 antibody (E).
l-ase induces apoptosis in leukemic cells. OCI-AML3 cells and primary AML samples were cultured for 24 or 48 hours in 10% FBS MEM with or without 0.1, 1, or 10 UI/mL of E coli or E chrysanthemil-ase. Apoptosis was determined by Annexin V +/− 7AAD binding using flow cytometry (A-D) or by western blotting using an anti-caspase 3 antibody (E).
To determine the sensitivity of AML cells to asparagine starvation, we starved leukemic cell lines from this AA. Asparagine removal induced significant apoptosis only in MV4-11 cells, whereas other leukemic cell lines were resistant to this condition (supplemental Figure 4B). Overall, these results indicate that l-ase has significant antileukemic activity in AML and that this is mainly related to its glutaminase activity.
l-ase increases GS expression in AML
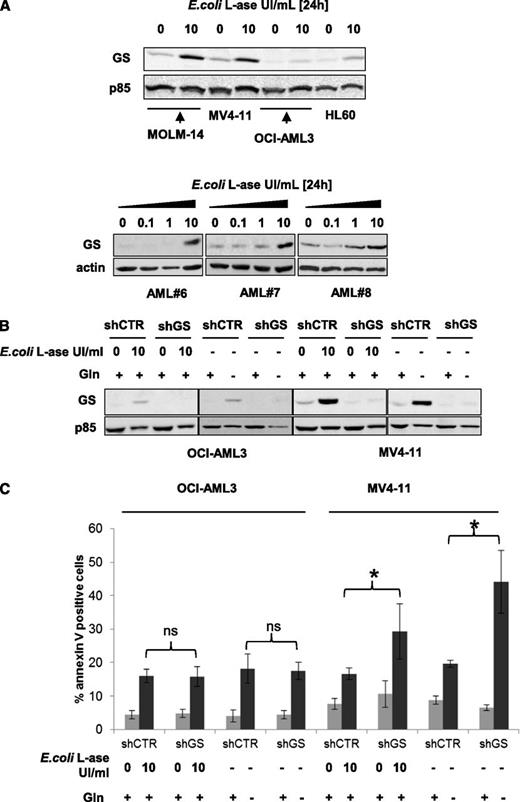
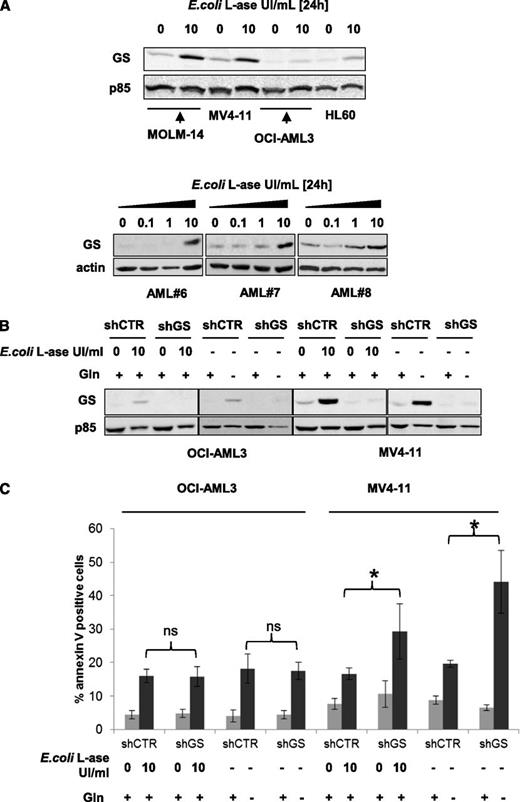
The GS enzyme produces glutamine from glutamate. We studied the basal expression of this enzyme and after 24 hours of E colil-ase exposure. Basal levels of GS expression were rather low in OCI-AML3 and HL-60 cells but more prominent in MOLM-14 and MV4-11 cells, and l-ase increased GS expression in all of these leukemic cell lines (Figure 5A upper panel). In primary AML samples, l-ase also increased GS expression in a dose-dependent manner (Figure 5A lower panel). All cell lines were stably infected with a lentiviral vector expressing a GS shRNA (shRNA1 shown; similar results with shRNA2) that produced a persistent inhibition of GS expression even when cells were treated with E colil-ase or cultured without glutamine (Figure 5B; supplemental Figure 5A). GS inhibition had no effect on glutamine starvation or l-ase–induced apoptosis in OCI-AML3, MOLM-14, or HL-60 cells but significantly increased the level of apoptosis in MV4-11 cells (Figure 5C; supplemental Figure 5B). These results indicate that in some leukemic cells, GS expression may represent a mechanism of resistance to the antileukemic activity of l-ase.
l-ase increases GS expression in AML, which may represent a mechanism of resistance tol-ase. (A) MOLM-14, OCI-AML3, and primary AML blast cells from 3 patients were cultured over a 24-hour period with or without 0.1, 1, or 10 UI/mL E colil-ase. GS expression was determined by western blotting. (B) OCI-AML3 and MV4-11 cells were stably infected with a lentiviral vector expressing either a CTR or a GS shRNA and then cultured with or without 10 UI/mL E colil-ase and with or without glutamine at 4 mM for 24 hours. Western blotting was then performed to assess the GS expression level. (C) The same cell lines were tested by flow cytometry analysis of Annexin V fixation for apoptosis induction after 24 hours in the presence or absence of E colil-ase at 10 UI/mL and with or without glutamine starvation.
l-ase increases GS expression in AML, which may represent a mechanism of resistance tol-ase. (A) MOLM-14, OCI-AML3, and primary AML blast cells from 3 patients were cultured over a 24-hour period with or without 0.1, 1, or 10 UI/mL E colil-ase. GS expression was determined by western blotting. (B) OCI-AML3 and MV4-11 cells were stably infected with a lentiviral vector expressing either a CTR or a GS shRNA and then cultured with or without 10 UI/mL E colil-ase and with or without glutamine at 4 mM for 24 hours. Western blotting was then performed to assess the GS expression level. (C) The same cell lines were tested by flow cytometry analysis of Annexin V fixation for apoptosis induction after 24 hours in the presence or absence of E colil-ase at 10 UI/mL and with or without glutamine starvation.
l-ase induces a strong autophagy in AML cells
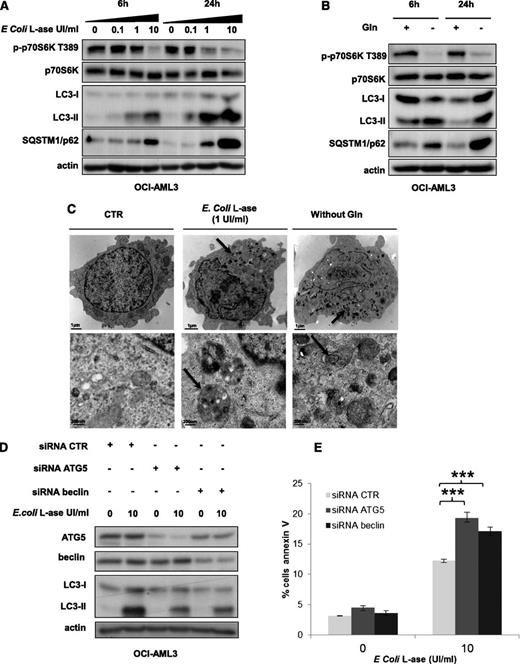
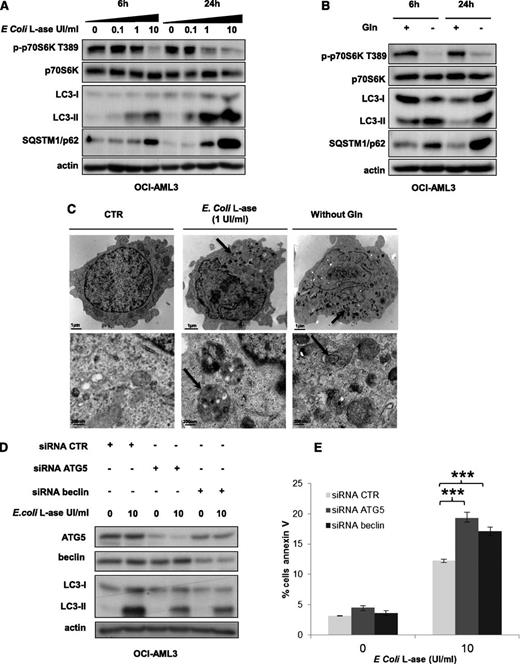
As mTORC1 controls the activity of key proteins of the autophagic process, such as Atg1/ULK and ATG13,19 we addressed the question of autophagy induction by l-ase or glutamine removal in AML cells. In OCI-AML3 cells, l-ase significantly induced, in a dose- and time-dependent manner, an accumulation of both the LC3-II form and the p62/SQSTM1 protein, reflecting autophagy induction (Figure 6A). Similar results were observed in the MOLM-14 cell line (data not shown). Moreover, glutamine starvation increased LC3-II and p62/SQSTM1 expression (Figure 6B). We then examined the morphology of OCI-AML3 cells by transmission electron microscopy and observed the appearance of numerous electron-dense inclusions in the cytosol after l-ase exposure, indicative of autophagy (Figure 6C). To determine the impact of l-ase–induced autophagy on AML cell death, we blocked autophagy in OCI-AML3 cells using siRNAs to knock down ATG5 or Beclin; the inhibition of ATG5 or Beclin expression decreased l-ase–induced autophagy, attested by lowered LC3-II band accumulation (Figure 6D). Apoptosis was then quantified using Annexin V fixation in OCI-AML3 cells expressing these same siRNAs, and we observed that an autophagy blockade significantly increased l-ase–induced apoptosis in OCI-AML3 cells that had undergone an ATG5 or beclin knockdown (Figure 6E).
l-ase induces strong protective autophagy in AML cells. (A-B) OCI-AML3 cells were cultured for 6 or 24 hours in 10% FCS MEM with or without 0.1, 1, and 10% FCS MEM with or without 0.1, 1, or 10 UI/mL of E colil-ase and with or without Gln as indicated. Autophagy was detected by western blotting using anti-LC3b and p62/SQSTM1 antibodies. (C) Representative electron micrographs of OCI-AML3 cells collected after 24 hours of culture in MEM with or without E colil-ase (1 UI/mL) and without glutamine. Arrows indicate autophagic vesicles. Upper and lower panels show 2 different scales. (D) OCI-AML3 cells were transfected with anti-ATG5 or anti-beclin siRNAs using the Amaxa nucleofector kit. Two days after transfection, cells were cultured for 24 hours with or without E colil-ase at 10 UI/mL and western blotting was performed to verify ATG5 and Beclin knockdowns, respectively. (E) Viability was measured in OCI-AML3 cells (transfected or not with anti-ATG5 or anti-Beclin siRNA and treated or not with E colil-ase) by flow cytometry analysis of Annexin V fixation. The histograms shown represent the mean values of 3 independent experiments.
l-ase induces strong protective autophagy in AML cells. (A-B) OCI-AML3 cells were cultured for 6 or 24 hours in 10% FCS MEM with or without 0.1, 1, and 10% FCS MEM with or without 0.1, 1, or 10 UI/mL of E colil-ase and with or without Gln as indicated. Autophagy was detected by western blotting using anti-LC3b and p62/SQSTM1 antibodies. (C) Representative electron micrographs of OCI-AML3 cells collected after 24 hours of culture in MEM with or without E colil-ase (1 UI/mL) and without glutamine. Arrows indicate autophagic vesicles. Upper and lower panels show 2 different scales. (D) OCI-AML3 cells were transfected with anti-ATG5 or anti-beclin siRNAs using the Amaxa nucleofector kit. Two days after transfection, cells were cultured for 24 hours with or without E colil-ase at 10 UI/mL and western blotting was performed to verify ATG5 and Beclin knockdowns, respectively. (E) Viability was measured in OCI-AML3 cells (transfected or not with anti-ATG5 or anti-Beclin siRNA and treated or not with E colil-ase) by flow cytometry analysis of Annexin V fixation. The histograms shown represent the mean values of 3 independent experiments.
We conclude from these results that l-ase induces strong autophagy that could partially protect AML cells from apoptosis.
Discussion
The targeting of metabolic processes has emerged as a very promising approach to cancer treatment, which is due to the increased metabolic inputs, including glucose and glutamine, that are required for optimal proliferation and survival of cancer cells.20-22 Glutamine is a core substrate for protein, glucosamine, and nucleotide synthesis and is metabolized by glutaminases into glutamate, which then enters the TCA cycle to produce ATP after conversion to α-ketoglutarate.23 In addition to its role in cellular metabolism, glutamine appears to be essential for mTORC1 activation by leucine. Hence, we analyzed in this study the dependence of AML cells on glutamine for survival as well as different ways to target glutamine uptake by leukemic cells. We show from our experiments that leucine or glutamine removal inhibits mTORC1 activation in different AML cell lines and in primary AML samples, further inducing apoptosis, whereas glutamine starvation seems to have no effect on normal CD34+ cells.
We then focused our attention on the SLC1A5 transporter whose loss of function has been shown to inhibit cell growth and activate autophagy.15 SLC1A5 is necessary for glutamine uptake by epithelial cells and by some cancer cells in culture, but few data concerning glutamine transport in hematopoietic cells have been reported.24 The SLC1A5 transporter is expressed in all leukemic cell lines we tested. In MOLM-14 cells, shRNA-mediated inhibition of SLC1A5 expression prevented p70S6K T389 phosphorylation induced by AA stimulation. Moreover, inhibition of SLC1A5 expression showed antileukemic activity, triggered apoptosis, and markedly reduced the growth of MOLM-14 tumors in a xenograft mouse model. However, full inhibition of SLC1A5 expression in HL-60 cells did not induce apoptosis. This may be due to the expression of other glutamine transporters in accordance with previous observations that mTORC1 can be reactivated by AA stimulation in HL-60 cells after SLC1A5 knockdown.25,26
Because AML cells depend on glutamine for survival, we tested the effects of l-ase. This drug is essential in the treatment of acute lymphoid leukemias (ALLs) and induces a 60% of complete remission (CR) rate as a monotherapy.27-29 l-ases from E coli and E chrysanthemi were tested in our experiments. Each of these species of l-ase has glutaminase activity corresponding to 3% and 10% of the total asparaginase activity, respectively. In vivo, a strong correlation between the serum l-ase activity and the rates of AA depletion have been observed under treatment.30-32 Repeated injections of E chrysanthemil-ase (25 000 UI/m2 every 48 hours) resulted in very low levels of asparagine and glutamine in the serum of the patients.33
We observed that l-ase induces the rapid and complete depletion of intracellular glutamine in leukemic cells. We also observed that, in contrast to ALL cells, asparagine is not essential for AML cell survival. Indeed, only MV4-11 cells are moderately sensitive to asparagine removal in terms of apoptosis induction. Moreover, glutamine, but not asparagine, starvation inhibits mTORC1 activity. We then observed that both the E coli and E chrysanthemil-ases inhibit mTORC1 activity through their glutaminase activity. Similar results were observed in primary AML samples treated with E colil-ase; mTORC1 inhibition was achieved in all patients tested at 24 hours using a dose of 1 UI/mL. We observed that mTORC1 inhibition by glutamine depletion results in mTORC2 overactivation, as we previously reported in AML cells using the mTORC1 inhibitor RAD001.2 Moreover, by inhibiting 4E-BP1 phosphorylation downstream of mTORC1, l-ase inhibited global protein synthesis. A few reports have previously established a link between l-ase and mTORC1.34,35 In ALL cell lines, l-ase was previously found to inhibit mTORC1 activity, whereas other kinases, including Akt, were unaffected.34 Moreover, the l-ase–induced inhibition of S6K phosphorylation was also previously found to be diminished in a Jurkatt clone resistant to this drug.34 MTORC1 inhibition has also been observed in vivo in the liver and pancreas of mice treated with l-ase. In contrast, l-ase without glutaminase activity isolated from Wolinella succinogenes does not suppress mTORC1 activity in mice.35 The mechanism by which l-ase inhibits mTORC1 is probably interference with AA-mediated mTORC1 activation. Indeed, we showed in our present experiments that expression of a Raptor-Rheb15 protein in HEK293 cells, which forces the localization of mTORC1 to the lysosome surface,18 is sufficient to render the mTORC1 pathway partially resistant to l-ase and glutamine starvation.
We further show from our present analyses that l-ase has antileukemic potential and potently induces apoptosis in AML cells. In the years from 1970 to 1980, l-ase was tested in AML with CR rates of ∼10% as a monotherapy.36,37 Subsequently, a randomized study compared the effects of a high dose of cytarabine with or without E colil-ase in refractory and relapsed AML in adults and the association revealed a significantly increased CR rate (40% vs 24%).38 The high-dose cytarabine plus l-ase regimen is currently used in pediatric AML treatment protocols.39 In children, all studies that have compared the sensitivity of primary blast cells from ALL and AML to l-ase treatment concluded that AML blast cells are less sensitive to l-ase. However, blast cells from the M1, M4, and M5 FAB subtypes previously displayed an in vitro sensitivity to l-ase that was very close to that of ALL.40-42 Although our current study testing the effects of l-ase in a cohort of 21 patients does not allow us to draw definitive conclusions, we speculate that some AML subtypes may exhibit a particular sensitivity to l-ase.
A further question we addressed was the characterization of acquired or intrinsic mechanisms of resistance to l-ase. In ALL, expression of the asparagine synthase gene is transcriptionally increased by l-ase.43,44 Similarly, l-ase increased the expression of the GS protein in the ALL MOLT-4 cell line, which correlated with l-ase sensitivity.45 In T-cell–ALL, rat fibrosarcoma, or human hepatocarcinoma cells, GS inhibition by the l-methionine-sulfoximine restores the sensitivity to l-ase in resistant cell lines.45-47 We observed that l-ase increased GS expression in all of the AML cell lines and primary AML cells tested. However, shRNA-mediated GS knockdown increased l-ase–induced apoptosis only in MV4-11 cells but not in other AML cell lines in our panel, indicating that l-ase–induced GS expression may constitute a mechanism of resistance to l-ase in certain cases. Similar results were observed only in MV4-11 cells when glutamine was removed.
Finally, we observed that autophagy is strongly induced in AML by either glutamine removal or l-ase treatment. This process may be partially protective against AML cell death and may represent a general mechanism of resistance to l-ase in cancers. Autophagy protects some tumor cells from chemotherapy-induced cell death, and ongoing clinical trials are aimed at combining autophagy inhibitors with other cancer treatments.48,49 The future testing of a combination of autophagy inhibitors and l-ase is therefore warranted in AML.
Overall, by using different approaches, we show that targeting the glutamine uptake into leukemic cells represents a new therapeutic strategy in AML. It facilitates protein synthesis inhibition downstream of mTORC1. Our results also suggest that high glutamine uptake may sustain constitutive mTORC1 activation in AML. We also provide a rationale for l-ase treatment in AML and suggest that inhibiting autophagy or GS activity may improve the antileukemic activity of l-ases in this disease.
The online version of this article contains a data supplement.
There is an Inside Blood commentary on this article in this issue.
The publication costs of this article were defrayed in part by page charge payment. Therefore, and solely to indicate this fact, this article is hereby marked “advertisement” in accordance with 18 USC section 1734.
Acknowledgments
We thank Dr D. Rabier (Biochimie Métabolique, Hôpital Necker Enfants Malades, Paris, France) for helpful discussions concerning glutaminolysis. We also thank the EUSA Pharma laboratory (Lyon, France) for kindly providing the E colil-ase (Kidrolase) and the E chrysanthemil-ase (Erwinase) for in vitro experiments.
This work was supported by grants from the Association de la Recherche contre le Cancer (contrat libre). We also thank the Institut National du Cancer and the Fond d’Etude et de Recherche du Corps Médical des hôpitaux de Paris for the funding of N.J.
Authorship
Contribution: L.W. and N.J. analyzed data, performed the experiments, and wrote the manuscript with equal contribution; A.J. and P.A. performed experiments concerning autophagy; N.N. performed experiments concerning measurement of glutamine and l-ase levels; T.T.M. and I.C.M. performed in vivo experiments; M.L. helped designing the molecular constructions; A.S. performed the electron microscopy experiments; L.P. and A.S.G. performed in vitro experiments on primary AML cells; M.U. and N.I. helped with recruiting and analyzing AML samples; O.K. performed molecular analysis on primary AML samples; I.R.-W. performed cytogenetic analysis on primary AML samples; V.B. and N.C. performed the cytological and flow cytometry analysis on primary AML samples; C.L. and P.M. wrote the manuscript; J.T. analyzed data and wrote the manuscript; and D.B. designed the research plan, analyzed the data, and wrote the manuscript.
Conflict-of-interest disclosure: The authors declare no competing financial interests.
Correspondence: Didier Bouscary, UF d’Hématologie, Hôpital Cochin, AP-HP, Paris, France; e-mail: didier.bouscary@cch.aphp.fr.
References
Author notes
L.W. and N.J. contributed equally to this study.

![Figure 3. The glutaminase activity of l-ase inhibits mTORC1 and protein translation in AML cells. (A) OCI-AML3 cells were cultured for 24 hours with the indicated doses of E coli l-ase, and the levels of glutamine and asparagine in the intracellular compartment were quantified by ion exchange chromatography. (B) The OCI-AML3 cell line was cultured for 6 or 24 hours with or without E coli or E chrysanthemi l-ases at an equal level of asparaginase activity (0.1-10 UI/mL) and then lysed in Laemmli buffer. Western blotting was performed with anti-phospho-p70S6K T389, anti-phospho-4E-BP1 S65, anti-p70S6K, anti-4E-BP1, and anti-actin antibodies. (C) Cells were treated as indicated in B, and the level of Gln in the extracellular medium was quantified by ion exchange chromatography. (D) Primary bone marrow leukemic cells from AML patients were treated as in A, and the same analysis was assessed by western blotting. The intensities of phospho-p70S6K T389, phospho-4E-BP1 S65, and actin signals were quantified in different AML samples. Ratios of phospho-p70S6K T389 or phospho-4E-BP1 S65 to actin were calculated and assigned a reference value of 1 in the control culture. (E) HEK-293T cells were transfected with a Flag-Raptor-Rheb15 expression vector or a control vector and then cultured for 24 hours with or without glutamine at 4 mM or E coli l-ase (10 UI/mL). Western blotting was then performed with anti-flag, anti-actin, or anti-phospho-p70S6K T389 antibodies. (F) [S35] methionine pulses were performed in MOLM-14, OCI-AML3, MV4-11, and HL-60 cells to evaluate the global protein synthesis profile with or without E coli l-ase at 10 UI/mL during a 6-hour period. (G) OCI-AML3, MOLM-14, MV4-11, and HL-60 cell lines and a representative AML sample were cultured for 24 hours with or without E coli l-ase. The expression of Mcl-1 and c-Myc was then analyzed by western blotting.](https://ash.silverchair-cdn.com/ash/content_public/journal/blood/122/20/10.1182_blood-2013-03-493163/4/m_3521f3.jpeg?Expires=1769871787&Signature=cSGEYp79KuG9AFDtZy3rS31adKQy3efBBhds3iQ9P5RocXGp5OqEag98a7~r0~EPotfQwax4ecMkldMZPrX2NiSs76WeO7AeJXoOGbYuAcfpnPl8IjX2PD78FFj2SwHRG3iZnFNs~TJYQs46mCrbOoMsnPyJoS5QK-3BDvXoSpfJCwhwPTfJLEpg8Y~fbZluOWnT0SkmYl450OrAWe379TDLswpbwBBq6nZ0D-v8rORJhMa2KYqBXF6WoWUldO~VyVeyQLrhbqgs6WaGulc0-7irqJsTExoyGIvH4LsxzPZyv0ONIkJ3A2S9DGZ1RDc~OrDthmnp-miepDc9uNKKgA__&Key-Pair-Id=APKAIE5G5CRDK6RD3PGA)

![Figure 3. The glutaminase activity of l-ase inhibits mTORC1 and protein translation in AML cells. (A) OCI-AML3 cells were cultured for 24 hours with the indicated doses of E coli l-ase, and the levels of glutamine and asparagine in the intracellular compartment were quantified by ion exchange chromatography. (B) The OCI-AML3 cell line was cultured for 6 or 24 hours with or without E coli or E chrysanthemi l-ases at an equal level of asparaginase activity (0.1-10 UI/mL) and then lysed in Laemmli buffer. Western blotting was performed with anti-phospho-p70S6K T389, anti-phospho-4E-BP1 S65, anti-p70S6K, anti-4E-BP1, and anti-actin antibodies. (C) Cells were treated as indicated in B, and the level of Gln in the extracellular medium was quantified by ion exchange chromatography. (D) Primary bone marrow leukemic cells from AML patients were treated as in A, and the same analysis was assessed by western blotting. The intensities of phospho-p70S6K T389, phospho-4E-BP1 S65, and actin signals were quantified in different AML samples. Ratios of phospho-p70S6K T389 or phospho-4E-BP1 S65 to actin were calculated and assigned a reference value of 1 in the control culture. (E) HEK-293T cells were transfected with a Flag-Raptor-Rheb15 expression vector or a control vector and then cultured for 24 hours with or without glutamine at 4 mM or E coli l-ase (10 UI/mL). Western blotting was then performed with anti-flag, anti-actin, or anti-phospho-p70S6K T389 antibodies. (F) [S35] methionine pulses were performed in MOLM-14, OCI-AML3, MV4-11, and HL-60 cells to evaluate the global protein synthesis profile with or without E coli l-ase at 10 UI/mL during a 6-hour period. (G) OCI-AML3, MOLM-14, MV4-11, and HL-60 cell lines and a representative AML sample were cultured for 24 hours with or without E coli l-ase. The expression of Mcl-1 and c-Myc was then analyzed by western blotting.](https://ash.silverchair-cdn.com/ash/content_public/journal/blood/122/20/10.1182_blood-2013-03-493163/4/m_3521f3.jpeg?Expires=1769871788&Signature=C0G6CAwrNa52j6mWQSbqbO2Q8nbeXukA5zLqW1W1VyIO0W3navqdxEYZJef9XdxTNVHXKRPVpk8r8qajNMpmREActsiktCvh9FDkCrC2MDnj9LkvGCMmpM2DtKTe11jSxwKLDjbjv4PZZMUbDu7NNh6VNI~VjRO7PXjLECJ9PwHBB35P5Mrfe6hqdAiElmfLuNC6w6TYitUTbUBMgLbfN8ABGZvfqGZMSJQALoAWgTM1UxxEoDJUG523FNRSgTO1fm9cFO9n9x0oNmIDJlawFeE2fBh~stSuK8yW1o8RV34qHg33EVdJ53oD9rHniV4hQLX38NAE4OEPKPWyzIXBIQ__&Key-Pair-Id=APKAIE5G5CRDK6RD3PGA)
