Key Points
Loss of imprinting occurs at the 14q32 domain in APL.
DNA methylation at the CTCF binding sites correlates with the overexpression of 14q32 miRNAs.
Abstract
Distinct patterns of DNA methylation characterize the epigenetic landscape of promyelocytic leukemia/retinoic acid receptor-α (PML-RARα)–associated acute promyelocytic leukemia (APL). We previously reported that the microRNAs (miRNAs) clustered on chromosome 14q32 are overexpressed only in APL. Here, using high-throughput bisulfite sequencing, we identified an APL-associated hypermethylation at the upstream differentially methylated region (DMR), which also included the site motifs for the enhancer blocking protein CCCTC-binding factor (CTCF). Comparing the profiles of diagnostic/remission paired patient samples, we show that hypermethylation was acquired in APL in a monoallelic manner. The cytosine guanine dinucleotide status of the DMR correlated with expression of the miRNAs following a characteristic position-dependent pattern. Moreover, a signature of hypermethylation was also detected in leukemic cells from an established transgenic PML-RARA APL mouse model at the orthologous region on chromosome 12, including the CTCF binding site located upstream from the mouse miRNA cluster. These results, together with the demonstration that the region does not show DNA methylation changes during myeloid differentiation, provide evidence that 14q32 hypermethylation is implicated in the pathogenesis of APL. We propose a model in which loss of imprinting at the 14q32 domain leads to overexpression of the miRNAs in APL.
Introduction
Acute promyelocytic leukemia (APL) is a subclass of acute myeloid leukemia (AML) characterized by the balanced reciprocal translocation t(15;17)(q22;q11-12) resulting in the fusion between the promyelocytic leukemia gene (PML) and the retinoic acid receptor-α (RARA) gene.1 The chimeric protein PML-RARα leads to a block of myeloid cell differentiation through constitutive repression of retinoic acid responsive genes.2 This is consistent with the typical accumulation of abnormal hematopoietic progenitor cells blocked at the promyelocyte stage. Accordingly, PML-RARα has been shown to induce APL in transgenic mice.3 However, deregulation of the retinoic acid pathway is insufficient to initiate APL,4 and several studies have shown additional genetic and epigenetic processes that accompany the expression of the PML-RARα protein,5,6 also involving master transcription regulators7 and modulators of chromatin structure.8,9
MicroRNAs (miRNAs) are single-stranded small noncoding RNAs (sncRNAs) that negatively regulate the expression of target genes.10 They have been extensively associated with cancer as regulators of cell proliferation, differentiation, and apoptosis.11 We have previously reported a signature of overexpressed miRNAs in APL.12 These miRNAs are clustered in the DLK1-DIO3 imprinted domain on chromosome 14q32,13,14 and their specific upregulation in primary APL cells was also confirmed by other groups in 3 independent studies.15-17 Almost a hundred sncRNAs (53 miRNAs and 41 small nucleolar RNAs [snoRNAs]) are embedded in the DLK1-DIO3 domain arranged in 2 clusters and spanning more than 200 kb. There is a growing interest in the 14q32 miRNAs because they are deregulated in human diseases and cancers,18-20 they possess oncogenic and tumor suppressor properties,21,22 and they are likely to be involved in the imprinting regulation at 14q32.23,24 In the DLK1-DIO3 domain, all noncoding genes are expressed only from the maternal allele. In particular, miRNAs are thought to be generated from polycistronic RNAs and coordinately regulated with the noncoding gene MEG3, located upstream.13 In contrast, the protein-coding genes are paternally expressed.25,26 This pattern of gene expression is under the control of 3 differentially methylated region (DMRs).25,27 The primary imprinting regulation is exerted by the intergenic DMR (IG-DMR) that lies between the 2 reciprocally imprinted genes DLK1 and MEG3 and functions as the imprinting control region.27,28 Two secondary DMRs, overlapping DLK1 (DLK1-DMR) and the promoter and beginning of MEG3 (MEG3-DMR) contribute to the regulation of the imprinted genes. The MEG3-DMR includes 7 putative binding sites for CCCTC-binding factor (CTCF),25,29 an enhancer blocking protein implicated in transcriptional activation/repression and imprinting. CTCF exerts its regulatory function by binding to unmethylated DNA in an allele-specific manner, thus preventing the expression of target genes.30,31
In the present study, we report the DNA methylation profiling of the IG-DMR and the MEG3-DMR at a single-nucleotide resolution in a cohort of primary AML samples and normal hematopoietic cells by next-generation sequencing. The method used, giving output sequence reads with an average read length of 400 bp, enabled the allele-specific analysis of the cytosine guanine dinucleotide (CpG) sites. We detected loss of imprinting (LOI) in primary APL cells at the MEG3-DMR. Hypermethylation of the CTCF binding sites was consistent with the previously reported overexpression of miRNAs. A similar DNA methylation pattern was also detected in APL blasts in an established transgenic mouse model, further implicating LOI at 14q32 in APL pathogenesis.
Methods
Patients and samples
Bone marrow (BM) and peripheral blood (PB) samples were obtained from St. Bartholomew’s Hospital tissue bank. Specimens were collected for research purposes after written informed consent. This study was conducted in accordance with the Declaration of Helsinki. Six BM/PB samples from healthy donors were obtained from the transplantation department, whereas the remaining 2 were purchased from Lonza Group Ltd. (Basel, Switzerland). Ethical approval to access the stored material and perform the study described here was obtained from the East London and The City Health Authority Research Ethics Committee (ref. 10/H0704/65). Of a total of 51 specimens (supplemental Table 1; see the Blood Web site), 27 were diagnostic samples from 15 patients with APL with t(15;17)/PML-RARA, 10 were diagnostic samples (normal karyotype [NK], n = 4; inv(16), n = 3; t(8;21), n = 3), and 2 patients with non-Hodgkin lymphoma with noninfiltrated BM were included. Diagnosis was based on the World Health Organization criteria.32 As controls, we also included in the study the remission paired samples for 12 patients with APL and for the 4 patients with AML NK and 8 BM/PB samples from healthy donors.
Isolation of human myeloid progenitors
Samples of granulocyte colony-stimulating factor–mobilized PB cells from 4 healthy donors were collected following informed consent. Mononuclear cells were obtained by density centrifugation using Ficoll-Paque (GE Healthcare Life Sciences) and stained with PerCP anti-CD34 (clone 8G12), PECY7 anti-CD38 (clone HIT2), APC anti-CD45RA (clone H100), PE anti-CD123 (clone 7G3), and fluorescein isothiocyanate–conjugated antibodies specific for lineage (Lin) mixture 1, all from BD Biosciences, for 30 minutes at 4°C. Cells were then washed in 2% fetal calf serum with phosphate-buffered saline and resuspended in 0.2 ug/mL of 4′,6-diamidino-2-phenylindole dihydrochloride. Sorting was performed on a BD Aria. Gates were set up to exclude debris and nonviable cells and sorted in the following fractions: Lin–CD34+CD38– (hematopoietic stem cells, HSCs), Lin–CD34+CD38+CD45RA–CD123+ (common myeloid progenitors), Lin–CD34+CD38+CD45RA+CD123+ (granulocyte-monocyte progenitors), and Lin–CD34+CD38+CD45RA–CD123– (megakaryocyte-erythrocyte progenitors). Purity checks were performed to ensure sort quality. Genomic DNA was extracted and successfully used for sequencing analysis from all the sorted cell fractions, with the exception of the HSC fraction, for which only 2 samples were recovered.
Isolation of transgenic PML-RARA APL cells
To generate transgenic APL cells for epigenetic profiling, serial transplantation of blasts was undertaken using an established hMRP8-PML-RARA transgenic model.3 Bulk APL leukemic cells (5-8 × 10⁵) were injected intravenously into 3 recipient mice (FVB/N) after sublethal irradiation (4.5 Gy). Mice developed overt APL in 4 weeks posttransplantation. BM cells were collected by flushing buffered saline through mouse long bones. Cells were pelleted by low-speed centrifugation and were resuspended in Trizol. As controls, 3 healthy mice and 1 irradiated mouse were also included in the study. Experiments were conducted following ethical approval (ref. PPL 70/6766).
Bisulfite sequencing
Details of the 14q32 domain were obtained from the Genome Ensemble browser (http://www.ensembl.org/index.html) and previous publications.25,29,33 Genomic DNA was bisulfite converted using the EZ DNA Methylation kit according to the manufacturer’s instructions (Zymo Research). The primers used (supplemental Table 2) were designed using the MethPrimer program (http://www.urogene.org/methprimer/index1.html) and included the Roche 454 adapter sequence and 2 alternative 4-nucleotide sequence tags (bar-code). The list of the primer pairs used for DNA amplification is presented in supplemental Table 2. All primers were tested for their ability to yield specific products. Amplicons were generated using FastStart High Fidelity PCR System (Roche Applied Science). Polymerase chain reaction (PCR) amplicons were subjected to quality checks using the Agilent Bioanalyzer, purified with AMPure beads (Agencourt, Beverly, MA), and quantified using the Quant-iT Picogreen dsDNA assay kit. To minimize the number of experiments performed on the Roche 454 platform, we used pools of the human remission samples, whereas all the diagnostic, healthy donor, and murine specimens were treated separately. However, 6 remission samples from 5 APL and 1 AML NK were sequenced separately to obtain data for 6 diagnostic/remission sample pairs. The purified PCR products were sequenced using the Roche 454 Life Sciences Genome Sequencer GS FLX Titanium according to the manufacturer’s protocols (454 Life Sciences, Branford, CT).
Sequence data analysis
After trimming off the bar-code and adapter sequence, the CpG methylation status was determined using the character-based user interface version of the QUMA tool (quantification tool for methylation analysis; http://quma.cdb.riken.jp)34 referring to the human and mouse genome sequence (GRCh37/hg19; GRCm38/mm10). The percent identity score was normalized to the read length. Sequence reads were filtered depending on the identity score (sequences with identity score <90% or >10 mismatches were discarded) and the conversion efficiency (sequences with conversion efficiency <95% or >5 unconverted cytosines in CpH [non-CpG] sites were discarded). The R project (R version 2.12.1; http://www.R-project.org) was used for statistical and cluster analysis. Unsupervised clustering analysis of samples and CpG sites was performed using Manhattan and Pearson distance metrics, respectively. Pairwise Student t tests with Benjamini and Hochberg correction for multiple testing were applied across the sample groups. For the comparison of methylation levels between diagnostic/remission sample pairs, a threshold of 3σ from bootstrap mean estimation of methylation differences was used. The significance of overlap between differentially methylated CpG sets was verified by means of the hypergeometric test.35 Kruskall-Wallis statistics were used to compare the methylation profiles determined for murine samples. A search of the single-nucleotide polymorphism (SNP) database available at the University of California, Santa Cruz genome annotation database identified 18 SNPs in total (http://hgdownload.cse.ucsc.edu/goldenPath/hg19/database; dbSNP build 131). C/T SNPs were excluded because they were not suitable for bisulfite-treated DNA, and 12 SNPs (supplemental Table 2) were used to interrogate the sequence reads. Allele-specific methylation changes between diagnosis/remission paired samples were identified using a χ2 test.
Quantitative real-time PCR
Total RNA was extracted using Trizol, as per the manufacturer’s instructions (Invitrogen, Life Technologies, Carlsbad, CA) from a cohort of samples including the diagnostic samples from 9 patients with APL, 3 AML NK, 3 AML t(8;21), 3 AML inv(16), and 5 complete remission samples. Concentration and quality were assessed using the Agilent Bioanalyzer. The relative expression of each miRNA was determined using TaqMan miRNA assays (Applied Biosystems, Foster City, CA). Experiments were performed in triplicate on an ABI Prism 7700 Sequence Detection System (Applied Biosystems). Analysis of relative gene expression was performed using the ΔCt method.36 Normalization was performed against RNAU6.
Correlation between DNA methylation and gene expression
DNA methylation data of each CpG site were correlated with miRNA expression values (2ΔCt) across the samples computing the Pearson correlation coefficients. A P-value threshold of .05 was applied to select miRNAs positively/negatively correlated with the methylation status at each CpG site.
Results
DNA methylation analysis by high-throughput sequencing
For the DNA methylation analysis of the 51 samples (see “Methods”), we generated amplicon libraries from 9 distinct regions in the human 14q32 domain, overlapping the IG-DMR, the MEG3-DMR, 4 CpG islands, and including 7 CTCF putative binding sites enclosed in the MEG3-DMR (supplemental Figure 1). The identification of CTCF binding sites (CTCF A-B-C-D-E-F-G) (supplemental Table 2) was based on previously published sequences experimentally confirmed by electrophoretic mobility shift assay and chromatin immunoprecipitation.29 The domain is highly conserved in mouse spanning 1 Mb at the distal region of chromosome 12.33 Further amplicon libraries were obtained from the mouse genome at the CpG island located upstream from the MEG3 ortholog gene (mouse Gtl2) and the CTCF binding site corresponding to the human CTCF G. In total, 641 single amplicon libraries ranging from 332 bp to 496 bp (supplemental Table 2) were produced from human and murine samples. For a detailed overview of samples’ characteristics, see “Methods.”
A total of 1 318 267 read sequences were generated using high-throughput amplicon bisulfite sequencing (454 GS FLX Titanium; Roche) (Table 1). After quality control check, 1 058 189 sequences with a bisulfite conversion rate of 99.01% and a sequencing accuracy of 99.62% were used to determine the methylation status of 248 CpGs. On average, 1802 sequence reads were analyzed per amplicon per sample.
Overall methylation profiling at human 14q32
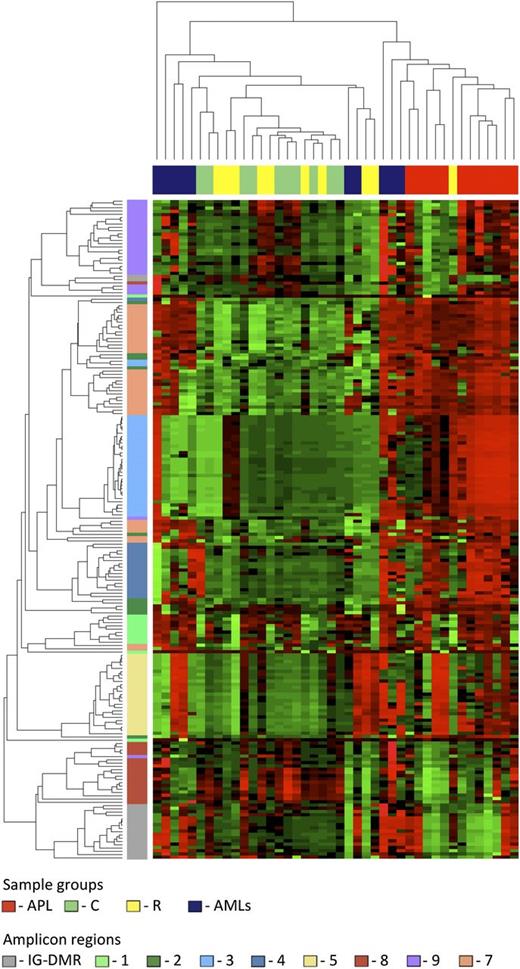
Data from the human samples were classified into 4 sample groups as described in supplemental Table 1. For each group, we determined the average methylation profile (Figure 1) and showed that APL was hypermethylated at the promoter (regions 2-3-4-5) and gene body (region 7) of MEG3 as compared with the remaining groups. The unsupervised hierarchical cluster analysis based on the methylation levels of the 202 human CpGs identified 2 clusters (Figure 2) and separated APL samples from controls. APL showed prominent hypermethylation, whereas remission samples, with the exception of 1 case only, segregated with controls in the second and largely hypomethylated cluster. Notably, CpGs belonging to the same amplicon clustered together, indicating that this domain is characterized by a well-defined site-specific CpG methylation patterning as expected for a region regulated by DNA methylation. Because statistical analysis confirmed that controls and remission samples shared a matching profile (supplemental Table 3), we next merged the data into 1 group. The pairwise Student t test performed against the APL group showed that 110 CpG sites, accounting for 54.5% of the total CpGs analyzed, were hypermethylated in APL (supplemental Table 4). Hypermethylation, encompassing both MEG3 promoter and gene body, included all 7 CTCF binding sites. Conversely, no evidence of statistically significant differences resulted for the CpGs embedded in the IG-DMR (supplemental Table 4).
Bar plots of the average methylation level for each CpG site per sample group. The average DNA methylation level determined for the APL, remission (R), control (C), and AML sample groups is represented by blue columns. A black horizontal line indicates the 50% level of methylation. Amplicon names are indicated underneath the bar plots. Sample groups are labeled on the left of each panel. CpG islands and CTCF binding sites are indicated with green and red bars, respectively.
Bar plots of the average methylation level for each CpG site per sample group. The average DNA methylation level determined for the APL, remission (R), control (C), and AML sample groups is represented by blue columns. A black horizontal line indicates the 50% level of methylation. Amplicon names are indicated underneath the bar plots. Sample groups are labeled on the left of each panel. CpG islands and CTCF binding sites are indicated with green and red bars, respectively.
Unsupervised hierarchical cluster analysis. The heat map represents the unsupervised hierarchical cluster analysis of the 4 sample groups based on the DNA methylation at the 202 CpG sites. Each row represents a CpG site, and each column a sample. The percentage of CpG methylation is depicted using color scales of red (CpG methylation >50%) and green (CpG methylation <50%). Sample group labels are also indicated at the top of the heat map.
Unsupervised hierarchical cluster analysis. The heat map represents the unsupervised hierarchical cluster analysis of the 4 sample groups based on the DNA methylation at the 202 CpG sites. Each row represents a CpG site, and each column a sample. The percentage of CpG methylation is depicted using color scales of red (CpG methylation >50%) and green (CpG methylation <50%). Sample group labels are also indicated at the top of the heat map.
To validate the reliability and reproducibility of the method used, we compared the methylation level of independently sequenced overlapping CpGs (supplemental Figure 2).
LOI in APL at human 14q32
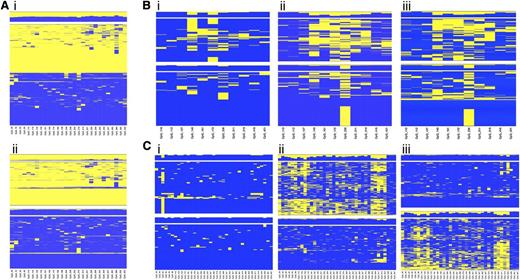
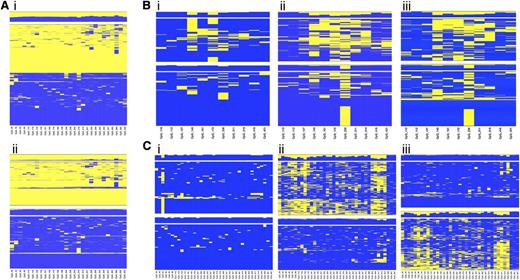
Because the regions selected for the study lie within an imprinted domain, differential methylation between alleles was expected at the CpG sites. Unsupervised hierarchical cluster analysis applied to single amplicon CpG methylation pattern identified regions displaying a clear partition into 2 classes of methylation profile, equally distributed among the reads and presumably representing the 2 alleles (Figure 3Ai). When heterozygous SNPs were observed, cluster analysis was applied to determine the allelic methylation pattern (Figure 3Aii).
Allele-specific DNA methylation profiling. Unsupervised cluster analysis was performed on the CpG methylation pattern obtained for each sample and amplicon. When a heterozygous SNP was observed, sequence reads were separated accordingly to the SNP genotype, and the CpG methylation pattern of each allele was analyzed by cluster analysis. (A) Differential methylation between alleles at region 9 in the healthy donor C55. (i) Overall cluster analysis identified 2 clusters according to the methylation pattern; (ii) DNA methylation pattern for each allele. (B) Allele-specific DNA methylation differences at region 2 between diagnosis (i) and complete remission (ii) stages of patient P9 with APL; (iii) allele-specific DNA methylation at region 2 in the healthy donor C55. (C) Allele-specific DNA methylation differences at region 7 between diagnosis (i) and complete remission (ii) stages of patient P31 with APL; (iii) allele-specific DNA methylation at region 7 in the healthy donor C52. Heat maps show clustering results. Each column represents a CpG site, and each row the methylation pattern of a single sequence read. The color indicates the methylation status of each CpG: blue, methylated; yellow, not methylated. The bar plot at the top of each heat map shows the overall methylation level of each CpG site.
Allele-specific DNA methylation profiling. Unsupervised cluster analysis was performed on the CpG methylation pattern obtained for each sample and amplicon. When a heterozygous SNP was observed, sequence reads were separated accordingly to the SNP genotype, and the CpG methylation pattern of each allele was analyzed by cluster analysis. (A) Differential methylation between alleles at region 9 in the healthy donor C55. (i) Overall cluster analysis identified 2 clusters according to the methylation pattern; (ii) DNA methylation pattern for each allele. (B) Allele-specific DNA methylation differences at region 2 between diagnosis (i) and complete remission (ii) stages of patient P9 with APL; (iii) allele-specific DNA methylation at region 2 in the healthy donor C55. (C) Allele-specific DNA methylation differences at region 7 between diagnosis (i) and complete remission (ii) stages of patient P31 with APL; (iii) allele-specific DNA methylation at region 7 in the healthy donor C52. Heat maps show clustering results. Each column represents a CpG site, and each row the methylation pattern of a single sequence read. The color indicates the methylation status of each CpG: blue, methylated; yellow, not methylated. The bar plot at the top of each heat map shows the overall methylation level of each CpG site.
Our interest was to characterize the APL-associated hypermethylation at the allelic level. We compared the allelic methylation profile of the 6 diagnostic/remission paired samples and demonstrated that APL is characterized by monoallelic hypermethylation at the MEG3-DMR (supplemental Table 5). Figure 3 shows the unsupervised cluster analysis of the allelic CpG patterning at regions 2 (Figure 3B) and 7 (Figure 3C) obtained for the diagnosis (i) and remission (ii) stages of patients P9 and P31 with APL. Notably, when the disease is established, the leukemic cells carry both alleles fully methylated. In contrast, at the remission stage 1 of the 2 alleles exhibits significantly lower methylation resulting in a profile that mirrors the healthy donor (iii). Taken together, these data show that LOI occurs at the MEG3-DMR in APL cells.
Correlation of DNA methylation with gene expression profiles
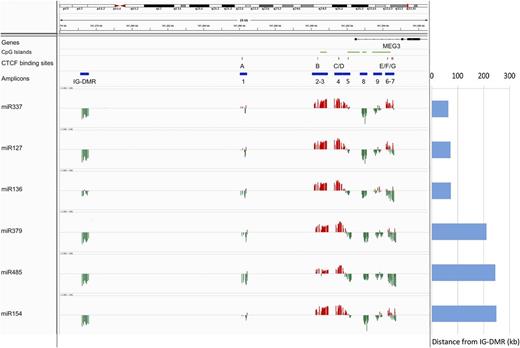
To investigate the epigenetic regulation of the 14q32 miRNAs, we quantified the expression of 6 miRNAs included in the cluster (miR-127, miR-136, miR-154, miR-337, miR-379, and miR-485) in a collection of 23 samples representative of the total cohort of specimens (see “Methods”) and correlated the miRNA expression profile with the DNA methylation data at both DMRs (Figure 4). The region showed a distinctive trend of correlation with a bivalent pattern at the MEG3-DMR that differentiates the promoter (regions 2-3-4-5) from the gene body (regions 7-8-9). We selected the CpGs (P < .05) whose methylation status was significantly negatively correlated with expression of the miRNAs (supplemental Table 6): these CpGs were included in the IG-DMR and in the gene body (region 8) and showed a good consistency across the miRNAs analyzed, with the exception of miR-136, which exhibited lower levels of correlation for these regions. Conversely, for the CpGs located in the promoter of MEG3 (regions 3 and 4), the correlation was consistently positive. In particular, all miRNAs were positively correlated with the methylation status of at least 1 CpG included or localized in the bordering area of a CTCF binding site (miR-485).
Correlation between DNA methylation levels and gene expression profiles. The expression of 6 miRNAs included in the 14q32 cluster (miR-127, miR-136, miR-154, miR-337, miR-379, and miR-485) was correlated with DNA methylation data at the DMRs. The position of the CpG island, the CTCF binding sites, and the amplicon is labeled with green, red, and blue horizontal bars, respectively. The correlation is represented with red and green vertical bars indicating positive and negative values, respectively. Each column indicates a CpG site. The distance of each gene from the IG-DMR is indicated on the right.
Correlation between DNA methylation levels and gene expression profiles. The expression of 6 miRNAs included in the 14q32 cluster (miR-127, miR-136, miR-154, miR-337, miR-379, and miR-485) was correlated with DNA methylation data at the DMRs. The position of the CpG island, the CTCF binding sites, and the amplicon is labeled with green, red, and blue horizontal bars, respectively. The correlation is represented with red and green vertical bars indicating positive and negative values, respectively. Each column indicates a CpG site. The distance of each gene from the IG-DMR is indicated on the right.
Hypermethylation at 14q32 in APL does not reflect a stage of myeloid cell differentiation
APL cells resemble normal promyelocytes, a stage of the myeloid differentiation pathway. It was therefore important to determine that hypermethylation at 14q32 was leukemia related. Accordingly, granulocyte colony-stimulating factor–mobilized PB cell samples from 4 healthy donors were flow sorted into the HSC, common myeloid progenitor, megakaryocyte-erythrocyte progenitor, and granulocyte-monocyte progenitor populations, and high-throughput bisulfite sequencing was used to determine the methylation profiles at 14q32. For this analysis, we generated amplicon libraries from the regions that displayed APL-associated hypermethylation (regions 2-3-4-5-7). The IG-DMR was also included to investigate for possible DNA methylation changes at the imprinting control region during myeloid differentiation. The analysis of variance test did not detect any significant difference across the cell types (supplemental Table 7), and the DNA methylation pattern obtained for each fraction was distinct from the prominently hypermethylated profile observed in the leukemic samples from patients with APL (supplemental Figure 4). These results indicated that the observed 14q32 epigenetic alterations are associated with APL pathogenesis and do not occur during normal myeloid differentiation.
The hypermethylation signature is conserved in murine PML-RARA transgenic APL cells
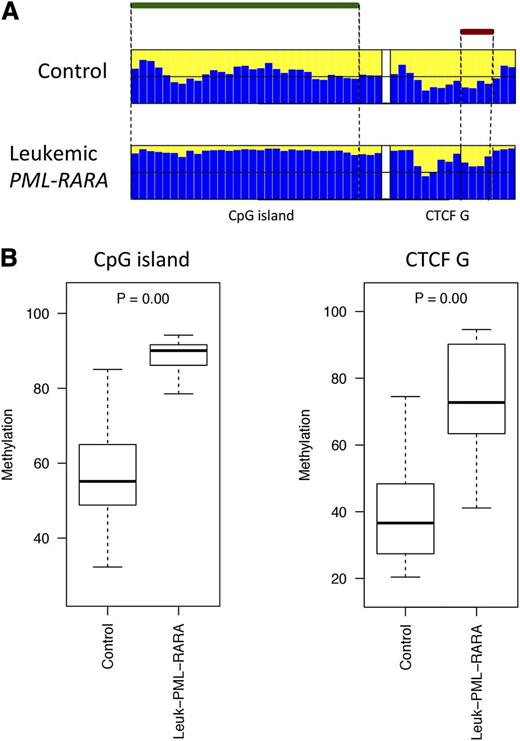
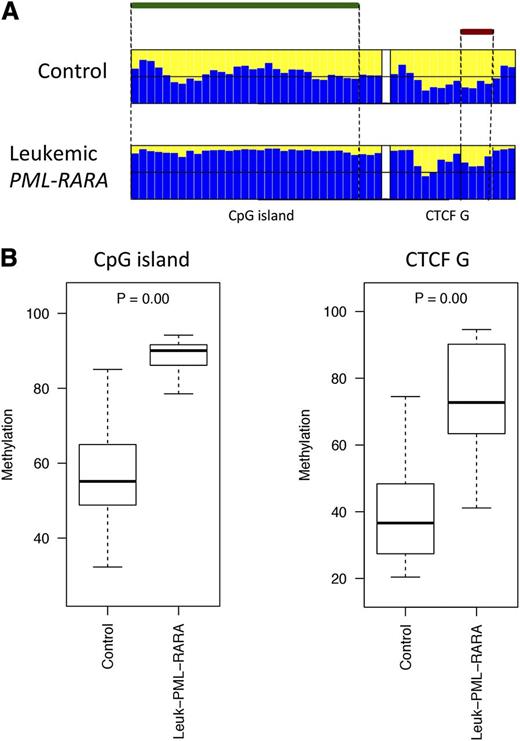
The DLK1-DIO3 domain is highly conserved in mammals and shares similar imprinting regulation of coding and noncoding genes.33 Therefore, we investigated whether the region is similarly deregulated in murine APL, utilizing the established hMRP8-PML-RARα transgenic model.3 Murine transgenic APL cells were collected from the BM of 3 leukemic mice and 4 controls (see “Methods”). High-throughput bisulfite sequencing was performed to determine the methylation profile of the CpG island and the CTCF binding site located upstream from the mouse GTL2 gene. Of the 7 samples, 5 were successfully sequenced (4 controls and 1 leukemic mouse). Leukemic APL cells exhibited hypermethylation at both the CpG island and the CTCF binding site as compared with the controls (Figure 5). These results validate the hypothesis that LOI at 14q32 is associated with the pathogenesis of PML-RARα–induced leukemia.
Comparison of the DNA methylation profiles in murine leukemic and nonleukemic control cells. (A) Bar plots of the average methylation level for each CpG site (blue columns). The leukemic murine cells exhibited a distinctive hypermethylation at both regions compared with the nonleukemic counterpart. A black horizontal line indicates the 50% level of methylation. Amplicon names are indicated underneath the bar plots. Samples types are labeled on the left of each panel. The CpG island and the CTCF binding site positions are indicated with green and red bars, respectively. (B) Box plots of the methylation-level distribution in the murine samples showing hypermethylation at the CpG island and CTCF G in the leukemic cells. The P values indicate Kruskal-Wallis test results between the APL leukemic cells and the controls.
Comparison of the DNA methylation profiles in murine leukemic and nonleukemic control cells. (A) Bar plots of the average methylation level for each CpG site (blue columns). The leukemic murine cells exhibited a distinctive hypermethylation at both regions compared with the nonleukemic counterpart. A black horizontal line indicates the 50% level of methylation. Amplicon names are indicated underneath the bar plots. Samples types are labeled on the left of each panel. The CpG island and the CTCF binding site positions are indicated with green and red bars, respectively. (B) Box plots of the methylation-level distribution in the murine samples showing hypermethylation at the CpG island and CTCF G in the leukemic cells. The P values indicate Kruskal-Wallis test results between the APL leukemic cells and the controls.
Discussion
The present study shows that a LOI occurs at the DLK1-DIO3 imprinted domain in APL cells in association with the overexpression of the downstream clustered miRNAs. Epigenetic changes occur commonly in cancer, and because they are reversible, their identification has had profound effects in the development of targeted therapies. DNA methylation inhibitors such as azacitidine and decitabine are currently included in clinical trials for the treatment of hematologic malignancies.37,38 Recently, a large-scale study demonstrated that DNA methylation patterns segregate AML subtypes according to their karyotype, suggesting that the specific fusion oncoproteins can drive epigenetic changes and contribute to the malignant transformation by the deregulation of sets of genes.39
The DLK1-DIO3 miRNAs are epigenetically regulated and silenced in most adult tissues but overexpressed in APL cells, as shown by ourselves and others,12,15,17 suggesting that they may contribute to APL development in cooperation with the PML-RARα protein. Here, we show that the MEG3-DMR that is involved in the imprinting regulation of the DLK1-DIO3 domain27 is hypermethylated in APL. The MEG3-DMR hypermethylation was strictly disease-associated, among the cases analyzed, which included AMLs with NK, t(8;21), and inv(16), being detected only in the APL cases and not present in remission BM or normal controls. Furthermore, myeloid progenitor cells showed a distinctive hypomethylated profile in this region indicating that the observed epigenetic changes did not reflect a stage of cell differentiation. Finally, the leukemic BM cells collected from the murine APL model showed marked hypermethylation at the orthologous region on chromosome 12, also including the unique CTCF binding site located upstream from the mouse miRNA cluster. Taken together, these data demonstrate that APL is characterized by hypermethylation at the 14q32 domain.
We also showed that the DNA methylation profile at the 2 DMRs correlated with expression of the downstream miRNAs. This result is consistent with the hypothesis that the expression of the sncRNAs clustered in the 14q32 domain is under the control of the IG-DMR and MEG3-DMR because they are organized in repeated arrays and they might be processed from a long transcript starting from the promoter of MEG3,13 although the mechanisms have not yet been elucidated. In our experiments, the miRNAs tested were negatively correlated with the IG-DMR, whereas the MEG3-DMR displayed a bivalent pattern: methylation at the promoter of MEG3 positively correlated with expression of the miRNAs, whereas methylation at the MEG3 gene body showed a less consistent and predominantly negative correlation. This atypical patterning (hypermethylation associated with higher expression) was attributable to the presence of the binding sites for the insulator CTCF. Indeed, we showed that the miRNAs tested were positively correlated with the methylation of at least 1 CpG included in a CTCF binding site. Furthermore, this result indicates that CTCF binding sites display different properties depending on the position. In our case, the CTCF B-C (supplemental Table 2) showed a consistent positive correlation among the miRNAs tested, whereas CTCF A-E-G were not correlated, with the exception of CTCF G, which exhibited a moderate positive correlation with the expression of miR-337. Conversely, CTCF F was negatively correlated with miR-485-3p only.
Interestingly, we did not detect APL-associated alterations of the methylation profile at the IG-DMR. We therefore concluded that the epigenetic changes observed would affect only the genes directly regulated by the secondary and postfertilization MEG3-DMR and in particular the downstream miRNAs. Indeed, the 14q32 miRNAs are highly expressed in the developing embryo and transcribed only from the maternal allele, whereas they show a very limited expression in adult tissues, mainly restricted to the brain.13 Based on the evidence that the miRNAs are paternally silenced because of the imprint mark at both DMRs,26 we hypothesized that the tissue-specific regulation of the maternal allele was determined by the methylation of the CTCF binding sites and the resulting activity of the CTCF protein. Hence, in the tissues where the miRNAs are not typically expressed, as in the adult myeloid progenitor cells, the maternal allele would exhibit a lower methylation in order to enable the CTCF protein to bind the specific sites and prevent their expression. In contrast, in APL a loss of the canonical imprint signature could occur with abnormal methylation of the MEG3-DMR and the CTCF binding sites, leading to aberrant expression of the miRNAs in the BM.
Taking advantage of the long sequence reads, we determined the allelic methylation profile of the amplicons with heterozygous SNPs and showed that the DNA methylation was differentially distributed between the 2 alleles and that each region was characterized by a specific allelic status. Notably, the extent of hypermethylation detected in APL samples by allele-specific analysis was much higher compared with the overall analysis. For instance, in patient P31, 64.9% of the CpGs residing in region 7 were hypermethylated at diagnosis on the allele carrying the SNP G, whereas the allele with the SNP C remained unchanged (supplemental Table 5). The same analysis performed on the overall methylation profile detected only 27.0% of hypermethylated CpGs. Comparing the allelic profile of diagnostic/remission sample pairs, we detected monoallelic hypermethylation including the CTCF binding sites. This result is consistent with the mechanism of action of CTCF, an enhancer blocking protein that binds to the unmethylated DNA in an allele-specific manner and contributes to imprinting regulation by the formation of chromatin boundaries on the unmethylated allele.40 We propose LOI associated with APL, with gain of methylation at the CTCF binding sites included in the MEG3-DMR and activation of the transcription of typically silent miRNAs, through the abrogation of CTCF insulating activity. Because the LOI did not involve the IG-DMR, we concluded that the paternal miRNA silencing was maintained. LOI attributable to epigenetic disruption has been extensively documented in cancer,41,42 and one of the best characterized examples of this is the LOI occurring at the IGF2-H19 domain and associated with different types of tumors.43,44 The DLK1-DIO3 domain resembles the structure and imprinting regulation of the IGF2-H19 domain, and studies have demonstrated that LOI of IGF2 and H19 in cancer is accompanied by altered methylation at the CTCF binding sites, leading to gene overexpression.45,46
This study provides novel insights into the epigenetic characterization of APL. The oncogenic protein PML-RARα was shown to recruit chromatin modifiers5,8,9,47 promoting profound alterations of the epigenetic marks.48,49 A search of the University of California, Santa Cruz genome browser did not detect PML-RARα binding sites in the region analyzed among the nearly 3000 sequences recently mapped in the human genome.48 In order to investigate this issue further, we determined the DNA methylation pattern at 14q32 in U937 cell lines expressing PML-RARα.50 However, aberrant hypermethylation of the IG-DMR and MEG3-DMR was observed (supplemental Figure 5), and hence the analysis of PML-RARα effects on DNA methylation in this region was not possible. Interestingly, Schoofs et al have recently reported that DNA methylation changes in APL characterize the overt stage of the disease and are not directly initiated by PML-RARα binding,49 and studies by Valleron et al did not demonstrate a direct relationship between PML-RARα and the deregulation of the 14q32 small nucleolar RNAs.16 Taken together, these data suggest a complex association between PML-RARα expression and hypermethylation at 14q32 in APL. Further studies are required to investigate the contribution of the LOI at 14q32 to the APL pathogenesis and the role of the 14q32 miRNAs.
The online version of this article contains a data supplement.
The publication costs of this article were defrayed in part by page charge payment. Therefore, and solely to indicate this fact, this article is hereby marked “advertisement” in accordance with 18 USC section 1734.
Acknowledgments
The authors thank Professor Andrew Lister for excellent clinical support, Dr Debra Lillington for valuable cytogenetic analysis, Professor Scott Kogan for provision of the MRP8-PML-RARA transgenic APL blasts, and Professor Pier Giuseppe Pelicci for provision of the inducible U937 cell lines.
This work was supported by a project grant from Cancer Research United Kingdom (C6277/A6789) (B.D.Y. and S.D.) and a Specialist program award from Leukaemia & Lymphoma Research (10023) (D.G. and E.M.).
Authorship
Contribution: F.M., B.D.Y., and S.D. designed the research and analyzed data; F.M., T.C., F.M.-M., E.M., and J.V.J. performed the experiments; J.M. performed bioinformatics analysis, analyzed data, and made the figures; J.W. assisted with bioinformatics analysis; S.I. collected patient samples and performed DNA extraction; D.G. and D.T. contributed to research design; J.M., D.G., J.G.G., B.D.Y., and S.D. critically reviewed the manuscript; and F.M. wrote the manuscript.
Conflict-of-interest disclosure: The authors declare no competing financial interests.
Correspondence: Floriana Manodoro, Centre for Haemato-Oncology, Barts Cancer Institute, Queen Mary University of London, John Vane Science Centre, Charterhouse Square, London EC1M 6BQ, United Kingdom; e-mail: floriana_manodoro@yahoo.it; and Silvana Debernardi, Centre for Haemato-Oncology, Barts Cancer Institute, Queen Mary University of London, John Vane Science Centre, Charterhouse Square, London EC1M 6BQ, United Kingdom; e-mail: si.debernardi@gmail.com.


