Key Points
HOXA9 nucleates a chromatin complex with nuclear matrix protein-SAFB.
H9SB complex maintains leukemia via active repression of myeloid differentiation genes.
Visual Abstract
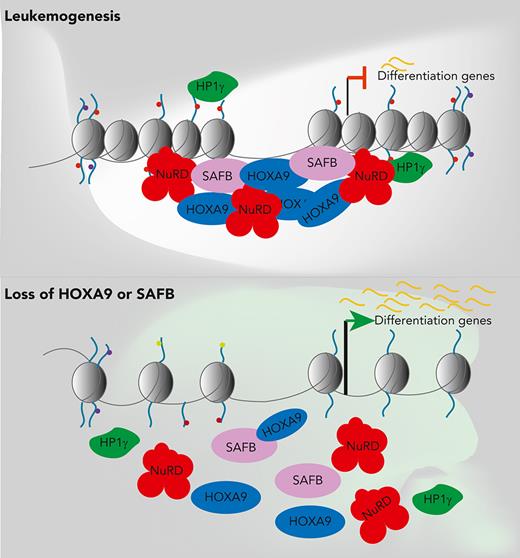
Supplementary figure 17: Schematic Model summarising our findings. HOXA9 nucleates a repressive complex with SAFB, which is required for the maintenance of the leukaemia state predominantly through the active repression of myeloid differentiation.
Supplementary figure 17: Schematic Model summarising our findings. HOXA9 nucleates a repressive complex with SAFB, which is required for the maintenance of the leukaemia state predominantly through the active repression of myeloid differentiation.
Abstract
HOXA9 is commonly upregulated in acute myeloid leukemia (AML), in which it confers a poor prognosis. Characterizing the protein interactome of endogenous HOXA9 in human AML, we identified a chromatin complex of HOXA9 with the nuclear matrix attachment protein SAFB. SAFB perturbation phenocopied HOXA9 knockout to decrease AML proliferation, increase differentiation and apoptosis in vitro, and prolong survival in vivo. Integrated genomic, transcriptomic, and proteomic analyses further demonstrated that the HOXA9-SAFB (H9SB)–chromatin complex associates with nucleosome remodeling and histone deacetylase (NuRD) and HP1γ to repress the expression of factors associated with differentiation and apoptosis, including NOTCH1, CEBPδ, S100A8, and CDKN1A. Chemical or genetic perturbation of NuRD and HP1γ–associated catalytic activity also triggered differentiation, apoptosis, and the induction of these tumor-suppressive genes. Importantly, this mechanism is operative in other HOXA9-dependent AML genotypes. This mechanistic insight demonstrates the active HOXA9-dependent differentiation block as a potent mechanism of disease maintenance in AML that may be amenable to therapeutic intervention by targeting the H9SB interface and/or NuRD and HP1γ activity.
Introduction
Acute myeloid leukemia (AML) is an aggressive blood cancer characterized by the increased proliferation and self-renewal of immature cells of the myeloid series and a failure of differentiation within this compartment.1 A cardinal feature of AML is aberrant transcription and mutations that alter transcription factors; epigenetic regulators and genome structural proteins are frequent and recurrent.2 A common mediator of transformation, downstream to many of these mutations, and overexpressed in ∼70% of cases of AML, is the clustered homeobox transcription factor HOXA9.3-5 Overexpression of HOXA9 also indicates a high-risk AML subgroup, with high expression levels associated with poor prognosis.6,7
However, the mechanisms whereby HOXA9 mediates transformation in the hematopoietic stem and progenitor cell compartment remain relatively poorly understood. Previous studies have established its role as a transcriptional activator when associated with TALE homeobox proteins MEIS1 and PBX1/3.8,9 More recent studies have shown this complex to drive the proliferation and survival of leukemic cells via its interaction with multiple signaling pathways10-13 and via the stimulation of enhancer activation/modifications.14,15 Interestingly, HOXA9 has been described to also have repressive function.16-18 However, the contribution of HOXA9-mediated repression to AML induction and maintenance remains unknown. Historically, studies of HOXA9 function have been somewhat hampered by the lack of reliable tools, with the majority of genomic and proteomic studies based on the exogenous overexpression of tagged versions of HOXA9. In this study, we make use of a commercial HOXA9 antibody validated in chromatin immunoprecipitation sequencing (ChIP-seq),10 and for the first time to our knowledge, we describe the protein interactome of endogenous HOXA9 in human AML cells. Then, we use these data to identify a novel HOXA9-repressive complex and characterize its functional and mechanistic role in AML maintenance.
Methods
Cell lines
MOLM13, MV411, and HL60 cells were cultured in RPMI 1640 medium containing 10% fetal bovine serum, 1% l-glutamine, and 1% penicillin-streptomycin. OCIAML3 cells were cultured in minimum essential medium α containing 20% fetal bovine serum, 1% l-glutamine, and 1% penicillin-streptomycin.
For treatment with inhibitors, panobinostat-LBH589 and chaetocin cells were seeded in a 6-well plate at a density of 5 × 10⁵/mL in 3 mL media. Inhibitors were diluted to a working stock of 10 mM with dimethyl sulfoxide and were used at a final concentration of 4 nM panobinostat and 40 nM chaetocin. The cells were harvested for assays at specific time points.
RIME
Rapid immunoprecipitation mass spectrometry of endogenous proteins (RIME) was performed as described earlier.19
PLA by Duolink
The proximity ligation assay (PLA) was performed using Duolink In Situ Red Starter Kit Mouse/Rabbit (Sigma-Aldrich), following the manufacturer’s instructions.
CUT&RUN
CUT&RUN was performed using the CUTANA CUT&RUN kit (EpiCypher), following the manufacturer’s instructions.
Lentiviral production
Lentiviral particles were produced in 293T cell lines with cotransfecting packaging plasmids (pMDG2 and psPAX2) with pkLV2 (as described earlier)20 or pLKO-Tet-on vectors.
Detailed methods are provided in supplemental Methods, available on the Blood website.
Results
A proteomic screen identified HOXA9 to interact with matrix (S/MAR)–binding proteins
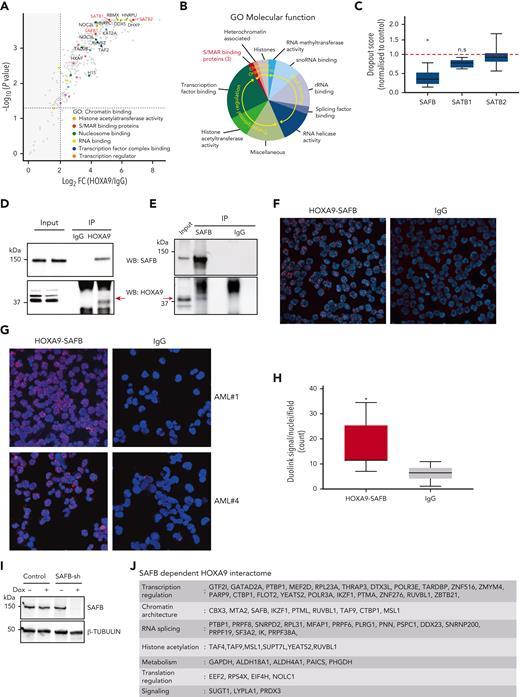
To define the HOXA9-interacting proteome in acute leukemia, we performed a proteomic screening in the HOXA9-dependent MLL-AF9–rearranged MOLM13 AML cell line.21 Both replicates gave a high degree of concordance (supplemental Figure 1A). There were 324 proteins significantly enriched in HOXA9-immunoprecipitates compared with immunoglobulin G (IgG) immunoprecipitates (>2 log fold change) (Figure 1A; supplemental Figure 1B; supplemental Table 1). Consistent with its transcriptional role, interacting proteins included factors involved in transcription initiation, messenger RNA (mRNA) processing, basal transcription, acetyl-group transferring, and lineage-specific transcription such as CEBPα (Figure 1B). Interestingly, the scaffold/matrix attachment region (S/MAR) proteins SATB1, SATB2, and SAFB were also greatly enriched. However, although SATB1 has been described to be rearranged in AML22 and appears to regulate the tumor suppressor function of PU.1 in AML,23 and the repressive function of SATB2 is required to block B-cell differentiation in BCR-ABL-positive B-cell acute lymphoblastic leukemia,24 there are no previous reports on the role of SAFB in leukemia. To gain additional insights into the role of these S/MAR proteins in leukemia, we analyzed previously published CRISPR-dropout data from 2 independent screens of AML cell lines.20,25 These demonstrated that the depletion of SAFB significantly inhibited the growth of all tested AML cell lines, whereas the depletion of SATB1 and SATB2 did not (Figure 1C; supplemental Figure 1C), thus suggesting a novel, essential function of SAFB for the growth of AML cells.
HOXA9 interacts with matrix binding (S/MAR) protein SAFB. (A) Volcano plot displaying the label-free mass spectrometry (MS) quantification of HOXA9 pulldown in MOLM13 cells. The plot shows log2 ratios of averaged peptide MS intensities between HOXA9-immunoprecipitation (IP) and control-IP (IgG) eluate samples (x-axis) plotted against the negative log10 P values (y-axis) calculated across the replicate data sets (1-tailed Student t test, n = 2 replicates). Maximum upper values were set for the x- and y-axis to accommodate all detected proteins in the plot. A dashed horizontal line marks P = .05. Vertical dashed line marks enrichment >2 log2 fold. Chromatin-binding proteins, pulled down by HOXA9 are colored as indicated, and selected protein names are shown. The full data set is given in supplemental Table 1. (B) Summary of proteins pulled down by HOXA9-IP, categorized based on the information of the molecular functions obtained from GO analyses; false discovery rate < 0.000001. (C) Box plot represents depletion of SAFB, SATB1, and SATB2 by CRISPR in 5 AML cell lines. Dropout score was calculated by normalizing to control cells (non-AML).20 (D) Western blot analyses validating the HOXA9 and SAFB interaction in MOLM13 cells via coimmunoprecipitation. HOXA9 is immunoprecipitated from MOLM13 cells and blotted for SAFB (top) and HOXA9 (bottom). (E) As in panel D, SAFB is immunoprecipitated from MOLM13 cells and blotted for HOXA9 (bottom) and SAFB (top). (F) Images showing PLA using Duolink in MOLM13 cells confirming the interaction between HOXA9 and SAFB in situ. Antibodies against HOXA9 (rabbit polyclonal antibodies) and SAFB (mouse monoclonal antibodies) were used. Rabbit and mouse IgGs were used as negative controls. (G) Images show PLA, using Duolink in primary AML cells from 2 individual patient samples. (H) Box and whisker plot shows cumulative differential signal (analyzed by Arivis software) as the number of Duolink-positive dots per nuclei across multiple patients (n = 7). Dots observed in IgG were also counted and plotted as a negative control. Statistical significance was calculated against IgG control using the paired t test (2-tailed, P < .05), ∗P < .05. (I) Representative western blot showing SAFB knockdown via doxycycline-inducible shRNAs in MOLM13 cells at 48 hours postinduction. β-Tubulin was used as a loading control. (J) Summary table of SAFB-dependent HOXA9 interacting proteins (n = 60); false discovery rate < 0.05. Full details are provided in supplemental Table 1. log2 FC, log2 fold change; ns., not significant; rRNA, ribosomal RNA; snoRNA, small nucleolar RNA.
HOXA9 interacts with matrix binding (S/MAR) protein SAFB. (A) Volcano plot displaying the label-free mass spectrometry (MS) quantification of HOXA9 pulldown in MOLM13 cells. The plot shows log2 ratios of averaged peptide MS intensities between HOXA9-immunoprecipitation (IP) and control-IP (IgG) eluate samples (x-axis) plotted against the negative log10 P values (y-axis) calculated across the replicate data sets (1-tailed Student t test, n = 2 replicates). Maximum upper values were set for the x- and y-axis to accommodate all detected proteins in the plot. A dashed horizontal line marks P = .05. Vertical dashed line marks enrichment >2 log2 fold. Chromatin-binding proteins, pulled down by HOXA9 are colored as indicated, and selected protein names are shown. The full data set is given in supplemental Table 1. (B) Summary of proteins pulled down by HOXA9-IP, categorized based on the information of the molecular functions obtained from GO analyses; false discovery rate < 0.000001. (C) Box plot represents depletion of SAFB, SATB1, and SATB2 by CRISPR in 5 AML cell lines. Dropout score was calculated by normalizing to control cells (non-AML).20 (D) Western blot analyses validating the HOXA9 and SAFB interaction in MOLM13 cells via coimmunoprecipitation. HOXA9 is immunoprecipitated from MOLM13 cells and blotted for SAFB (top) and HOXA9 (bottom). (E) As in panel D, SAFB is immunoprecipitated from MOLM13 cells and blotted for HOXA9 (bottom) and SAFB (top). (F) Images showing PLA using Duolink in MOLM13 cells confirming the interaction between HOXA9 and SAFB in situ. Antibodies against HOXA9 (rabbit polyclonal antibodies) and SAFB (mouse monoclonal antibodies) were used. Rabbit and mouse IgGs were used as negative controls. (G) Images show PLA, using Duolink in primary AML cells from 2 individual patient samples. (H) Box and whisker plot shows cumulative differential signal (analyzed by Arivis software) as the number of Duolink-positive dots per nuclei across multiple patients (n = 7). Dots observed in IgG were also counted and plotted as a negative control. Statistical significance was calculated against IgG control using the paired t test (2-tailed, P < .05), ∗P < .05. (I) Representative western blot showing SAFB knockdown via doxycycline-inducible shRNAs in MOLM13 cells at 48 hours postinduction. β-Tubulin was used as a loading control. (J) Summary table of SAFB-dependent HOXA9 interacting proteins (n = 60); false discovery rate < 0.05. Full details are provided in supplemental Table 1. log2 FC, log2 fold change; ns., not significant; rRNA, ribosomal RNA; snoRNA, small nucleolar RNA.
We first confirmed the interaction of SAFB with HOXA9 in MOLM13 cells via coimmunoprecipitation (Figure 1D-E). We also validated the interaction between HOXA9 and SAFB in situ in MOLM13 cells using the PLA by Duolink (Figure 1F), further corroborating this protein interaction in situ in primary cells obtained from patients with AML (n = 7) (Figure 1G; supplemental Figure 2). Assessing the cumulative differential signal across multiple patients with AML demonstrated a significant positive interaction between HOXA9 and SAFB signal compared with IgG controls and SAFB (Figure 1H). After confirming the protein-protein interaction between HOXA9 and SAFB in MOLM13 and primary AML cells, we wanted to determine whether SAFB is required for the identified HOXA9 chromatin interactions to take place. RIME19 for HOXA9 in MOLM13 cells (n = 2) after SAFB knockdown revealed 60 specific proteins that were lost or reduced in the absence of SAFB (Figure 1J; supplemental Table 1). Notably, proteins involved in chromatin architecture and gene repression were prominent within this SAFB-dependent subset (supplemental Figure 1D).
SAFB phenocopies HOXA9 to drive proliferation and prevent differentiation and apoptosis in leukemic cells
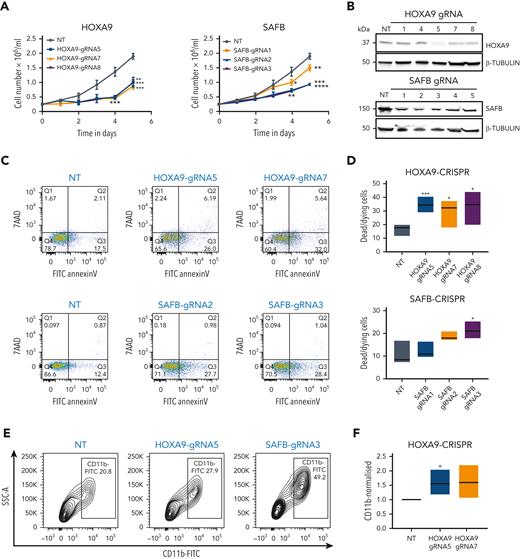
To specifically dissect the role of SAFB in HOXA9-dependent AML, we used CRISPR-Cas9 to individually target SAFB and HOXA9 expression in MOLM13 cells.21HOXA9 or SAFB depletion led to reduced cell growth compared with control cells in all 3 tested guide RNAs (Figure 2A-B). An increase in myeloid differentiation and apoptosis upon the depletion of HOXA9 or SAFB suggested a fully phenocopied effect and a mechanistic interaction between the associating proteins (Figure 2C-F).
To further test the functional interaction, we targeted SAFB expression using CRISPR-Cas9 in 2 additional HOXA9-dependent AML cell lines (MV411–MLL-AF4 rearranged and OCIAML3–NPM1 mutated) as well as a HOXA9-independent AML cell line (HL60) (Figure 2G). Similar to the MLL-AF9 plus MOLM13 cell line, we could demonstrate that the depletion of SAFB induced differentiation of HOXA9-dependent cell lines (MV411 and OCIAML3) but had no impact on HL60 cells (Figure 2H). The induction of apoptosis was also observed in MV411, whereas no apoptosis was observed in OCIAML3 or HL60 cells (Figure 2I). SAFB mRNA levels were remarkably homogeneous across multiple AML samples/subtypes, whereas HOXA9 levels were more heterogenous across AML, as assessed using whole transcriptome data from 179 primary AMLs (The Cancer Genome Atlas Research Network) (Figure 2J).
To further identify the codependent relationship between HOXA9 and SAFB, we analyzed the available DepMap data set after their CRISPR perturbation in 26 AML cell lines. These data demonstrated that perturbation of both SAFB and HOXA9 affects the growth of AML cells with a linear relationship between the effects of either (P = .0016, Pearson coefficient = 0.6) (Figure 2K).
HOXA9 and SAFB drive leukemic growth in vivo
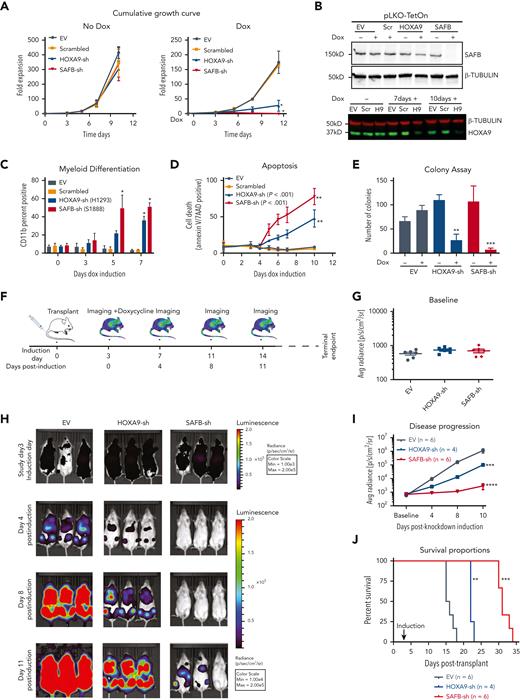
To determine whether SAFB and HOXA9 are required for leukemia maintenance in vivo, we used the temporal control of a doxycycline-inducible short hairpin RNA (shRNA) system (pLKO) to induce knockdown after disease establishment had been demonstrated. First, an in vitro validation showed SAFB and HOXA9 knockdown using the shRNA (Figure 3B) phenocopied CRISPR–editing to substantially reduce the growth of MOLM13 cells (Figure 3A), the proportion of cells in the S-phase (supplemental Figure 3A), and induce myeloid differentiation followed by apoptosis and a reduced methylcellulose colony formation (Figure 3C-E; supplemental Figure 3B). Notably, HOXA9-shRNA demonstrated knockdown only after 3 to 4 days compared with SAFB-shRNA, which had a significant SAFB knockdown within 48 hours (Figure 3B; supplemental Figure 3C), likely explaining the delayed and less dramatic phenotypes observed in the HOXA9-knockdown cells compared with the SAFB-knockdown cells. Next, we injected NSG mice with MOLM13-sh cells, which expressed a luciferase reporter-gene in addition to an inducible shRNA vector to knockdown either SAFB or HOXA9 expression (experimental scheme Figure 3F). Three days after injection, engraftment and disease induction were confirmed using bioluminescence imaging, and the baseline was calculated for all the 3 cohorts of mice (Figure 3G). In accordance with our in vitro experiments, the knock down of HOXA9 and SAFB significantly delayed disease progression and prolonged the survival of mice compared with the effect of the control cells (Figure 3H-J). Together, these data confirm a functional as well as a physical interplay between the 2 proteins, with SAFB phenocopying the HOXA9 function to support leukemic growth and prevent differentiation of leukemic cells both in vitro and in vivo.
HOXA9 and SAFB drive leukemic growth in vivo. (A) Cumulative growth of MOLM13 cells, lentivirally expressing shRNA against HOXA9 (blue), SAFB (red), scrambled sequence (orange), and empty vector (EV, gray). The data shown are the averages of biological replicates (n = 3) ± SD. Two-way ANOVA test, ∗P < .01 (B) Western blot analyses showing the knockdown efficiency of SAFB shRNAs after 48 hours after induction with doxycycline (Dox) in MOLM13 cells (top). β-Tubulin was used as a loading control. The HOXA9 knockdown after 7 and 10 days of doxycycline induction in MOLM13 cells is shown (bottom). (C) Myeloid differentiation accessed by CD11b surface expression via flow cytometry 5 days after induction with doxycycline. Data shown are the averages of biological replicates (n = 4) ± SD. Statistical significance calculated using the 2-way ANOVA test, ∗P < .01. (D) Percentage of annexin V– and 7AAD-positive MOLM13 cells 5 days after doxycycline treatment (1.5 μg/mL). Mean ± SD, n = 4. Two-way ANOVA test, ∗∗P < .001. (E) Colony-forming assay of MOLM13 cells expressing HOXA9- or SAFB-shRNA in the presence or absence of doxycycline (1.5 μg/mL). The bar graph shows the average value of 3 independent experiments ± SD, 2-way ANOVA test ∗∗P < .001, ∗∗∗P = .0001. (F) Schematic of xenotransplant experimental design. (G) Bioluminescent radiance 3 days after injection and before shRNA induction (baseline) in all 3 cohorts in all animals. (H) Serial bioluminescence imaging of mice that underwent transplantation with luciferase-labeled shRNA-expressing MOLM13 cells at indicated time points. (I) Bioluminescence at indicated time points shows disease progression over time. Statistical significance was calculated using the 2-way ANOVA with multiple comparisons (95% CI) against shEV, (shEV-HOXA9-sh at day 11, ∗∗∗P = .0004; shEV-SAFB-sh at day 11, ∗∗∗∗P < .0001). (J) Kaplan-Meier plot showing the survival of mice that received transplantations with MOLM13 cells expressing indicated shRNA. A log rank test was performed (∗∗P < .01, ∗∗∗P < .001). H9, HOXA9sh; Max, maximum; Min, minimum; Scr, scrambled.
HOXA9 and SAFB drive leukemic growth in vivo. (A) Cumulative growth of MOLM13 cells, lentivirally expressing shRNA against HOXA9 (blue), SAFB (red), scrambled sequence (orange), and empty vector (EV, gray). The data shown are the averages of biological replicates (n = 3) ± SD. Two-way ANOVA test, ∗P < .01 (B) Western blot analyses showing the knockdown efficiency of SAFB shRNAs after 48 hours after induction with doxycycline (Dox) in MOLM13 cells (top). β-Tubulin was used as a loading control. The HOXA9 knockdown after 7 and 10 days of doxycycline induction in MOLM13 cells is shown (bottom). (C) Myeloid differentiation accessed by CD11b surface expression via flow cytometry 5 days after induction with doxycycline. Data shown are the averages of biological replicates (n = 4) ± SD. Statistical significance calculated using the 2-way ANOVA test, ∗P < .01. (D) Percentage of annexin V– and 7AAD-positive MOLM13 cells 5 days after doxycycline treatment (1.5 μg/mL). Mean ± SD, n = 4. Two-way ANOVA test, ∗∗P < .001. (E) Colony-forming assay of MOLM13 cells expressing HOXA9- or SAFB-shRNA in the presence or absence of doxycycline (1.5 μg/mL). The bar graph shows the average value of 3 independent experiments ± SD, 2-way ANOVA test ∗∗P < .001, ∗∗∗P = .0001. (F) Schematic of xenotransplant experimental design. (G) Bioluminescent radiance 3 days after injection and before shRNA induction (baseline) in all 3 cohorts in all animals. (H) Serial bioluminescence imaging of mice that underwent transplantation with luciferase-labeled shRNA-expressing MOLM13 cells at indicated time points. (I) Bioluminescence at indicated time points shows disease progression over time. Statistical significance was calculated using the 2-way ANOVA with multiple comparisons (95% CI) against shEV, (shEV-HOXA9-sh at day 11, ∗∗∗P = .0004; shEV-SAFB-sh at day 11, ∗∗∗∗P < .0001). (J) Kaplan-Meier plot showing the survival of mice that received transplantations with MOLM13 cells expressing indicated shRNA. A log rank test was performed (∗∗P < .01, ∗∗∗P < .001). H9, HOXA9sh; Max, maximum; Min, minimum; Scr, scrambled.
SAFB colocalizes with HOXA9 genome wide
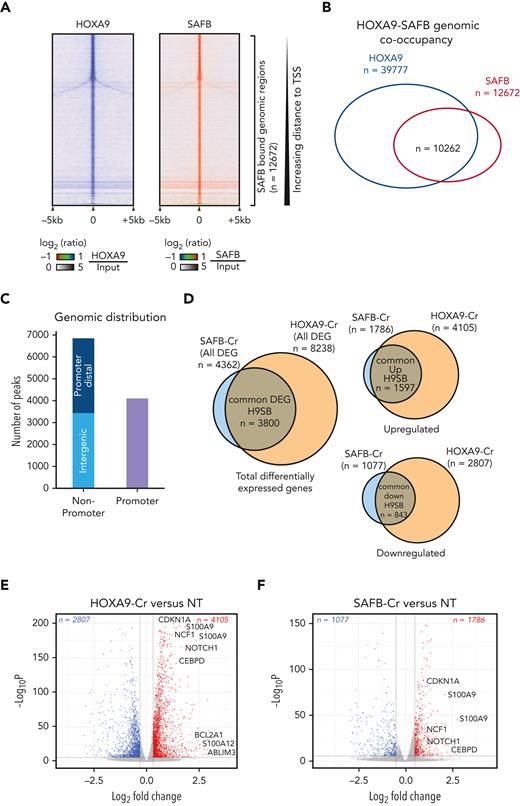
Next, we probed the function of the putative HOXA9/SAFB (H9SB) complex. To detail the H9SB localization on chromatin, we performed CUT&RUN26 for HOXA9 or SAFB in MOLM13 cells. The HOXA9 antibody used here has been previously shown to enrich endogenous HOXA9 in ChIP-seq experiments,10 and both HOXA9 and SAFB antibodies gave consistent results and compared favorably with ChIP-seq (supplemental Figure 4A,C). We identified high-confidence binding sites for HOXA9 (n = 39 777) and SAFB (n = 12 672) in MOLM13 cells (supplemental Figure 4B), and among those, a subset of HOXA9 peaks specifically colocalized with the majority of SAFB peaks (n = 10 262) (Figure 4A-B; supplemental Figure 4D; supplemental Table 2). One-third of H9SB cobound peaks were found at promoters, (n = 3845) with the remainder being distal peaks (n = 6417). Motif analyses of H9SB co-occupied loci showed strong enrichment for hematopoietic transcription factor binding sites, including PU.1 (ETS), RUNX1, and CEBPA (supplemental Figure 4E).
As expected, by their SAFB binding, these cobound loci demonstrated characteristic sequence features of S/MAR regions, such as AT-proportion, topoisomerase II binding, and kinked or curved DNA,27,28 with cobinding demonstrated at or near the classic S/MAR regions of the MYC,29TOPI, TOP2A,30 and β-GLOBIN31 genes (supplemental Figure 5A-B).
The transcriptional consequence of H9SB depletion in leukemic cells
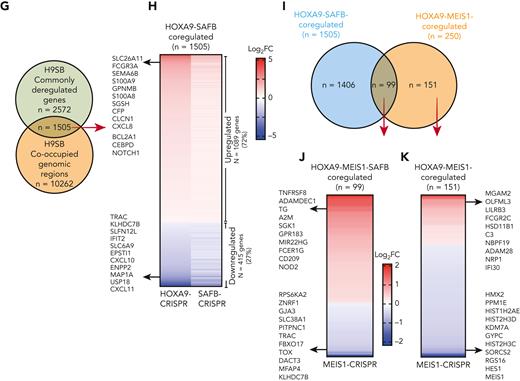
Transcriptional profiling of HOXA9- and SAFB-depleted MOLM13 leukemic cells using RNA sequencing and differential gene expression analyses demonstrated 8238 and 4362 altered genes in HOXA9-depleted cells and SAFB-depleted cells, respectively (P < .01) (Figure 4D). The majority of genes affected by SAFB depletion (n = 3800, 87%) were also coordinately altered because of HOXA9 depletion (Figure 4D). Furthermore, gene set enrichment analyses of differentially regulated genes after either HOXA9 or SAFB depletion enriched for a HOXA9 signature (supplemental Figure 6A). Within the overlapping genes, differential expression was observed in both directions (threshold set to 1 ± 0.2 to measure any significant change in the expression; overlap among upregulated or downregulated genes, n = 89% or n = 78%, respectively; P < .01) (Figure 4E-F; supplemental Table 3).
To identify direct targets of HOXA9 and SAFB, we integrated H9SB CUT&RUN sequencing data with RNA sequencing after H9SB perturbation. Interestingly, 58% of the commonly dysregulated genes (n = 1505/2572), perturbed by the loss of both HOXA9 and SAFB, demonstrated an H9SB binding peak within 50 kilobases of their transcription start site (TSS) (Figure 4G; supplemental Table 4). The majority of these genes (72%) were upregulated after H9SB perturbation, keeping with our developing hypothesis of the repressive role of the putative H9SB complex (Figure 4H). Gene ontology (GO) analyses revealed genes associated with myeloid differentiation to be significantly enriched in this upregulated gene set (including S100A8, S100A9, NOTCH1, CEBPδ, CDKN1A, BCL2A1, S100A12, and SERPINA1), whereas downregulated genes were enriched in interferon response pathways (supplemental Figure 6B-C).
We further sought to reconcile any relationship of the H9SB complex with MEIS1 by assessing whether HOXA9 simultaneously binds to MEIS1 and SAFB or whether the binding is mutually exclusive. We compared the H9SB targets (n = 1505) with HOXA9-MEIS1 targets (n = 250, identified in MOLM13 cells) by integrating differential gene expression data from MEIS1 perturbation and genomic binding, shown in supplemental Figure 7. Interestingly, only 6% of H9SB target genes are shared by MEIS1 in these cells (99/1505) (Figure 4I). Moreover, the correlation with the expression data about MEIS1-perturbation suggests that the HOXA9-MEIS1complex coordinately acts as a transcriptional activator because the majority of genes are repressed in the absence of MEIS1, in contrast to the predominant repression associated with the HOXA9-SAFB-MEIS1 complex (Figure 4J-K).
To further examine any relationship between the H9SB and HOXA9-MEIS1 complexes, we similarly analyzed DepMap data after HOXA9 and MEIS1 perturbation across 26 AML cell lines. Although we could confirm a trend for correlation of their gene effects, unlike that for HOXA9 and SAFB, this was not significant (P = .086, Pearson coefficient = 0.343, data not shown). These data suggest that the H9SB complex predominantly functions independently of MEIS1.
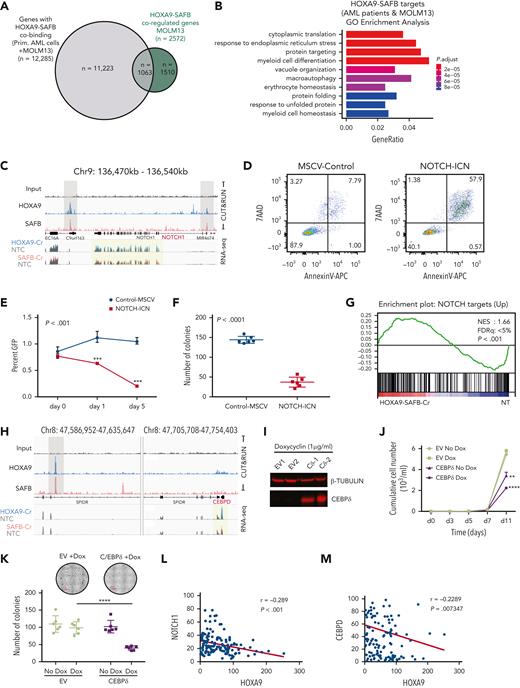
Further corroboration in primary cells from patients with AML (n = 5) identified a significant number of high-confidence peaks for HOXA9 and SAFB using the CUT&RUN method, many demonstrating genomic coenrichment. We observed a significant overlap, ∼40% to 60% of SAFB-bound regions were also co-occupied by HOXA9 in primary AML cells (supplemental Figure 8A), which is in consonance with the data found for MOLM13 cells. Comparative analyses32 revealed significant overlap within AML samples, with 1542 unique peaks shared between 3 AML samples (supplemental Figure 8A). The overlap between MOLM13 and primary AML samples revealed that >1000 peaks were shared between MOLM13 and at least 2 AML samples (supplemental Figure 8A). Of the 2572 genes differentially expressed after the experimental knock down of HOXA9 and SAFB in MOLM13, 1062 (41%) were also bound by HOXA9 and SAFB in MOLM13 cells and a minimum of 3 in samples from patients with AML (Figure 5A; supplemental Table 4). These data suggest that these genes are directly regulated by the H9SB transcriptional complex. GO analyses of these genes enriched for terms associated with myeloid differentiation, as we previously observed (Figure 5B).
NOTCH1 and CEBPδ are targets of the H9SB repressive complex. (A) The Venn diagram shows the overlap between genes commonly dysregulated upon HOXA9 and SAFB perturbation in MOLM13 cells (green) and genes that are linked to H9SB co-occupied genomic regions in primary AML cells and MOLM13 cell line (gray). A list of these genes is provided in supplemental Table 4. Hypergeometric test P < 2.115e-56. (B) GO analyses for target genes responded to HOXA9 or SAFB perturbation in MOLM13 cells and are common in primary AML cells and MOLM13 cells. The gene ratio is plotted on the x-axis. The colors on the bar represent the significant P value. A bar that represents the color code is shown on the right side of the plot. (C) Genome browser tracks demonstrate the enrichment of HOXA9 (blue) and SAFB (red) at the representative NOTCH1 locus in the Hg38 genome obtained from CUT&RUN sequencing in MOLM13 cells. The lower 2 tracks show the RNA-seq data and the expression of NOTCH1 to be upregulated in HOXA9-Cr (overlain blue) and SAFB-Cr (overlain red) compared with that in the NT control (gray). (D) Apoptosis in MOLM13-NOTCH1-ICN or MOLM13-MSCV-control cells was measured using annexin V– and 7AAD-positive cells by flow cytometry. Plots are representative of 3 biological independent replicates. (E) Competition assay between green fluorescent protein (GFP)–positive NOTCH1-ICN or murine stem cell virus (MSCV) control vector expressing MOLM13 cells. Equal numbers of GFP-positive cells were seeded at day 0, and the GFP percentage was measured 3 and 5 days later via flow cytometry. The values were normalized to the average percent from EV control and plotted as a line graph. Data shown are the averages of 3 biological replicates ± SD. (F) Colony-forming assay of GFP positive MOLM13-NOTCH1-ICN or MOLM13-MSCV-control cells. The bar graph shows the average value of 3 independent experiments ± SD. (G) Gene set enrichment analysis for H9SB commonly regulated genes (n = 2440) enriches for NOTCH signature. (H) Genome browser track representation of another exemplar locus (CEBPδ). Track details are as described for panel C. (I) Western blot showing the expression of CEBPδ in MOLM13 cells upon doxycycline treatment for 2 days. β-Tubulin was used as a loading control. (J) Cumulative cell growth of MOLM13 cells in CEBPδ overexpressing cells ± doxycycline. The experiment shown here is an average of 3 independent replicates obtained from 2 independent clones. Error bars represent ± SD. Statistical significance was calculated using 2-way ANOVA with multiple comparisons (95% CI) against EV-Dox, (EV-Dox-CEBPD-Dox at day 11, ∗∗∗∗P < .0001; EV-No Dox-CEBPD-No Dox at day 11, ∗∗P = .009). (K) Colony-forming assay of MOLM13-CEBPδ or MOLM13-control cells ± doxycycline. Photomicrographs showing representative plates (top). The scatter plot shows 3 independent experiments in duplicates, showing median ± SD (bottom). Statistical significance was calculated using 2-way ANOVA with multiple comparisons (95% CI) EV-Dox-CEBPD-Dox, ∗∗∗∗P < .0001. (L) Correlation between HOXA9 and NOTCH1 mRNA expression in human AML primary samples (n = 165, TCGA data set). (M) Correlation between HOXA9 and CEBPδ mRNA expression in human AML primary samples (n = 165, TCGA data set).
NOTCH1 and CEBPδ are targets of the H9SB repressive complex. (A) The Venn diagram shows the overlap between genes commonly dysregulated upon HOXA9 and SAFB perturbation in MOLM13 cells (green) and genes that are linked to H9SB co-occupied genomic regions in primary AML cells and MOLM13 cell line (gray). A list of these genes is provided in supplemental Table 4. Hypergeometric test P < 2.115e-56. (B) GO analyses for target genes responded to HOXA9 or SAFB perturbation in MOLM13 cells and are common in primary AML cells and MOLM13 cells. The gene ratio is plotted on the x-axis. The colors on the bar represent the significant P value. A bar that represents the color code is shown on the right side of the plot. (C) Genome browser tracks demonstrate the enrichment of HOXA9 (blue) and SAFB (red) at the representative NOTCH1 locus in the Hg38 genome obtained from CUT&RUN sequencing in MOLM13 cells. The lower 2 tracks show the RNA-seq data and the expression of NOTCH1 to be upregulated in HOXA9-Cr (overlain blue) and SAFB-Cr (overlain red) compared with that in the NT control (gray). (D) Apoptosis in MOLM13-NOTCH1-ICN or MOLM13-MSCV-control cells was measured using annexin V– and 7AAD-positive cells by flow cytometry. Plots are representative of 3 biological independent replicates. (E) Competition assay between green fluorescent protein (GFP)–positive NOTCH1-ICN or murine stem cell virus (MSCV) control vector expressing MOLM13 cells. Equal numbers of GFP-positive cells were seeded at day 0, and the GFP percentage was measured 3 and 5 days later via flow cytometry. The values were normalized to the average percent from EV control and plotted as a line graph. Data shown are the averages of 3 biological replicates ± SD. (F) Colony-forming assay of GFP positive MOLM13-NOTCH1-ICN or MOLM13-MSCV-control cells. The bar graph shows the average value of 3 independent experiments ± SD. (G) Gene set enrichment analysis for H9SB commonly regulated genes (n = 2440) enriches for NOTCH signature. (H) Genome browser track representation of another exemplar locus (CEBPδ). Track details are as described for panel C. (I) Western blot showing the expression of CEBPδ in MOLM13 cells upon doxycycline treatment for 2 days. β-Tubulin was used as a loading control. (J) Cumulative cell growth of MOLM13 cells in CEBPδ overexpressing cells ± doxycycline. The experiment shown here is an average of 3 independent replicates obtained from 2 independent clones. Error bars represent ± SD. Statistical significance was calculated using 2-way ANOVA with multiple comparisons (95% CI) against EV-Dox, (EV-Dox-CEBPD-Dox at day 11, ∗∗∗∗P < .0001; EV-No Dox-CEBPD-No Dox at day 11, ∗∗P = .009). (K) Colony-forming assay of MOLM13-CEBPδ or MOLM13-control cells ± doxycycline. Photomicrographs showing representative plates (top). The scatter plot shows 3 independent experiments in duplicates, showing median ± SD (bottom). Statistical significance was calculated using 2-way ANOVA with multiple comparisons (95% CI) EV-Dox-CEBPD-Dox, ∗∗∗∗P < .0001. (L) Correlation between HOXA9 and NOTCH1 mRNA expression in human AML primary samples (n = 165, TCGA data set). (M) Correlation between HOXA9 and CEBPδ mRNA expression in human AML primary samples (n = 165, TCGA data set).
NOTCH1 and CEBPδ are the targets of the H9SB repressive complex
The NOTCH1 and CEBPδ genes were derepressed upon HOXA9 or SAFB perturbation, and co-occupancy of H9SB was observed proximal to their loci (Figure 5C,H). Similar relationships were also observed for the CDKN1A, S100A8, S100A9 S100A12, and BCL2A1 genes (supplemental Figure 9A).
Next, we sought to link the derepression of specific genes and the activation of the differentiation program with the abrogation of the leukemia maintenance phenotype. Upon obtaining a retroviral expression of an activated form of NOTCH1 (NOTCH1-ICN) in MOLM13 cells, we saw a strong impairment of growth/proliferation and clonogenic potential, accompanied by a marked increase in apoptosis (Figure 5D-F). Furthermore, gene set enrichment analyses on a preranked list of differentially expressed genes from H9SB-depleted MOLM13 cells demonstrated a striking correlation with NOTCH signatures (Figure 5G). To further extend our paradigm, we also assessed the effects of re-expressing CEBPδ in MOLM13 cells using an inducible system (Figure 5I). Similarly, CEBPδ expression attenuated MOLM13 cell growth and inhibited clonogenic growth in a semisolid methylcellulose medium (Figure 5J-K). Moreover, analyses of 179 patients with primary AML across all major subtypes revealed a negative correlation between NOTCH1 or CEBPδ and HOXA9 mRNA expression level (Figure 5L-M) with this paradigm extending to other H9SB-repressed genes (supplemental Figure 9B).
Taken together, these data demonstrate that in concert with SAFB, HOXA9 mediates repression of NOTCH1, CEBPδ, and other myeloid differentiation–associated genes to actively maintain the differentiation block associated with AML.
H9SB forms a repressive complex on chromatin with NuRD and HP1γ
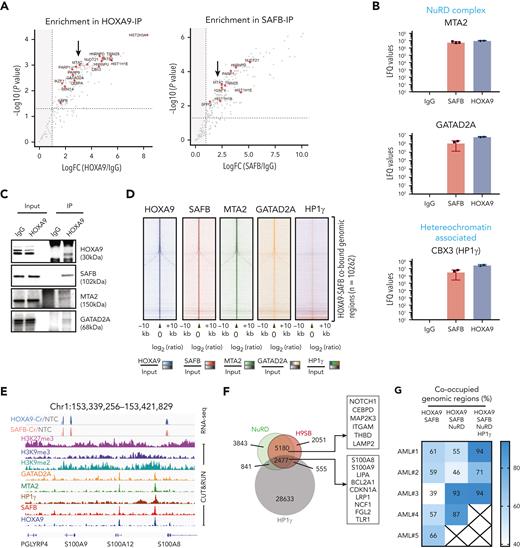
To determine the mechanism of gene repression mediated by the H9SB complex, we performed further proteomic analyses to identify chromatin-associated protein interactors of the complex using RIME.19 Considering only high-confidence proteins present in all replicates from both immunoprecipitants (supplemental Figure 10), we identified 79 proteins shared between SAFB and HOXA9 RIME (Figure 6A; details are provided in “Methods”; the complete list of H9SB-interacting proteins is provided in supplemental Table 1). String network analyses (https://string-db.org/) functionally annotated these proteins33 to be highly enriched for negative regulation of gene expression (47/79 proteins; false discovery rate = 1.33e-27). Clustering these proteins based on their molecular function resulted in 3 distinct clusters: RNA binding or splicing proteins (cluster 1), ribosomal proteins (cluster 2), and chromatin-associated proteins (cluster 3) (supplemental Figure 11A). Cluster 3 included members of the nucleosome remodeling and histone deacetylase (NuRD) complex (MTA2 and GATAD2A) and heterochromatin protein CBX3 (also known as HP1γ) (Figure 6B-C; supplemental Table 1). All 3 proteins showed specific enrichment, compared with that observed in the IgG controls, using the MaxLFQ approach34 (Figure 6B). Moreover, the interaction of HOXA9 with MTA2 and HP1γ seemed to be dependent on SAFB (Figure 1J; supplemental Table 1). We further validated the physical association of H9SB with NuRD complex members via coimmunoprecipitation, implying the formation of a HOXA9-repressive complex in AML cells (Figure 6C).
Assessing the genome-wide binding of the NuRD complex and HP1γ, via the CUT&RUN method, in MOLM13 cells further demonstrated that NuRD complex members (MTA2 and GATAD2A) exhibited considerable genome-wide overlap with H9SB cobound genomic regions (7657 overlapping regions out of 10 262 [75%] H9SB-cobound regions) (Figure 6D-F; supplemental Figure 11B). Although HP1γ enrichment was more modest, we observed a clear signal in the proximity of H9SB-bound genomic regions, with distal regions showing higher enrichment compared with promoter-bound regions (Figure 6D,F; supplemental Figures 12E-H and 13). Further analyses revealed that 2477 of 7657 (32%) NuRD-H9SB overlapping regions also harbored HP1γ binding (Figure 6F; supplemental Figure 12E-H; supplemental Table 4). Moreover, perturbation of HOXA9 and SAFB commonly affected the expression of 635 genes (differentially expressed) annotated at these peaks (within 50 kilobases), with 444 (70%) of these upregulated genes (supplemental Figure 13A). Notably, the upregulated genes again demonstrated the association with myeloid differentiation in GO analyses (Figure 6F; supplemental Figure 12D).
A higher enrichment of repressive histone modifications (H3K27me3, H3K9me2, and H3K9me3) was observed, particularly at nonpromoter bound peaks, in H9SB co-occupied loci compared with HOXA9-only occupied loci (supplemental Figure 12A-C). However, these loci also exhibited an enrichment of H3K4me3, although, as expected, enrichment was more prominent at promoter regions (supplemental Figure 12B-C). Exemplar loci are shown in Figure 6E and supplemental Figure 12E-H. The global gene expression changes in the nearest genes associated with NuRD or HP1γ co-occupancy in the H9SB complex are shown in the heat maps in supplemental Figure 13, and the list of genes is provided in supplemental Table 4.
To corroborate these findings in primary samples, we also performed CUT&RUN for NuRD (MTA2 and GATAD2A) and HP1γ in primary AML cells (n = 5) and intersected the NuRD/HP1γ-bound regions with H9SB. Interestingly, for a very significant fraction of the H9SB cobound regions, we could also document the binding of the NuRD and HP1γ repressors (Figure 6G). Taken together, these data also confirm the presence of an H9SB-repressive complex in primary AML cells. Exemplar loci are shown in Figure 6H.
SAFB is required for NuRD and HP1γ recruitment at H9SB-bound loci
Our proteomic data suggested that HOXA9 protein interaction with NuRD and HP1γ requires the presence of SAFB (Figure 1J; supplemental Table 1). To test this genome wide, we performed SAFB knockdown using shRNA in MOLM13 cells and analyzed the genomic occupancy of NuRD and HP1γ at H9SB-bound genomic loci via the CUT&RUN method. We observed an obvious and clear reduction in the enrichment of NuRD complex members (MTA2 and GATAD2A) and HP1γ at these loci (Figure 6I). Selected exemplar tracks are shown to visually demonstrate this at critical loci (Figure 6K). These data supported our earlier finding that HOXA9-mediated repression via NuRD/HP1γ requires the presence of SAFB. In addition, we assessed whether the loss of repression, related to the perturbation of SAFB, had any impact on H3K27ac at H9SB genomic loci or for the recruitment of activator proteins such as p300 and BRD4. Interestingly, we observed an increase in H3K27Ac and an increase in enrichment of p300 and BRD4 at the H9SB cobound loci on SAFB knockdown (Figure 6J,K). These data further document the dynamics of complex formation and histone-modification state at H9SB-bound loci, where the loss of SAFB-mediated repression allows reactive changes, including the recruitment of activator complex members and their associated histone marks.
NuRD and HP1γ inactivation phenocopies H9SB at the functional and transcriptional level
To determine the functional relevance of NuRD complex and HP1γ co-occurrence at H9SB-bound genomic regions, we targeted them genetically and via the pharmacological inhibition of their obligate/recruited catalytic components. The NuRD complex contains obligate histone deacetylase activity, and HP1γ binds to the H3K9me3 mark deposited by the SUV39H1 protein. By treating the AML cell lines with a combination of a specific inhibitor of SUV39H1 (chaetocin) and a pan-HDAC inhibitor (panobinostat), we sought to further dissect mechanisms underlying H9SB-mediated gene repression. Notably, both chaetocin and panobinostat have already been reported to inhibit the growth of AML cells alone or more potently in combination;35-37 however, the gene expression programs and the chromatin-associated mechanisms that underlie these findings have not been elucidated.
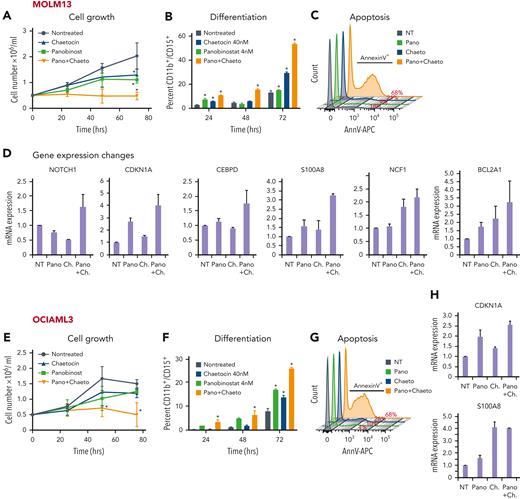
Remarkably, we could demonstrate that cotreatment with panobinostat and chaetocin, at noncytotoxic concentrations in AML cell lines,36,37 could indeed phenocopy perturbation of HOXA9 or SAFB. The combination treatment caused a significant reduction in cell growth, along with the induction of apoptosis and differentiation, compared with the cells treated with single agents or a vehicle (Figure 7A-C,E-G [MOLM13 and OCIAML3, respectively]; supplemental Figure 14). Because the inhibition of HDAC and SUV39H1 activity is likely to have widespread transcriptional consequences, we specifically assessed the ability of the inhibitors to derepress the expression of 9 candidate H9SB-repressed genes using quantitative reverse transcription polymerase chain reaction (qRT-PCR) and found similar derepression of these genes as was observed upon HOXA9 or SAFB knockdown (Figure 7D,H; supplemental Figure 14C,E). To further corroborate these findings, we also performed genetic perturbation of NuRD subunits (MTA2 and GATAD2A) and HP1γ via CRISPR-mediated knockout in MOLM13 and OCIAML3 cell lines. Genetic loss of these proteins also induced myeloid differentiation and apoptosis in both AML cell lines (supplemental Figure 15). qRT-PCR demonstrated derepression of the majority of H9SB-repressed genes after perturbation (supplemental Figure 15C,F).
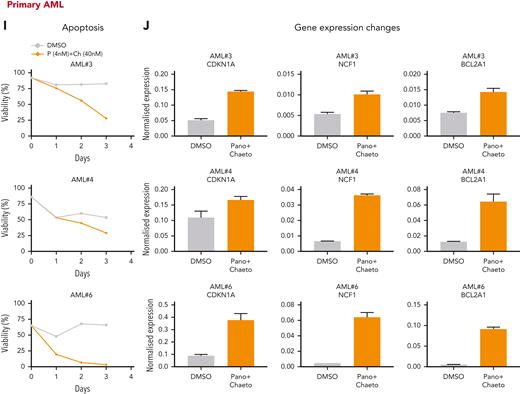
Next, we tested the ability of these inhibitors to abrogate cell viability and derepress similar gene expression programs in samples from patients with AML. As often observed with primary AML samples, we observed a heterogeneous response pattern in the tested AML group (n = 10). However, 7 out of 10 samples showed reduced viability when treated with both inhibitors in combination (Figure 7I; supplemental Figure 16A,C). We also assessed the transcriptional changes in these primary samples by qRT-PCR on selected target loci after treatment with both inhibitors and found an excellent correlation between the observed phenotypic changes in viability and the degree of derepression of specific H9SB-repressed genes (Figure 7J; supplemental Figure 16B).
Discussion
The function of HOXA9 as an oncogene in AML has been almost solely attributed to its ability to activate gene programs associated with leukemia.15 However, repressive functions have previously been associated with HOXA9 for genes including the p16INK4a/p19ARF locus, although mechanistic detail has been lacking.17,18 We provide evidence that the maintenance of the leukemic phenotype is dependent on the repressive effects of HOXA9 and that this repressive function requires the SAFB protein. SAFB was first described based on its ability to bind scaffold attachment region DNA elements and the nuclear matrix. This S/MAR protein (1) binds to both DNA and RNA,38 (2) stabilizes pericentromeric heterochromatin via interactions with major satellite RNA,39 (3) regulates DNA damage, and (4) interacts with proteins and complexes involved in chromatin architecture and regulates transcriptional activation and repression via poorly-understood mechanisms.40-42 Our data suggest that HOXA9 and SAFB, in turn, recruits the NuRD and HP1γ corepressor complexes to repress the induction of genes critical for normal myeloid differentiation, including NOTCH1, CDKN1A, CEBPδ, S100A8, and S100A12. Suppression of NOTCH signaling has been previously described as a requirement for AML, although the mechanism underlying this repression was previously unknown. Similar to NOTCH1 and NOTCH2 reactivation in MLL-rearranged leukemias,43,44 we could demonstrate that the restoration of NOTCH1 and other targets such as CEBPδ, via either the exogenous overexpression or the knock down of HOXA9 or SAFB, could inhibit the growth of leukemia cells and induce differentiation and cell death.
In Hoxa9/Meis1-transformed murine AML, Hoxa9 binding to intergenic regions facilitates the establishment of de novo enhancers, in conjunction with Cebpα and the Mll3/4 complex, leading to the expression of leukemia-specific genes.15 However, here we focused on the HOXA9 binding sites that overlapped with SAFB in human leukemic cells. One-third of these regions were in distal rather than promoter elements and the majority H9SB binding was associated with gene repression. S/MAR regions have been shown to flank enhancers, so that they may provide boundary function and/or localize cis-regulatory elements to specific regions of the nucleus.45,46 Interestingly, H9SB cobound regions possessed sequence characteristics of S/MAR and modifications characteristic of both repressive (H3K9me2, H3K9me3, and H3K27me3) and activated chromatin (H3K4me3 and increased accessibility).47 The genes linked to these regions are also known to be readily activated during myeloid differentiation. We speculate that when bound by HOXA9 and SAFB, NuRD and HP1γ are recruited to these elements to mediate repression and that this cellular state is enforced in AML cells. However, upon the loss of HOXA9 expression, which occurs during normal myeloid differentiation, we hypothesize that the elements are poised for subsequent rapid activation facilitating further maturation (illustrated in supplemental Figure 17).
Earlier studies describing the role of epigenetic repressors (SUV39H1 and G9A, which also deposits H3K9me2 and can recruit HP1γ) in mixed-lineage leukemia11,48 are distinct from our work. First, in these reports, the analyzed gene sets are HOXA9-MEIS1 regulated and are obviously different from the genes that we have identified to be regulated by H9SB to suppress differentiation. Second, our data demonstrate that MEIS1-HOXA9, when cobound in the absence of SAFB, function together predominantly as a transcriptional activator complex for genes associated with proliferation and the cell cycle, whereas when bound together with SAFB, HOXA9 fulfills the role of a transcriptional repressor to reduce the expression of differentiation genes.
Studies in Safb-deficient mice suggest that it may have a role in hematopoiesis. Homozygous deletion of Safb resulted in increased prenatal and postnatal lethality, related to multiple developmental defects during embryogenesis, including reduced erythropoiesis.49 However, mice did survive to term, albeit with severe growth retardation. Our study identifies the H9SB axis to be important for the maintenance of the differentiation block in AML. Because of the central role of HOXA9 in normal hematopoiesis and hematopoietic stem cell function, we expect that it cannot be safely therapeutically targeted. Targeting the NuRD and HP1γ catalytic activity recruited by H9SB or specifically targeting the H9SB interaction in AML cells may be possible. However, further work will be necessary to determine the role of the H9SB interaction in normal hematopoiesis and elucidate the stoichiometry and structure of this interaction to check whether it is amenable to intervention.
A prominent role of liquid-liquid phase separation (LLPS) has recently been described in transcriptional regulation.50 Notably, 2 of the proteins in our putative repressive complex, SAFB and HP1 have recently been demonstrated to form biological condensates via LLPS.51-53 SAFB and HP1 liquid condensates promote and stabilize the formation of heterochromatin, and it is tempting to speculate that NuRD and HP1γ are not classically recruited to these loci by H9SB, but form cocondensed complexes within liquid condensates at cis-regulatory regions. Again, future work will be required to determine any relationship between the repressive complex and LLPS.
In summary, our study suggests that the maintenance of differentiation blockade is an active process that is critical for the leukemic state. We further demonstrate that this differentiation block is, at least in part, mandated by a novel repressive HOXA9 complex, thereafter detailing the molecular mechanisms that underlie the function of this H9SB complex (supplemental Figure 17). Finally, our study suggests that either the H9SB complex or its recruited effector proteins may be potential therapeutic targets.
Acknowledgments
The authors thank Pieter Van Vlierberghe of Ghent University for providing the NOTCH1-ICN-GFP retroviral construct.
This study was carried out in the laboratory of B.J.P.H. with funding from Cancer Research UK (C18680/A25508), the European Research Council (647685), the Medical Research Council (MRC) (MR-R009708-1), the Kay Kendall Leukaemia Fund (KKL1243), Worldwide Cancer Research (WCR14-1069) and the Cancer Research UK Cambridge Major Centre (C49940/A25117). This research was supported by the National Institute for Health Research (NIHR) Cambridge Biomedical Research Centre (BRC-1215-20014) and was funded in part by the Wellcome Trust, which supported the Wellcome Trust–MRC Cambridge Stem Cell Institute (203151/Z/16/Z) and Cambridge Institute for Medical Research (100140/Z/12/Z). J.B. is funded by the Wellcome Trust’s 4-Year MRes + PhD Programme in Stem Cell Biology and Medicine (218481/Z/19/Z). D.S. was a postdoctoral fellow of the Mildred-Scheel Organization, German Cancer Aid (111875). A.D.W. was funded by a grant from Blood Cancer UK (13005). G.S.V. is a Cancer Research UK Senior Cancer Research Fellow (C22324/A23015).
The views expressed are those of the authors and not necessarily those of the NIHR or the NIHR, Department of Health and Social Care.
Authorship
Contribution: S.A.-S. and B.J.P.H. conceptualized the study and performed the methodology; B.J.P.H. was involved in funding and resource acquisition, supervision, project administration, writing the manuscript, and reviewing the study; S.A.-S. performed investigation, validation, formal analysis, data curation, project administration, and writing of the original draft; J.B. investigated and validated CRISPR knockdown studies; G.G. investigated in vivo experiments; D.M.A.A. provided software formal analyses and bioinformatics data analyses; A.D.W., R.A., and J.W.H. performed investigation of the proteomic screen; S.A., A.-S.B., and F.S. investigated the proteomic screen and its validation; G.S.V. provided the resources; and D.S., H.Y., S.J.H., and C.K.L. provided the resources and wrote, reviewed, and edited the manuscript.
Conflict-of-interest disclosure: G.S.V. is a consultant to STRM.BIO and holds a research grant from AstraZeneca. The remaining authors declare no competing financial interests.
Correspondence: Brian J. P. Huntly, Wellcome Trust–MRC Cambridge Stem Cell Institute, Department of Haematology, Cambridge Biomedical Campus, Jeffrey Cheah Biomedical Centre, University of Cambridge, Cambridge CB2 0AW, United Kingdom; e-mail: bjph2@cam.ac.uk; and Shuchi Agrawal-Singh, Wellcome Trust–MRC Cambridge Stem Cell Institute, Department of Haematology, Cambridge Biomedical Campus, Jeffrey Cheah Biomedical Centre, University of Cambridge, Cambridge CB2 0AW, United Kingdom; e-mail: sa796@cam.ac.uk.
References
Author notes
∗J.B., G.G., and D.M.A.A. contributed equally to this study.
All sequencing data reported in this article have been deposited in the Gene Expression Omnibus database (accession number GSE221701).
Data are available on request from the corresponding authors, Brian J. P. Huntly (bjph2@cam.ac.uk) and Shuchi Agrawal-Singh (sa796@cam.ac.uk).
The online version of this article contains a data supplement.
There is a Blood Commentary on this article in this issue.
The publication costs of this article were defrayed in part by page charge payment. Therefore, and solely to indicate this fact, this article is hereby marked “advertisement” in accordance with 18 USC section 1734.


![SAFB phenocopies HOXA9 in leukemic cells. (A) Growth kinetics of MOLM13-Cas9 cells transduced with guide RNA (gRNA) (n = 3) targeting HOXA9 or SAFB. The data are shown as the average of biological replicates (n = 3) ± standard deviation (SD). Statistical significance was calculated against nontargeting control gRNA (nontreated [NT]) at time point days 4 and 5, using t test (2-tailed, P < .05), ∗P < .05, ∗∗P < .01, ∗∗∗P < .001, ∗∗∗∗P < .0001. (B) Western blot analyses showing the knockdown efficiency of HOXA9 and SAFB gRNAs in MOLM13 cells. β-tubulin is used as a loading control. (C) Apoptosis in MOLM13-Cas9 cells transduced with gRNA targeting HOXA9 (g5 and g7) or SAFB (g2 and g3) 5 days after transduction, as measured using annexin V and 7AAD staining. Plots are representative of 3 independent biological experiments. (D) Floating bar graphs summarizing results from the 3 independent experiments from apoptosis measurements using 3 gRNAs targeting HOXA9 (g5, g7, and g8) and SAFB (g1, g2, and g3) are shown. Statistical significance was calculated against NT using t test (2-tailed, P < .05), ∗P < .05, ∗∗P < .01, ∗∗∗P < .001. (E) Flow cytometric analyses of CD11b surface expression in MOLM13-Cas9 cells transduced with gRNA targeting HOXA9 (g5) or SAFB (g3). Contour plots shown here are representative of 3 independent biological replicates. (F) Floating bar graphs summarizing results from the 3 independent experiments from flow cytometric analyses of CD11b surface expression using 2 gRNAs targeting HOXA9 (g5 and g7) and SAFB (g2 and g3) are shown. Statistical significance was calculated against NT using t test (2-tailed, P < .05), ∗P < .05, ∗∗∗P < .001. (G) Western blot analyses showing expression of SAFB and HOXA9 in AML cell lines. β-Tubulin is used as a loading control. (H) CD11b surface expression in AML cell lines, 3 days after transduction, with gRNA targeting HOXA9 or SAFB (mean ± SD, n = 3). Statistical significance calculated using the 2-way analysis of variance (ANOVA) test, ∗∗P < .01. (I) Apoptosis measured via annexin V positivity in AML cell lines, 3 days after transduction, with gRNA targeting HOXA9 or SAFB (mean ± SD, n = 3). Statistical significance was calculated using the 2-way ANOVA test, ∗∗P < .01, ∗∗∗P < .001. (J) The mRNA expression of HOXA9 and SAFB in human AML primary samples (n = 179), AML The Cancer Genome Atlas (TCGA) data set. (K) Codependency between CRISPR knockout effects of HOXA9 and SAFB in AML cell lines (n = 26) from DepMap data set. Statistical significance was analyzed by linear regression at a 95% confidence interval (CI), P = .0016. The plot was generated using Prism. FITC, fluorescein isothiocyanate; KO, knockout.](https://ash.silverchair-cdn.com/ash/content_public/journal/blood/141/14/10.1182_blood.2022016528/3/m_blood_bld-2022-016528r1-gr2gk.jpeg?Expires=1766019970&Signature=mupKHED6mPFM62Ht21Js7oOolRc8656S6BBpQM-bvHM73zYs8eNoGu5PtX0OU8TIBs7m~8MEiO3ArCzPbgyA35XvRCTIx6tGcJ7-1yzPV7AxukCt74qdncg5jRISMotpxMvE8W02ghYQroL5OqgLwvxOtUxT9tlriP5yawVPxKIf2deqY-mUgxxSWH-yadS6NFgktkxMxNoDAlJO4EHSrbJ5UhQHQFV60Do29zNsLlfwzBg61h~g1syDXFQqUMscJX8wMPl6rhyw~zRa8KJD7Vx4Ei5EavCkgaRcaFf1b5u6w292QF7mLxnPxcddG8TNaq1tq4DTq0dprSWxMRYHqQ__&Key-Pair-Id=APKAIE5G5CRDK6RD3PGA)
![H9SB forms a repressive complex on chromatin with NuRD and HP1γ. (A) Volcano plot displaying the label-free quantitative MS result of HOXA9 and SAFB immunoprecipitation by RIME in MOLM13 cells. The plot shows the log2 ratio of averaged peptide MS intensities between HOXA9-IP vs IgG (left) or SAFB IP vs IgG (right) samples (x-axis), plotted against the negative log10P values (y-axis) calculated across the triplicate data sets. Student t test, n = 3 technical replicates. The dashed black line marks 1.5 log FC. Chromatin-associated proteins enriched in HOXA9 or SAFB pulldowns are marked as red dots. The complete list of SAFB-HOXA9 commonly enriched proteins is given in supplemental Table 1. (B) Bar graph displays the enrichment (label-free quantification [LFQ] values) of NuRD complex members (MTA2 and GATAD2A) or heterochromatin protein HP1γ in HOXA9 or SAFB or IgG immunoprecipitated samples. The data shown here are intensities from LFQ values obtained via mass spectrometric analyses of all replicates for IgG (n = 3), SAFB (n = 3), and HOXA9 (n = 2) pull downs, average ± SD. The program does not plot for zero values. (C) Western blots showing HOXA9 interaction with SAFB, MTA2, and GATAD2A via coimmunoprecipitation of endogenous HOXA9 pulldown in MOLM13 cells. (D) Heat maps of HOXA9, SAFB, MTA2, GATAD2A, and HP1γ signal (relative to Input) on H9SB co-occupied genomic regions measured by the CUT&RUN method in MOLM13 cells. The y-axis represents individual regions centered at H9SB-bound genomic regions (± 10 kilobases). Regions were sorted based on the increasing distance to TSS. The relationship between coloring and signal intensity is shown in the bar (bottom of the plot). (E) Exemplar loci demonstrating co-occurrence of NuRD, HP1γ, and repressive histone modifications with H9SB that correlated with derepression of the associated genes upon H9SB perturbation are shown in the genome browser track on selected loci S100A8 in the Hg38 genome, obtained from CUT&RUN sequencing in MOLM13 cells. The upper 2 tracks show the transcripts signal obtained from RNA-seq in MOLM13 cells after HOXA9 (blue) or SAFB (pink) perturbation. Transcripts signal for HOXA9- or SAFB-CRISPR samples are shown relative to the nontargeting control (gray). (F) Venn diagram showing the overlap of high-confident NuRD (GATAD2A + MTA2) and HP1γ peaks with H9SB-cobound genomic regions in MOLM13 cells. The numbers represent the genomic regions. The differentiation-associated target genes of the H9SB-repressive complex that were also upregulated upon H9SB perturbation are highlighted; the top box shows gene targets of HOXA9/SAFB/NuRD; the lower box shows gene targets of HOXA9/SAFB/NuRD/HP1γ. (G) Heat maps show genomic coenrichment of HOXA9 and SAFB in primary AML cells (n = 5). NuRD and HP1γ co-occupancy as determined by the intersection of NuRD (MTA2 and GATAD2A) and Hp1γ peaks with H9SB cobound peaks obtained in the same AML cells by CUT&RUN. Because of limited material availability, only selected antibodies were used for samples 4 and 5 for CUT&RUN experiments. The relationship between coloring and signal intensity is shown in the bar at the side of the plot. (H) The genome browser track shows the peak colocalization of HOXA9, SAFB, and NuRD complex (MTA2 and GATAD2A); HP1γ on selected loci S100A8 (left) and CEBPD/SPIDR (right) in the Hg38 genome, obtained from CUT&RUN sequencing in primary AML cells. (I) The average signal of MTA2 (left) and HP1γ (right) (intensity on the y-axis as normalized read count) centered at H9SB-cobound regions determined using CUT&RUN in MOLM13 cells with or without SAFB knockdown using shRNA. (J) The average signal of H3K27Ac (left) and BRD4 (right) (intensity on the y-axis as normalized read count) centered at H9SB-cobound regions determined using CUT&RUN in MOLM13 cells with or without SAFB knockdown using shRNA. (K) The genome browser track shows the reduction in the enrichment of NuRD complex (MTA2 and GATAD2A) and HP1γ after SFAB knockdown in MOLM13 cells. Lower tracks show the gained enrichment of BRD4 and H3K27Ac after SFAB knockdown in MOLM13 cells. Selected loci CEBPD/SPIDR in the Hg38 genome, the signal obtained from CUT&RUN sequencing.](https://ash.silverchair-cdn.com/ash/content_public/journal/blood/141/14/10.1182_blood.2022016528/3/m_blood_bld-2022-016528r1-gr6hk.jpeg?Expires=1766019970&Signature=t~PqRrbJRF738BQBDlYo0WtkWIkKEtkynQvRknaVc18tPzM6M8hC6mVan7PWz32T6VIg-rMZyOH2GWS9d7JGgGgkI9tFNy1P7rPQ~Us15EAIaY5fUIXAHzhUdB3cojJDHNZ159TPLPAmnFPFGkNUW3Cps9UEhUmdTHhyxa0XwDMk364Iej1KIAOcs00W9iRLFrafkq66ILLJVoGWeSxmK9FdwTrG8HLEmOOYQdp6Zvp61uyrRyEOvdxDnfIZBbcZp7yB2fRrgN2IP1i4UD~wAlazr8AH9tmL5yg82Va94Krs1QpJoPgdKzjb1XYJyTZfsnkLGmC-LsHWKQVLMvxEcg__&Key-Pair-Id=APKAIE5G5CRDK6RD3PGA)
