Key Points
Patients with chronic ITP had clonal expansions of disease-associated TEMRA CD8+ T cells.
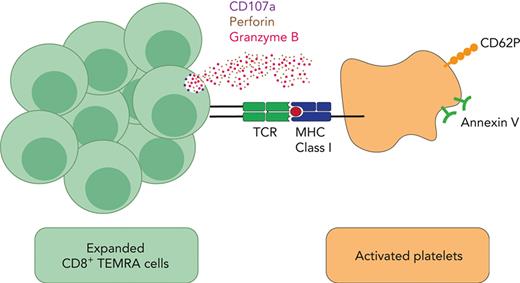
CD8+ T cells bind to platelets and cause their activation and apoptosis, defining an antibody-independent mechanism of platelet destruction.
Abstract
Immune thrombocytopenia (ITP) is traditionally considered an antibody-mediated disease. However, a number of features suggest alternative mechanisms of platelet destruction. In this study, we use a multidimensional approach to explore the role of cytotoxic CD8+ T cells in ITP. We characterized patients with ITP and compared them with age-matched controls using immunophenotyping, next-generation sequencing of T-cell receptor (TCR) genes, single-cell RNA sequencing, and functional T-cell and platelet assays. We found that adults with chronic ITP have increased polyfunctional, terminally differentiated effector memory CD8+ T cells (CD45RA+CD62L−) expressing intracellular interferon gamma, tumor necrosis factor α, and granzyme B, defining them as TEMRA cells. These TEMRA cells expand when the platelet count falls and show no evidence of physiological exhaustion. Deep sequencing of the TCR showed expanded T-cell clones in patients with ITP. T-cell clones persisted over many years, were more prominent in patients with refractory disease, and expanded when the platelet count was low. Combined single-cell RNA and TCR sequencing of CD8+ T cells confirmed that the expanded clones are TEMRA cells. Using in vitro model systems, we show that CD8+ T cells from patients with ITP form aggregates with autologous platelets, release interferon gamma, and trigger platelet activation and apoptosis via the TCR-mediated release of cytotoxic granules. These findings of clonally expanded CD8+ T cells causing platelet activation and apoptosis provide an antibody-independent mechanism of platelet destruction, indicating that targeting specific T-cell clones could be a novel therapeutic approach for patients with refractory ITP.
Medscape Continuing Medical Education online

In support of improving patient care, this activity has been planned and implemented by Medscape, LLC and the American Society of Hematology. Medscape, LLC is jointly accredited with commendation by the Accreditation Council for Continuing Medical Education (ACCME), the Accreditation Council for Pharmacy Education (ACPE), and the American Nurses Credentialing Center (ANCC), to provide continuing education for the healthcare team.
Medscape, LLC designates this Journal-based CME activity for a maximum of 1.0 AMA PRA Category 1 Credit(s)™. Physicians should claim only the credit commensurate with the extent of their participation in the activity.
Successful completion of this CME activity, which includes participation in the evaluation component, enables the participant to earn up to 1.0 MOC points in the American Board of Internal Medicine's (ABIM) Maintenance of Certification (MOC) program. Participants will earn MOC points equivalent to the amount of CME credits claimed for the activity. It is the CME activity provider's responsibility to submit participant completion information to ACCME for the purpose of granting ABIM MOC credit.
All other clinicians completing this activity will be issued a certificate of participation. To participate in this journal CME activity: (1) review the learning objectives; (2) study the education content; (3) take the post-test with a 75% minimum passing score and complete the evaluation at https://www.medscape.org/journal/blood; and (4) view/print certificate. For CME questions, see page 2543.
Disclosures
Laurie Barclay, MD, freelance writer and reviewer, Medscape, LLC, declares no competing financial interests.
Learning Objectives
Upon completion of this activity, participants will:
Assess the role of cytotoxic CD8+ T-cell clones in patients with immune thrombocytopenia, based on a multidimensional approach comparing patients with immune thrombocytopenia with age-matched controls
Evaluate the mechanisms of CD8+ T-cell–mediated platelet destruction in patients with immune thrombocytopenia, based on a multidimensional approach comparing patients with immune thrombocytopenia with age-matched controls
Determine the clinical and research implications of the role of cytotoxic CD8+ T-cell clones and mechanisms of CD8+ T-cell–mediated platelet destruction in patients with immune thrombocytopenia
Release date May 18, 2023; Expiration date: May 18, 2024
Introduction
Immune thrombocytopenia (ITP) is an acquired autoimmune disorder characterized by thrombocytopenia with increased morbidity and mortality due to bleeding, fatigue, and treatment-related complications.1-4 International guidelines highlight a lack of diagnostic and prognostic markers, limited data to guide treatment decisions, and heterogeneity of responses to treatment.2,5,6
The initial biological studies in ITP focused on the role of autoantibodies, with passive transfer experiments demonstrating a pathogenic role for autoantibodies against platelet surface antigens.7-9 Drug discovery efforts have therefore focused on the suppression of aberrant humoral immunity via B-cell depletion (by targeting CD20 or B-cell activating factor),10,11 immunoreceptor signaling disruption (by blocking spleen tyrosine kinase12 or Bruton tyrosine kinase13), and autoantibody activity inhibition (by using steroids, IV immunoglobulin, or neonatal Fc receptor inhibition).14
Nonetheless, antibody-independent regulators of thrombocytopenia such as T cells are likely to play an important role in ITP because antiplatelet antibodies are difficult to detect in many patients;15 antiplatelet antibodies do not predict response to treatment;16 B-cell–directed therapies are not effective in many patients;17 and a proportion of patients remain refractory to all existing therapies, which suggests other mechanisms of disease. Although abnormalities in CD4+ T cells that are skewed toward Th118-20 and abnormal number and function of T regulatory cells (Tregs)20 are thought to drive the autoimmune process, the role of CD8+ T cells remains unclear.
Cytotoxic CD8+ T cells were first implicated in ITP in 2003,21 and, subsequently, data from murine models of ITP have suggested that CD8+ T cells contribute to thrombocytopenia in vivo.22,23 However, the nature or importance of CD8+ T cells in patients with ITP is not known, and the role of platelet-specific CD8+ T cells have not been characterized in humans.24-28
We therefore pursued several orthogonal approaches to identify CD8+ T-cell clones and explore CD8+ T-cell–mediated platelet destruction in patients with ITP.
Methods
Patient recruitment
Patients were recruited from the Imperial College National Health Service Trust ITP center or the Weill Medical College of Cornell University, New York Presbyterian Hospital, New York, NY. Patients were included if they had been diagnosed with primary ITP based on established criteria.1 Patients with secondary ITP were excluded (patients were all screened for HIV, hepatitis C, hepatitis B, antinuclear antibodies, and blood film or flow analysis, when indicated). A total of 83 patients and 51 age-matched healthy controls were included in the study.
We categorized patients based on their clinical phenotype to correlate findings with the severity of the disease. We used the following definitions: a platelet count of <30 × 109/L was considered more active disease because this is the platelet count recommended for treatment in most international guidelines. Patients with chronic ITP lasting >1 year and who were refractory to ≥2 prior therapies were defined as refractory.
The study was performed in accordance with the guidelines by The Multi Centre Research Ethics Committee for Wales (07/MRE09/54: R12039, R12033) and the institutional review board for Weill Cornell Medicine, New York. Written consent was obtained for all participants in the study.
Peripheral blood mononuclear cells (PBMCs) and clinical metadata were taken during clinic visits (not all samples were used for each experiment).
PBMC preparation
Venous blood (18 mL) was collected into lithium heparin vacutainers (BD Biosciences), diluted with Dulbecco’s phosphate-buffered saline (Sigma-Aldrich) at a ratio of 1:1, and layered on top of Histopaque-1077 (Sigma-Aldrich) in SepMate-50 (IVD) tubes (Stemcell Technologies, Canada). After centrifugation for 15 minutes at 1200g, the upper layer containing plasma and PBMCs were washed twice with Dulbecco’s phosphate-buffered saline. PBMCs were then counted using trypan blue (Gibco, United Kingdom).
Platelet preparation
Venous blood collected into 2.7 mL trisodium citrate vacutainers was centrifuged immediately at 100g for 20 minutes to obtain the platelet-rich plasma. Platelet-rich plasma was supplemented with 75 mU/mL of apyrase (Sigma-Aldrich), 100 nM of prostaglandin E1 (Sigma-Aldrich), and 10% per volume trisodium citrate and further centrifuged at 1500g for 10 minutes to remove platelet-poor plasma. Isolated platelet pellets were then washed with 5 mL HEPES (N-2-hydroxyethylpiperazine-N′-2-ethanesulfonic acid)–Tyrode buffer supplemented with 3.5 mg/mL bovine serum albumin (Sigma-Aldrich), prostaglandin E1, and apyrase. Total platelet count was determined using flow cytometry.
PBMC surface and intracellular staining
T-cell subsets were described based on the surface expression of CD45RA and CD62L, dividing the cells into 4 subsets; naïve (CD45RA+CD62L+), terminally differentiated effector memory or TEMRA (CD45RA+CD62L−), central memory (CD45RA−CD62L+), and effector memory (CD45RA−CD62L−; supplemental Figure 1, available on the Blood website).
Cells were stimulated with eBioscience cell stimulation cocktail (Thermo Fisher Scientific) and fixed and permeabilized using a staining buffer set (Thermo Fisher Scientific) for intracellular cytokine staining. Cells were stained with conjugated antibodies against granzyme B, interferon gamma (IFN-γ), interleukin 2 (BD Biosciences), and tumor necrosis factor α (TNFα) (BioLegend).
Stained cells were analyzed using a BD LSR II cytometer (BD Biosciences). BD FACSDIVA software (BD Biosciences) was used to acquire events on the cytometer, and FlowJo software (Tree Star) and FCS Express 6 Flow Cytometry Research Edition (De Novo Software) were used to analyze acquired data. In total, 32 patients were included in the immunophenotype analysis.
DNA-based TCR sequencing
Next-generation sequencing of the T-cell receptor (TCR) β gene (TRB) was carried out as previously described.29 A total of 70 patients from London (n = 38) and New York (n = 32) were included. Briefly, genomic DNA was extracted from patient PBMC or fluorescence-activated cell sorter (FACS)-sorted TEMRA cell samples using DNeasy Blood & Tissue kit (Qiagen, United Kingdom), quantified using a Qubit Fluorometer (Thermo Fisher Scientific), and amplified via multiplex polymerase chain reaction of rearranged variable diverse joining (VDJ) segments of the TCR genes, which encode the TCR chain including hypervariable CDR3 domain. The products were size selected using Pronex beads (Promega, United Kingdom) and sequenced on a MiSeq (Illumina, United Kingdom).
Analysis of raw TCR sequences was performed using MiXCR.30 Variable joining gene usage was evaluated using VDJ tools. Clonal expansion, TCR diversity, Simpson diversity index, and similarity of the TCR repertoire were calculated using the tcR package supported in R and the numpy package supported in python.
Morisita-Horn similarity index (CMH) was used to explore TCR sharing in patients with ITP. Pairwise comparisons were performed between all patients to measure compositional similarity or overlap. CMH values lie between 0 (no overlap) and 1 (perfect overlap). The CMH value for every combination of 2 patients represent a total of 2485 pairwise combinations.
Samples were taken at multiple time points for TCR sequencing in 9 patients, including 2 who were followed-up over a number of years. Clinical data for these patients are characterized in supplemental Table 1 (patients 1-9).
TCR sequencing was also performed on TEMRA cells isolated based on their surface expression (CD45RA+CD62L−) and compared with whole PBMCs in the same individuals via CMH.
Single-cell immune profiling (RNA sequencing and TCR sequencing), library construction, and sequencing
CD8+ T cells from patients with expanded T-cell clones were FACS sorted using a FACSAria flow cytometer (Becton Dickinson, Mountain View, CA). Libraries were constructed using Chromium system (10x Genomics, Chromium Single Cell VDJ, and 5′ Library kits). Reverse transcription, amplification, and library preparation of both 5′ transcriptome and VDJ libraries were performed per published protocols (10x Genomics). The constructed library was sequenced on the HiSeq platform (Illumina) with 150 × 2 paired-end reads for gene expression and TRB libraries. Upon sequencing, we obtained gene expressions from 15 431 of 17 000 cells and additional TCR clonotype data from 63.9% of these cells. A minimum of 8384 reads per cell were collected for gene expression, and 6939 reads for TCR profiling.
Single-cell RNA analysis
Cell Ranger (version 3.0.2) performed sample demultiplexing, barcode processing, and single-cell 5′ unique molecular identifier counting. The Cellranger mkfastq pipeline was used to demultiplex Illumina base-call files into FastQ files and align them to the GCRhg38 genome. Cell Ranger count was applied to each FastQ file to produce a feature barcoding and gene expression library. Seurat version 2.3.4 was used for gene expression analysis. The following criteria were applied to obtain a gene-barcode matrix: gene number between 313 and 2500, and mitochondrial gene percentage ≤10%. After filtering, 7391 cells were remaining for analysis.
Functional assays
Functional assays were performed on samples from patients with chronic ITP lasting >1 year and was refractory to at least 2 prior therapies and who had expanded T-cell clones.
VenaFluoro8+ microchips (Cellix, Ireland) were coated with human von Willebrand factor (VWF) to enable capture of platelets onto the microfluidic channels. Fresh citrated whole blood from healthy individuals and patients with ITP was stained with DiOC6 (2.5 μM) to label platelets and perfused onto the microchip channel at 1000 s−1 for 3.5 minutes using a Mirus Evo Nanopump and Venaflux64 software (Cellix) to capture a monolayer of unactivated platelets, as previously described.31 Isolated PBMCs or blood from the same individual lysed with red blood cell lysis buffer (BioLegend) were stained with a conjugated antihuman CD8+ antibody and perfused onto the autologous platelet-covered channels at 50 s−1 for ∼5 to 10 minutes. Interactions between CD8+ T cells and platelets were monitored in real time using an inverted fluorescent microscope (Zeiss, Germany) or a SP5 confocal microscope (Leica, Germany). The number of CD8+ T-cell–platelet interactions per minute was derived by counting cells in 1 field of view for ∼5 to 10 minutes.
CD8+ T-cell–platelet ex vivo coculture system
CD8+ T cells were negatively selected from PBMCs using Mojosort Human CD8 T-cell isolation kit (BioLegend). Autologous platelets were obtained from citrated whole blood. As previously described,21,32,33 CD8+ T cells were cocultured with autologous platelets at a ratio of 1:5, overnight, at 37°C and 5% CO2 in complete medium before being harvested and stained with antibodies for CD8, CD41, CD107a, and CD62P (BioLegend). For major histocompatibility complex (MHC) class I blocking assays, freshly isolated platelets were incubated with 20 μg/mL of purified antihuman HLA-A, -B, and -C (BioLegend) for 15 minutes in 5% CO2 at 37°C before coculturing with CD8+ T cells.
Confocal imaging of CD8+ T-cell–platelet aggregates
After overnight coculture, CD8+ T-cell–platelets were prepared for confocal imaging. Cells were fixed with 4% paraformaldehyde for 10 minutes in 5% CO2 at 37°C, washed, and blocked with 2% bovine serum albumin (Thermo Fisher Scientific) for 1 hour. Cells were stained with purified antihuman CD42b monoclonal antibody (BioLegend), followed by goat antimouse immunoglobulin G (H + L)–Alexa Fluor Plus 555 (Thermo Fisher Scientific) before staining for Alexa Fluor 594–conjugated antihuman CD8a (BioLegend). Nucleic acid staining of cells was performed using Hoechst-33342 (Thermo Fisher Scientific), and cells were mounted in ProLong glass antifade mountant (Thermo Fisher Scientific) on poly-L-lysine–coated glass slides (Sigma-Aldrich, United Kingdom). Cells were analyzed using a Stellaris 8 inverted confocal microscope (Leica, United Kingdom).
IFN-γ ELISpot assay
IFN-γ enzyme-linked ImmunoSpot (ELISpot) assay was performed by coculturing PBMCs both with and without platelets in sterile conditions, on Millipore 96-well polyvinylidene fluoride plates (Thermo Fisher Scientific), as per the manufacturer’s instructions (Mabtech, Sweden). Plates were analyzed using a Zeiss Compact ELISpot reader (Zeiss, Germany).
Statistical analysis
The distribution of the data in different data sets were determined using the Shapiro-Wilk test. Unpaired and paired data sets were compared using two-tailed Mann-Whitney U and Wilcoxon matched-pairs tests, respectively. For >2 groups, Kruskal-Wallis test was used, and Bonferroni multiplicity correction was applied. Strength of association between 2 variables was analyzed using Spearman (parametric) and Pearson (nonparametric) correlation.
All statistical analyses were performed using GraphPad Prism 7 (GraphPad), and a P value <.05 was considered significant.
Results
Patient details are summarized in Table 1 (further clinical metadata, as available, are included in supplemental Table 1). Platelet counts were taken at the time of sample collection.
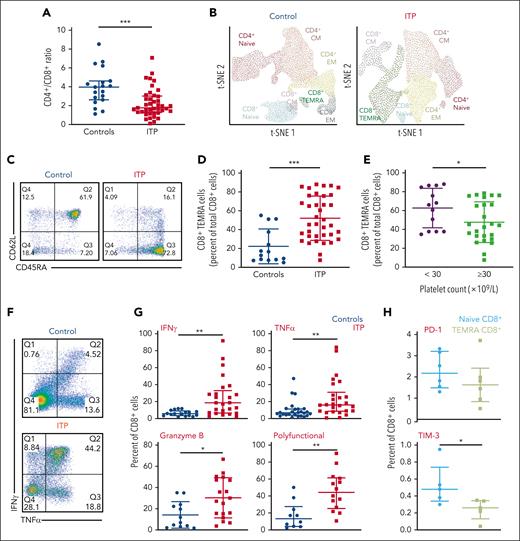
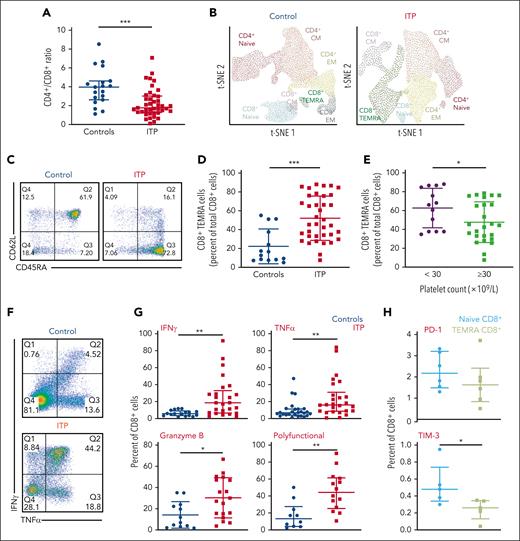
Compared with age-matched controls (n = 19), patients with chronic ITP (n = 32) had lower CD4+:CD8+ ratios (1.77 vs 3.97; P ≤ .001; Figure 1A). CD4+ and CD8+ cells were further analyzed by quantifying surface CD45RA and CD62L expression (supplemental Figure 1). Using t-distributed stochastic neighbor embedding, the most significant differences between patients and controls were an expanded population of terminally differentiated CD8+ T cells, known as TEMRA cells34 (Figure 1B). TEMRA cells are polyfunctional cells, expressing multiple inflammatory cytokines including TNFα, IFN-γ, and granzyme B. They reexpress CD45RA and lose the expression CD62L (CD45RA+CD62L−). These cells express high levels of CD57 and low levels of CD27 and CCR7 (supplemental Figure 1).
TEMRA cells without features of exhaustion are expanded in patients with ITP and correlate with disease activity. (A) Peripheral CD4+:CD8+ ratio is significantly lower in patients with ITP than in controls, indicating CD8-mediated disease. (B) A t-distributed stochastic neighbor embedding (tSNE) plot of the T-cell CD4+ and CD8+ subsets based on their surface expression of CD45RA and CD62L in a control patient and a patient with ITP. Expanded TEMRA cells from a patient with ITP are shown. (C) An example of a dot plot from flow cytometry analysis of a control vs a patient with ITP, using CD45RA and CD62L. (D) Patients with ITP compared with controls have significantly higher numbers of TEMRA cells. (E) Patients with platelet counts <30 × 109/L have higher numbers of TEMRA cells than those with platelet counts ≥30 × 109/L. (F) An example of a dot plot from flow cytometry analysis of a control vs a patient with ITP, showing expression of IFN-γ and TNFα. (G) CD8+ T cells in patients with ITP have increased IFN-γ, TNFα, and granzyme B; polyfunctional CD8+ T cells (expressing IFN-γ, TNFα, and granzyme B) are also increased in patients with ITP. (H) PD-1 expression has not changed, and Tim-3 expression is reduced in TEMRA cells. ∗P ≤ .05; ∗∗P ≤ .01; ∗∗∗P ≤ .001.
TEMRA cells without features of exhaustion are expanded in patients with ITP and correlate with disease activity. (A) Peripheral CD4+:CD8+ ratio is significantly lower in patients with ITP than in controls, indicating CD8-mediated disease. (B) A t-distributed stochastic neighbor embedding (tSNE) plot of the T-cell CD4+ and CD8+ subsets based on their surface expression of CD45RA and CD62L in a control patient and a patient with ITP. Expanded TEMRA cells from a patient with ITP are shown. (C) An example of a dot plot from flow cytometry analysis of a control vs a patient with ITP, using CD45RA and CD62L. (D) Patients with ITP compared with controls have significantly higher numbers of TEMRA cells. (E) Patients with platelet counts <30 × 109/L have higher numbers of TEMRA cells than those with platelet counts ≥30 × 109/L. (F) An example of a dot plot from flow cytometry analysis of a control vs a patient with ITP, showing expression of IFN-γ and TNFα. (G) CD8+ T cells in patients with ITP have increased IFN-γ, TNFα, and granzyme B; polyfunctional CD8+ T cells (expressing IFN-γ, TNFα, and granzyme B) are also increased in patients with ITP. (H) PD-1 expression has not changed, and Tim-3 expression is reduced in TEMRA cells. ∗P ≤ .05; ∗∗P ≤ .01; ∗∗∗P ≤ .001.
TEMRA cells were more in patients with ITP than in controls (66.30% vs 8.56%; P ≤ .001; Figure 1B-D; supplemental Figure 1). Correspondingly, patients with ITP had less naïve CD8+ T cells compared with controls (19.85% vs 56.06%; P ≤ .001). TEMRA cells were further increased in patients with more active disease with a platelet count <30 × 109/L when compared with those with platelet counts of ≥30 × 109/L; (66% vs 44%; P ≤ .05; Figure 1E).
CD8+ T cells from patients with ITP had increased levels of TNFα (15.8% vs 7.9%; P ≤ .01), IFN-γ (28.9% vs 6.6%; P ≤ .01), and granzyme B (28.6% vs 9.4%; P ≤ .05). Polyfunctional CD8+ T cells expressing the combination of IFN-γ, TNFα, and granzyme B were substantially more in patients with ITP than in controls (44.3% vs 13.2%; P ≤ .01; Figure 1F-G). Interleukin 2–expressing CD8+ T cells had also increased (26.4% vs 5.5%; P ≤ .01), and the highest cytokine levels were found within TEMRA cells.
TEMRA cells had less Tim-3 when compared with naïve CD8+ T cells (0.26% vs 0.48%; P ≤ .05) and had unchanged PD-1 expression. Such low/unchanged expression of these molecules indicates their continued activation, with no evidence of progressing into T-cell exhaustion35,36 (Figure 1h).
To establish whether these expanded cells were clonal in nature, we sequenced the TCR using an Illumina MiSeq platform, allowing us to identify single T-cell clones and look for shared clones that target a common antigen.
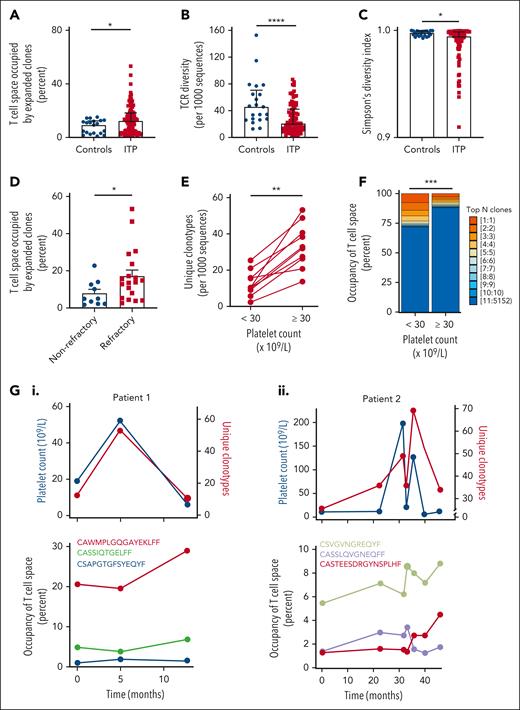
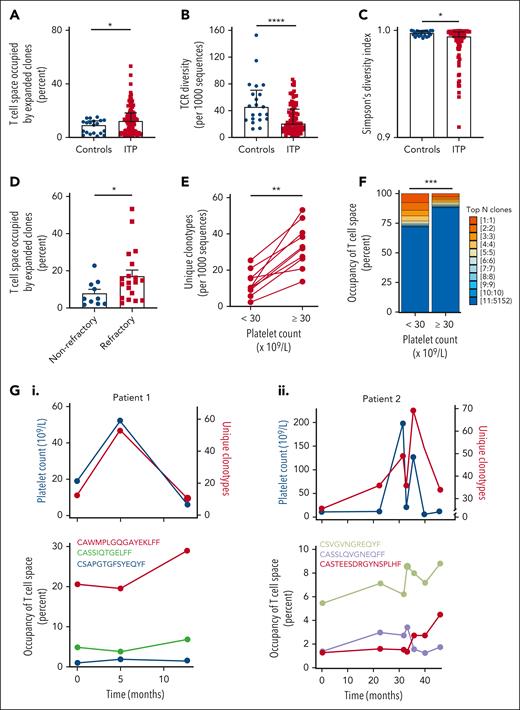
We observed a higher number of T-cell clones occupying >5% of the T-cell repertoire in patients with ITP (n = 70) when compared with age-matched controls (n = 21; P ≤ .05; Figure 2A). This expansion of T-cell clones was associated with reduced T-cell repertoire diversity (P ≤ .0001) and a lower Simpson diversity index (P ≤ .05) in patients with ITP than in age-matched controls (Figures 2B-C). This is consistent with established models of T-cell homeostasis: expansion of a clone occurs at the expense of overall T-cell repertoire diversity, thus maintaining approximately static T-cell numbers.37 Patients from London and New York had similar parameters in terms of their T-cell repertoire diversity (median of 21 vs 20, respectively) and Simpson diversity index (median of 0.9938 vs 0.9959, respectively).
High-throughput TCR sequencing reveals expansion of private clones associated with decreased TCR diversity in patients with ITP vs healthy controls: as clones expand, the platelet count falls. (A) The percentage of space occupied by the expanded clones (defined as clones occupying >5% of the repertoire) is significantly higher in patients with ITP than in healthy controls. (B) Number of productive unique CDR3 sequences (unique clones) per 103 unique clones is significantly lower in patients with ITP than in healthy controls. (C) Simpson diversity index is significantly lower in patients with ITP than in healthy controls. (D) In patients with refractory ITP, the percentage of space occupied by the expanded clones is significantly higher than in patients with nonrefractory ITP. (E) The number of productive unique clones per 103 unique CDR3 sequences (diversity) is reduced in patients with a platelet count of <30 × 109/L and recovers in individual patients as the count increases (platelet count of ≥30 × 109/L). (F) The amount of the T-cell repertoire/space taken up by expanded clones is higher in patients with a platelet count <30 × 109/L and falls in individual patients as the count returns to normal levels, reflecting the changes in T-cell repertoire. (G) In 2 patients with chronic ITP, individual clones were followed-up for over a number of years (point 0 is the first time that TCR is measured) and compared with the overall T-cell diversity and the platelet count. TCR diversity falls with the platelet count and increases as it recovers. Correspondingly, the individual clones expand as the platelet count decreases and contract as the platelet count increases. ∗P ≤ .05; ∗∗P ≤ .01; ∗∗∗P ≤ .001; ∗∗∗∗P ≤ .0001.
High-throughput TCR sequencing reveals expansion of private clones associated with decreased TCR diversity in patients with ITP vs healthy controls: as clones expand, the platelet count falls. (A) The percentage of space occupied by the expanded clones (defined as clones occupying >5% of the repertoire) is significantly higher in patients with ITP than in healthy controls. (B) Number of productive unique CDR3 sequences (unique clones) per 103 unique clones is significantly lower in patients with ITP than in healthy controls. (C) Simpson diversity index is significantly lower in patients with ITP than in healthy controls. (D) In patients with refractory ITP, the percentage of space occupied by the expanded clones is significantly higher than in patients with nonrefractory ITP. (E) The number of productive unique clones per 103 unique CDR3 sequences (diversity) is reduced in patients with a platelet count of <30 × 109/L and recovers in individual patients as the count increases (platelet count of ≥30 × 109/L). (F) The amount of the T-cell repertoire/space taken up by expanded clones is higher in patients with a platelet count <30 × 109/L and falls in individual patients as the count returns to normal levels, reflecting the changes in T-cell repertoire. (G) In 2 patients with chronic ITP, individual clones were followed-up for over a number of years (point 0 is the first time that TCR is measured) and compared with the overall T-cell diversity and the platelet count. TCR diversity falls with the platelet count and increases as it recovers. Correspondingly, the individual clones expand as the platelet count decreases and contract as the platelet count increases. ∗P ≤ .05; ∗∗P ≤ .01; ∗∗∗P ≤ .001; ∗∗∗∗P ≤ .0001.
We found no evidence for viral-driven clonal expansion: all patients tested negative for known viral causes of ITP (HIV and hepatitis B and C), and 97% (791 of 815) of the top 10 clones from each patient were private clones (unique to individual patients) with no known viral, bacterial, autoimmune, or tumor antigen specificities when mapped to available databases of TCR sequences.38
Patients with ITP showed no overrepresentation of any Vβ family or any shared clones across patients; the average CMH value was 0.0005, indicating that patients with ITP had ∼0.05% similarity in their TCR repertoire compared with 0.1% similarity found among controls. When we compared the top 10 clones across all patients with ITP, there were neither any shared T-cell clones across patients nor any CDR3 motif enrichment in the expanded clones of patients, indicating that expanded T-cell clones are not driven by the same antigenic exposure.
Patients with refractory disease (chronic ITP lasting >1 year and refractory to at least 2 prior treatments) had a higher number of T-cell clones occupying >5% of the T-cell repertoire when compared to nonrefractory (median of 13.8% vs 4.9%, P ≤ .05; Figure 2D). In 1 patient with refractory ITP (Patient 1), an individual T-cell clone occupied >30% of the T-cell repertoire (Figure 2G,I).
Longitudinal samples were analyzed in 9 patients. Paired analysis of T-cell clones when platelet counts were <30 × 109/L compared with platelet counts ≥30 × 109/L showed expanded clones and reduced T-cell repertoire diversity when the platelet count was lower (P ≤ .01, Figure 2E; P ≤ .001, Figure 2F).
In 2 patients with chronic ITP who were followed-up with longitudinal sampling (Patients 1 and 2), expanded clones persisted over several years. In these patients, TCR clonality was inversely correlated with the platelet count (P ≤ .05; r = 0.56; Figure 2G).
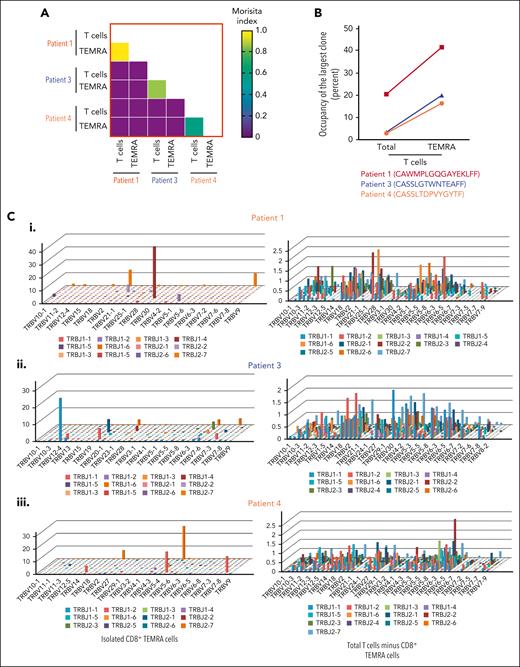
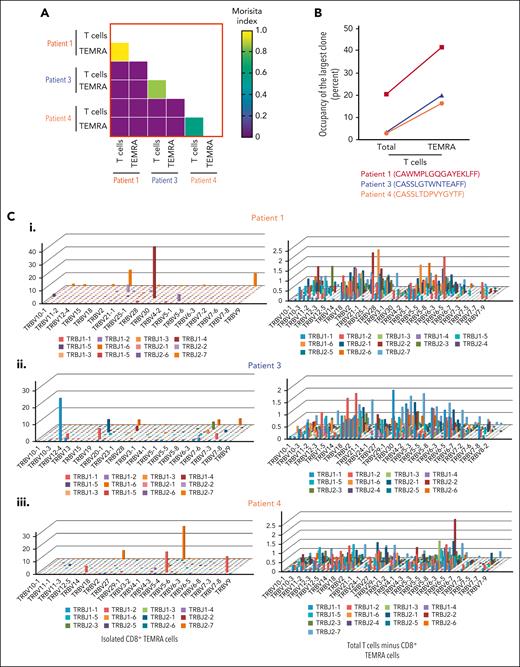
Using CMH, we found a great overlap between clones in isolated CD8+ TEMRA cells and the whole T-cell compartment (Figure 3A). For example, the top 3 expanded clones in the T-cell compartment were also the dominant clones in the CD8+ TEMRA cell compartment (Figure 3B). By comparing the distribution of TRB variable (TRBV) and joining (TRBJ) usage in the TEMRA compartment with the remaining T cells, we show that TEMRA cells of patients are dominated by high abundance TRBV/TRBJ gene rearrangements (highest TRB clonotype frequency at 41.7%, 25.2%, and 26.1%, in patients 1, 3, and 4, respectively). In contrast, the remaining T-cell subsets (CD4+ and the rest of the CD8+ T-cell compartment) showed polyclonal distribution of TRBV and TRBJ rearrangements, with no predominant clones (Figure 3C).
Expanded unique T-cell clones originate in the TEMRA compartment. (A) CMH, ranging from 0 (the samples are entirely different) to 1 (the samples are identical), shows the overlap between clones detected in the overall T cells and clones detected in the TEMRA cells from the same patients. The mean CMH value of the TCR repertoires was >0.4 between T-cell and TEMRA cell compartments. In comparison, there was no overlap between patients. (B) Percentage space occupied by the largest clonotype among T-cell and TEMRA compartment in 3 patients with ITP. (C) 3D-plot visualization of the composite TRBV and TRBJ repertoire of the TEMRA compartment compared with non-TEMRA CD8+ T cells and CD4+ cells combined.
Expanded unique T-cell clones originate in the TEMRA compartment. (A) CMH, ranging from 0 (the samples are entirely different) to 1 (the samples are identical), shows the overlap between clones detected in the overall T cells and clones detected in the TEMRA cells from the same patients. The mean CMH value of the TCR repertoires was >0.4 between T-cell and TEMRA cell compartments. In comparison, there was no overlap between patients. (B) Percentage space occupied by the largest clonotype among T-cell and TEMRA compartment in 3 patients with ITP. (C) 3D-plot visualization of the composite TRBV and TRBJ repertoire of the TEMRA compartment compared with non-TEMRA CD8+ T cells and CD4+ cells combined.
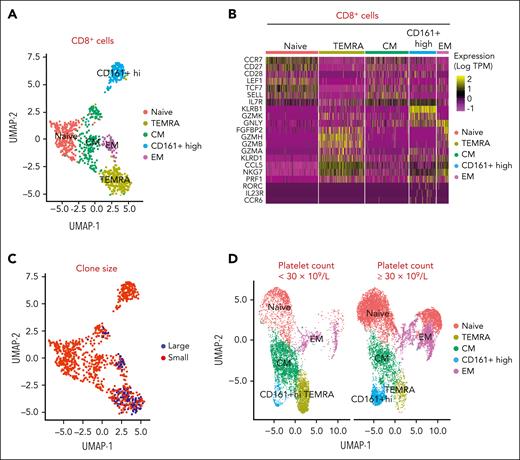
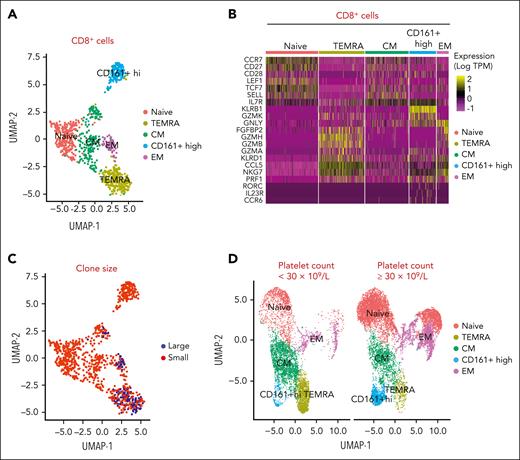
To determine the nature of the expanded clones, we combined single-cell RNA and TCR sequencing in whole CD8+ T cells isolated from patients with ITP and expanded T-cell clones. Based on their signature genes, we identified 5 distinct clusters in CD8+ T cells from patients with ITP: naïve, TEMRA, central memory, effector memory, and CD161+-high cells (Figures 4A-B). By mapping CD8+ TCR sequencing to gene expression, we found that the largest unique clones showed an aggregative distribution and mostly comprised the TEMRA subtype (Figure 4C). Expanded TEMRA cell clones were more prominent in a patient with a platelet count of <30 × 109/L compared with a platelet count ≥30 × 109/L (Figure 4D). The cytotoxic features of the clonally expanded cells, both via flow and by single-cell analysis, indicate their potential for killing.
Combined single-cell RNA and TCR sequencing defines expanded clones as TEMRA cells. (A) Sorted CD8+ T cells are clustered using their gene expression profile into naïve, TEMRA, central memory (CM), effector memory (EM), and CD161+ high cells. (B) Heatmap of genes in sorted CD8+ T cells differentially expressed in accordance with clusters, including naïve, TEMRA, CM, EM, and CD161+ high cells. (C) Large clones (top 10 clones) are predominantly within the TEMRA subset, shown in red. (D) Patients with a platelet count <30 × 109/L have more TEMRA T cells compared with patients with a platelet count ≥30 × 109/L.
Combined single-cell RNA and TCR sequencing defines expanded clones as TEMRA cells. (A) Sorted CD8+ T cells are clustered using their gene expression profile into naïve, TEMRA, central memory (CM), effector memory (EM), and CD161+ high cells. (B) Heatmap of genes in sorted CD8+ T cells differentially expressed in accordance with clusters, including naïve, TEMRA, CM, EM, and CD161+ high cells. (C) Large clones (top 10 clones) are predominantly within the TEMRA subset, shown in red. (D) Patients with a platelet count <30 × 109/L have more TEMRA T cells compared with patients with a platelet count ≥30 × 109/L.
To explore whether these TEMRA cells from the patients with refractory ITP and expanded T-cell clones could interact with platelets and cause thrombocytopenia, we set up a series of coculture experiments.
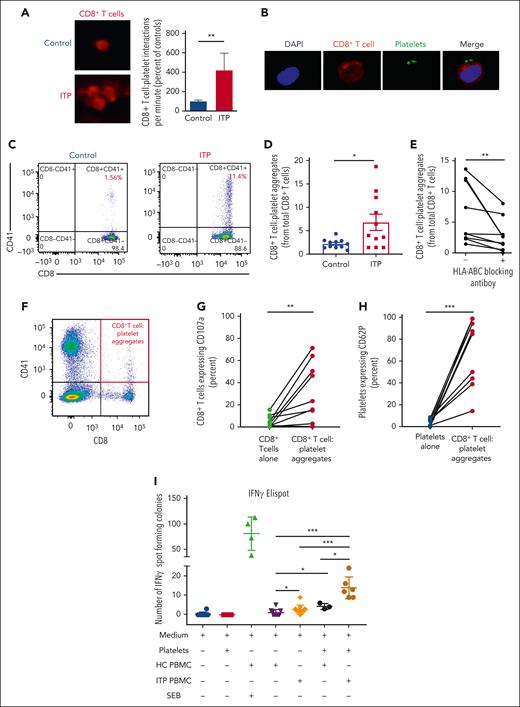
Firstly, we simulated a blood vessel by perfusing PBMCs stained with anti-CD8 antibody at a shear rate of 50 s-1 (equivalent to that observed in venous blood flow) through microfluidic channels, onto which a monolayer of autologous platelets had been captured via VWF.31 Sustained interactions between CD8+ T cells and platelets occurred 4× more frequently in blood from patients with refractory ITP than in blood from controls (P ≤ .01) and occasionally formed aggregates of CD8+ T cells (Figure 5A; supplemental Video).
CD8+ T cells interact with platelets causing T-cell activation, IFN-γ release, and CD107a and platelet activation. CD8+ T-cell–platelet aggregates are inhibited with MHC class I blocking on platelets. (A) When CD8+ T cells flow along a chamber coated with platelets, CD8+ T cells from patients with ITP were 4 times more likely to slow down and stop along the platelet coated surface than controls. (B) Confocal imaging of CD8+ T-cell interactions with platelets in a patient with ITP (×20 lens objective). (C) Example of a dot plot from flow cytometry analysis of a control vs patient with ITP when CD8+ T cells are cocultured with platelets, showing CD8+ T-cell–platelet aggregates (CD8+CD41+) from total CD8+ T cells. (D) CD8+ T-cell–platelet aggregates are higher in patients with ITP than in healthy controls and (E) are inhibited when MHC class I HLA-A, -B, and -C receptors on platelets are blocked. (F) In CD8+ T-cell–platelet coculture, (G) CD107a is increased in the CD8+ T-cell–platelet aggregates compared with CD8+ T cells cultured alone, consistent with release of granzyme B; (H) platelets in the CD8+ T-cell–platelet aggregates show increased CD62P, consistent with platelet activation. (I) IFN-γ ELISpot assay of T cells cultured with autologous platelets shows that T cells from patients with ITP have increased secretion of IFN-γ when cultured with platelets (detected by IFN-γ–forming spots). ∗P ≤ .05; ∗∗P ≤ .01; ∗∗∗P ≤ .001. HC, healthy control; SEB, staphylococcal enterotoxin.
CD8+ T cells interact with platelets causing T-cell activation, IFN-γ release, and CD107a and platelet activation. CD8+ T-cell–platelet aggregates are inhibited with MHC class I blocking on platelets. (A) When CD8+ T cells flow along a chamber coated with platelets, CD8+ T cells from patients with ITP were 4 times more likely to slow down and stop along the platelet coated surface than controls. (B) Confocal imaging of CD8+ T-cell interactions with platelets in a patient with ITP (×20 lens objective). (C) Example of a dot plot from flow cytometry analysis of a control vs patient with ITP when CD8+ T cells are cocultured with platelets, showing CD8+ T-cell–platelet aggregates (CD8+CD41+) from total CD8+ T cells. (D) CD8+ T-cell–platelet aggregates are higher in patients with ITP than in healthy controls and (E) are inhibited when MHC class I HLA-A, -B, and -C receptors on platelets are blocked. (F) In CD8+ T-cell–platelet coculture, (G) CD107a is increased in the CD8+ T-cell–platelet aggregates compared with CD8+ T cells cultured alone, consistent with release of granzyme B; (H) platelets in the CD8+ T-cell–platelet aggregates show increased CD62P, consistent with platelet activation. (I) IFN-γ ELISpot assay of T cells cultured with autologous platelets shows that T cells from patients with ITP have increased secretion of IFN-γ when cultured with platelets (detected by IFN-γ–forming spots). ∗P ≤ .05; ∗∗P ≤ .01; ∗∗∗P ≤ .001. HC, healthy control; SEB, staphylococcal enterotoxin.
To determine whether CD8+ T-cell–platelet interaction could kill platelets, we cultured isolated CD8+ T cells with autologous platelets overnight. Confocal imaging confirmed stable CD8+ T-cell–platelet aggregates in a patient with ITP (Figure 5B). CD8+ T-cell–platelet aggregates (CD8+CD41+) were more frequent in the cocultures from patients than from controls (P ≤ .05; Figures 5C-D) and were partially inhibited by blocking MHC class I (HLA-A, -B, and -C) on platelets before coculture (P ≤ .01; Figure 5E), indicating that these interactions were TCR mediated. CD107a expression was significantly higher in CD8+ T-cell–platelet aggregates in cocultures than in CD8+ T cells cultured alone. CD107a is expressed on both activated platelets and CD8+ T cells. Within CD8+ T cells, the expression of CD107a colocalizes with the expression of granzyme B (supplemental Figure 2), indicating cytolytic activity and release of granzyme and perforin (P ≤ .01; Figures 5F-G). Platelets in the aggregates showed increased CD62P expression (P ≤ .001; Figure 5H), together with annexin V expression (supplemental Figure 3), consistent with platelet activation and apoptosis.39,40 In controls, the CD8+ T-cell–platelet interactions resulted in very minimal increase in CD62P or CD107a expression (supplemental Figure 4).
To confirm platelet specificity, we cultured PBMCs and autologous platelets in an IFN-γ ELISpot assay. PBMCs from patients with ITP showed more spot-forming colonies compared with PBMCs from controls when cultured with autologous platelets (12.50 vs 4; P ≤ .05; Figure 5I; supplemental Figure 5).
Discussion
Using a number of orthogonal approaches, we have described expanded terminally differentiated effector CD8+ (TEMRA) T-cell clones in patients with ITP. These TEMRA cells are polyfunctional, primed for killing, and demonstrate no features of exhaustion. Although polyfunctional TEMRA cells are usually described in the context of viral or vaccine responses,41,42 there was no evidence of infection in our cohort. By deep sequencing the TCR, we identified long-lived expanded T-cell clones, which were more expanded in patients with refractory ITP than in those with nonrefractory ITP, and varied in frequency with disease state, supporting a causal role in the pathobiology of ITP. Unlike other autoimmune conditions, such as diabetes and multiple sclerosis,43,44 there was no TCR sharing between individuals with ITP, which could be because of the heterogeneity of MHC class I molecules and/or platelet epitopes involved across our patient cohort.
Using a model of venous blood flow and ex vivo coculture experiments, we show that CD8+ T cells from patients with chronic ITP (and refractory to at least 2 prior treatments) directly interact with autologous platelets forming aggregates. The expression of CD107a and granzyme B as well as CD62P and annexin V within aggregates indicates degranulation of cytotoxic granules from CD8+ T cells and platelet activation and apoptosis.39,40 These features, together with the increased secretion of IFN-γ by T cells from patients with ITP when cultured with platelets and the inhibition of aggregates through MHC class I blockade, all support TCR-mediated autoimmune platelet destruction by activated clonal CD8+ T cells.
Platelets and megakaryocytes express T-cell costimulatory molecules, enabling them to activate T cells in a platelet MHC class I–dependent manner.45,46 Megakaryocytes have been shown to be potent antigen-presenting cells,47,48 and platelet interactions with CD8+ T cells have been described in the context of blood transfusions and infections.49,50 These interactions are thought to provide a protective role regulating CD8+ T cells during sepsis.49 We also observed transient interactions between platelets and CD8+ T cells in blood from healthy controls, consistent with these previous reports.50-52 In contrast to the interactions we see in ITP, we found very little activation of platelets during interactions with healthy control CD8+ T cells.
Platelet lysis by CD8+ T cells in ITP was first suggested in studies measuring the lysate from cocultures of indium-labeled platelets added to CD8+ T cells in vitro.21,25 Later, mouse models of ITP, using lymphocyte transfer experiments and a mixture of depletion studies, inferred CD8+ T cells mediated thrombocytopenia in vivo.22 However, the direct effect of these cells on platelets in patients with ITP remained uncertain.
Our study, to the best of our knowledge, is the first to identify individual disease-associated T-cell clones and culture isolated CD8+ T cells from patients with ITP with autologous platelets without artificially stimulating the CD8+ T cells, demonstrating CD8+ T-cell–mediated platelet activation and apoptosis. Further work is needed to understand the dynamics of these interactions in vivo and explore the role of autoreactive T cells in other thrombocytopenic disorders.
Our findings provide novel and critical insights into the pathophysiology of ITP. Current T-cell therapies, such as azathioprine, mycophenolate, and cyclosporin show efficacy in ITP6 but they are often poorly tolerated and may be inadequate in patients who have refractory ITP with highly expanded T-cell clones. Deciding on treatment escalation in patients with refractory ITP remains challenging. Although our study was not designed to evaluate TCR as a biomarker, it is tempting to speculate that the persistence of expanded T-cell clones highlights a possible target in patients refractory to current therapies and could lead to more directed and more effective treatments.
Acknowledgments
The authors thank Akram Dweikat and Barah Daghistani for their technical support provision; Deena Paul, Camelia Vladescu, and the patients for their ongoing support of the research; Xiaoqing You for her help with bioinformatic analysis of data; and LMS/NIHR Imperial Biomedical Research Centre flow cytometry facility.
This study was supported by grants from the JP Moulton Charitable Foundation (N.C., A.M.), Rosetrees Trust (N.C.), National Institutes of Health, National Cancer Institute (grant 2PO 1CA49605 [B.M.Z.]), and Taibah University (A.A.S.), and carried out at the National Institute for Health and Care Research (NIHR) Imperial College Biomedical Research Centre (BRC) and Stanford Medical School. A.A.S. was funded by Taibah University Scholarship program. This study was performed with support from the Imperial College NIHR BRC Imaging and FACS Facility and the Imperial College NIHR BRC funded Tissue Bank (Imperial College Healthcare NHS Trust in partnership with Imperial College London).
Authorship
Contribution: A.M., A.A.S., N.C., and B.M.Z. designed the study, interpreted data, and wrote the paper; A.M., A.A.S., P.H., M.M.H.T., R.C.S., E.W., Y.D., A.C.-B., A.T.H.C., W.A.M., A.K., H.Z., J.T.B.C., I.I.S.-C., and S.A. performed experiments; E.T., A.T., and A.C.J.H. collated clinical metadata and isolated PBMCs; J.B.B., J.L.Z., N.I., and J.T.B.C. interpreted data and wrote the paper; and all authors edited and approved the paper for submission.
Conflict-of-interest disclosure: The authors declare no competing financial interests.
Correspondence: Nichola Cooper, Centre for Haematology, Department of Haematology Hammersmith Hospital, Imperial College London, London W12 0HS United Kingdom; e-mail: n.cooper@imperial.ac.uk; and Bing M. Zhang, Department of Pathology, Stanford University School of Medicine, Stanford, CA 94305; e-mail: mbzhang@stanford.edu.
References
Author notes
∗A.M., A.A.S., and P.H. contributed equally to this study.
†B.M.Z. and N.C. contributed equally to this study.
The raw FastQ files are deposited in the Short Read Archive (accession number PRJNA930724).
Data are available on request from the corresponding authors, Nichola Cooper (n.cooper@imperial.ac.uk) and Bing M. Zhang (mbzhang@stanford.edu).
The online version of this article contains a data supplement.
There is a Blood Commentary on this article in this issue.
The publication costs of this article were defrayed in part by page charge payment. Therefore, and solely to indicate this fact, this article is hereby marked “advertisement” in accordance with 18 USC section 1734.

