Abstract
Ploidy could be the key to understanding megakaryocyte (MK) biology and platelet production. Human CD34+ cells purified from umbilical cord blood (CB) and peripheral blood (PB) were investigated on their capability to give rise, in a serum-free medium containing thrombopoietin, to MKs and platelets. CB-MKs showed reduced polyploidization and platelet number compared with PB-MKs, but a similar membrane phenotype. Most CB-MKs showed a 2N content of DNA (∼80%) and only 2.6% had 8N, whereas 40% of the PB cells had 8N or more. Platelets were substantially released in PB culture from day 12; at day 14 the CB-derived MKs were able to release platelets although at a reduced level (∼35%), correlating with their reduced size. A direct correlation was demonstrated by sorting polyploid cells from PB-MKs and evaluating the platelets released in the supernatant. Furthermore, the study analyzed the expression and distribution of cyclin D3 and cyclin B1. Cyclin D3 protein was increased in PB in comparison to CB-MKs; in PB culture most cells rapidly became positive, whereas in CB-derived cells cyclin D3 expression was evident only from day 9 and in a reduced percentage. Cyclin B1 was essentially localized at the nuclear level in the CB and was expressed during the whole culture. In PB-MKs, at day 9, a reduction was observed, correlating with an advanced ploidy state. The data indicate the inability of the CB-MKs to progress in the endomitotic process and a direct correlation between DNA content and platelet production.
Introduction
The main feature of megakaryocyte (MK) maturation is the development of a single, large, lobulated, polyploid nucleus; the mature MKs cease to proliferate but continue to increase their DNA content without undergoing late stages of mitosis.1-4Increase in megakaryocytic ploidy is associated with increase in megakaryocytic volume; the large size and abundant cytoplasm allow MKs to produce several thousand platelets per cell.3 It was presumed that higher-ploidy cells could produce more platelets than lower-ploidy cells or that production and release is more efficient from a single large cell than from several smaller ones, but none of these suppositions has been proven.5 Peripheral blood (PB)–mobilized CD34+ cells induced to differentiate into megakaryocytic lineage gave rise to 3-fold augmentation of platelets compared with bone marrow (BM) CD34+ cells, although the proportion of proplatelet-displaying MKs were similar.6Choi et al7 reported the functionality of the platelets released in vitro from CD34+ cells derived from PB stimulated to form MKs.
The generation of large numbers of megakaryocytes became possible by the identification and cloning of thrombopoietin (TPO), the key regulatory cytokine of megakaryocytopoiesis.8-11 Then several culture systems have been developed permitting all stages of megakaryocytopoiesis until platelet formation.6,12-15 TPO was shown to induce endomitosis and consequently to increase the polyploidy state of MKs in a significant measure in comparison to all the other cytokines affecting megakaryocytopoiesis.16,17However, the observed MK polyploidization level was shown to depend on the origin of the progenitors and presumably from their maturative profile6; in particular cord blood (CB) CD34+cells induced to differentiate into the MK lineage gave rise to lower-ploidy MKs,18 compared with BM- and PB-derived cells.12 13
Among the transcription factors implicated in megakaryocytopoiesis, GATA-1 and NF-E2 stand out for the nonredundant and essential roles they play in the megakaryopoietic process. GATA-1 null mice have marked thrombocytopenia, deregulated megakaryocyte proliferation, and deficient cytoplasmic maturation.19 Mice lacking NF-E2 have a high mortality from bleeding secondary to profound thrombocytopenia and show a relative megakaryocytic hyperplasia associated with a cytoplasmic maturational arrest and lack of granules.20
Several studies have been performed to identify the elements that control polyploidization; examination of the cyclin machinery has shown that cyclin D3 (Cyc D3) is expressed in primary megakaryocytes and is up-regulated by TPO.21 Overexpression of cyclin D3 in MKs of transgenic mice resulted in an increase in ploidy, commensurate with that observed in in vivo treatment with TPO.22 The switch to polyploidization in a temperature-sensitive megakaryocytic cell line (Meg T) was suggested to depend on the reduction in the activity of cyclin B1–dependent Cdc2 kinase associated with reduced levels of cyclin B1.23 It was suggested that ubiquitin-dependent degradation of cyclin B was accelerated in polyploid MKs.24 In 2 other cell lines (Meg 01 and HEL), an association was found between polyploidy and down-regulation of Cdc2 activity, but with high levels of cyclin B and Cdc2 proteins.25 In contrast, studies indicated that human polyploid MKs, derived from CD34+ cells induced to differentiate in vitro, showed a functional mitotic checkpoint with normally degraded cyclin B1 at anaphase.26-28 A recent work on primary murine MKs demonstrated that the expression of cyclin B1 oscillated normally with cell-cycle phase and the level per G2/M MK increased with ploidy.29
We used CD34+ progenitor cells, purified from human PB and CB, induced to differentiate into the megakaryocytic lineage in the presence of TPO alone to evaluate the differences in the MK differentiation/maturation process, including the polyploidization state and platelet release.
Materials and methods
Human progenitor cell purification
The current study was approved by the Institutional Review Board of the Istituto Superiore di Sanità. CB was obtained from the placenta of full-term newborns by puncture of the umbilical vein and gravity drainage of the transacted cord, after informed consent provided according to the Declaration of Helsinki. Blood was collected in tubes containing 5 mL Ca2+- and Mg2+-free phosphate-buffered saline (PBS; Euroclone, West York, United Kingdom) supplemented with 2 mM Na2-EDTA and 200 U/mL heparin and was treated within 12 hours after collection. PB buffy-coat was obtained from 20- to 40-year-old healthy donors after informed consent. Whole CB or PB buffy-coat was diluted with PBS/EDTA. Mononuclear cells were obtained by Lympholyte L (Cedarlane, Hornby, ON, Canada) density gradient separation. CD34+ progenitor cells were purified by using a magnetic cell-sorting system (CD34+ multi-MACS; Miltenyi Biotec GmbH, Bergisch Gladbach, Germany) in accordance with the manufacturer's recommendations.
MK cultures
Purified cells were seeded (4 × 10⁴ cells/mL) and grown in serum-free liquid suspension culture13 with saturating doses of TPO (100 ng/mL, specific activity 106U/mg; Pepro Tech EC, London, United Kingdom). Cells were incubated at 37°C in a fully humidified atmosphere of 5% CO2. The cells were counted and cell viability was evaluated by Trypan Blue staining exclusion. The concentration was adjusted to 1 × 10⁵ cells/mL twice a week, and fresh TPO was added.
MK clonogenetic assay was performed as previously described.28 Briefly, CD34+ cells (1 × 10³ cell/mL/dish) were seeded in duplicate in 0.9% methylcellulose containing TPO (50 ng/mL) in serum-free condition and incubated for 12 to 21 days at 37°C in a fully humidified atmosphere of 5% CO2. The cells were harvested from the plate, enumerated, labeled with the use of anti-CD61 monoclonal antibody (MoAb), and analyzed by flow cytometry.
MK characterization
Morphologic analysis.
Cells collected at different days of culture were cytocentrifuged onto glass slides, stained with May-Grünwald Giemsa (Sigma, St Louis, MO), and then observed by light microscopy.
Flow cytometric analysis.
Flow cytometric analysis was performed on FACScan (Becton Dickinson [BD], San Jose, CA) at excitation wavelength of 488 nm. The fluorescence emission for fluorescein isothiocyanate (FITC) and phycoerythrin (PE) was detected through 530-nm and 575-nm band pass filters, respectively. The data acquisition and analysis were performed on Lysis II software (BD). Anti-CD61 (BD) directly conjugated with FITC and anti-CD34, -CD62 (BD), -CD41a, and -CD42b (Immunotech, Marseille, France) conjugated with PE were used to characterize the membrane phenotype of cell samples. Cells were washed twice in PBS supplemented with bovine serum albumin (BSA) 0.1% (Sigma) and then incubated for 45 minutes at 4°C with appropriate amounts of specific MoAbs. After washing with PBS/BSA, cells were resuspended in 0.2 mL PBS and analyzed by flow cytometric analysis.30
Cell sorting of polyploid PB-MKs.
The cells, previously analyzed for their DNA content, were sorted at day 8, according to their size, using a FACS Vantage cytometer (BD). The sorting gate, including approximately 10% of the cells was determined on the basis of side scatter (SSC) versus forward scatter (FSC) properties. The quality of the sorted cells was confirmed by morphologic analysis after Wright-Giemsa staining.
MK ploidy.
MK ploidy was measured by a double-staining technique and flow cytometry, according to a modified procedure of the Cycle Test Plus Kit (BD). Briefly, cultured cells were washed 3 times in PBS/BSA 0.1%, resuspended in 40 μL PBS/BSA 0.1%, and incubated with anti-CD61 for 45 minutes at 4°C. After incubation the cells were permeabilized by gradual addition of iced absolute methanol, incubated for 5 minutes on ice, and then treated with a trypsin inhibitor/RNase buffer. After 10 minutes, 40 μg/mL propidium iodide was added to each sample, and the cells were incubated for 10 minutes in the dark on ice. Cells expressing CD61 were regarded as MKs. CD61+ cells were gated and analyzed for ploidy. To determine the mean channel of the 2N peak a sample of lymphocytes was used.
Indirect immunofluorescence.
Cells cytocentrifuged onto glass slides were fixed in absolute methanol for 5 minutes and in cold acetone for 2 minutes, then washed with PBS at room temperature (RT) for 10 minutes. The cells were stained at RT for 45 minutes with the following polyclonal primary antibodies: rat polyclonal immunoglobulin (Ig)G anti–GATA-1, rabbit polyclonal IgG anti–NF-E2, goat polyclonal IgG anti–cyclin D3, rabbit polyclonal IgG anti–cyclin B1 (Santa Cruz Biotechnology, Santa Cruz, CA), rabbit polyclonal IgG anti–phospho-histone H1 and H3 (H1 + H3) (Upstate Biotechnology, Lake Placid, NY)31 32 alone or in combination with an anti–cyclin B1 MoAb (Santa Cruz Biotechnology). After rinsing 2 times with PBS, the appropriate secondary antibody was applied at RT for 30 minutes. Cells were again washed and mounted in 50% glycerol/PBS and analyzed by confocal laser fluorescence microscopy (TCS 4D; Leica, Nussloch, Germany).
Platelet analysis
Culture-derived platelets were enumerated as CD61+events with the same scatter properties as blood platelets. The acquisition rate was 1 μL/sec for 100 seconds. Cultured cells were stimulated at 37°C with human thrombin for 15 minutes (2 U/mL; Ortho Q.F.A. Thrombin; Ortho Diagnostic Systems, Raritan, NJ). Cells were then fixed with an equal volume of 0.5% paraformaldehyde for 1 hour. Control cells were fixed in the same manner without prior activation. Platelets were then isolated from culture supernatants by centrifugation at 120g for 10 minutes, pelleted at 1000g for 10 minutes, suspended in 100 μL PBS/BSA, and incubated with both PE anti-CD62 and FITC anti-CD61 for 45 minutes. All the procedures were performed at RT. After incubation the samples were washed with PBS, diluted to the same volume (100 μL), and analyzed by flow cytometry. Events (1 × 10⁴) per sample were collected by using an analytical gate according to scatter properties of normal blood platelets treated similarly using a log scale for FSC and SSC.33
Reverse transcriptase–polymerase chain reaction analysis
Total RNA extracted by the guanidium isothyocyanate-CsCl method34 from 1 to 3 × 10⁵ cells in the presence of 12 μg Escherichia coli rRNA was quantitated by dot hybridization with a human rRNA probe.35 After densitometric analysis, the same amount of RNA (∼200 ng) was reverse-transcribed (Moloney murine leukemia virus-RT; BRL, Gaithersburg, MD) with oligo-dT (BRL) as primer. Complementary DNAs were equalized by reverse transcriptase–polymerase chain reaction (RT-PCR) by using primers for S26 ribosomal protein. Amplification of approximately 5 ng RT-RNA within the linear range was achieved by 20 PCR cycles (ie, this cycle number allowed a linear RT-RNA dose response). The amplification procedure involved denaturation at 95°C for 45 seconds, annealing for 45 seconds, and extension at 72°C for 45 seconds. The following describes primers, probes, annealing temperature, PCR cycle number used, and PCR product length obtained: S26, forward 5′-GCCTCCAAGATGACAAAG-3′, reverse 5′-CCAGAGAATAGCCTGTCT-3′, and probe 5′-GAGCGTCTTCGATGCCTATGTGCTTCCCAA-3′ (56°C, 20 cycles, 398 base pair [bp]); NF-E2, forward 5′-CTACTCACTCATGCCCAA-3′, reverse 5′-GGTGCTGGAAAATGTCA-3′, and probe 5′-GCTATTGGCAAGGTACCCGCTGA-3′ (56°C, 22 cycles, 467 bp); GATA-1, forward 5′-CTCCCTGTCCCCAATAGTGC-3′, reverse 5′-GTCCTTCGGCTGCTCCTGTG-3′, and probe 5′-TCAGTAAACGGGCAGGTACTCAGTGCACCA-3′ (60°C, 26 cycles, 525 bp); glycoprotein Ibα (GpIbα), forward 5′-AAGCTGGAGAAGCTCAGTCTG-3′, reverse 5′-CTCCTTAGTGGATTCTTGTGTTGG-3′, and probe 5′-CTGCAGGACAATGCTGAAAATGTCT-3′ (56°C, 26 cycles, 560 bp); GpIIIa, forward 5′-ACTTTGGCAAGATCACGGG-3′, reverse 5′-CGGTTGCAGGTATTTTCGTC-3′, and probe 5′-GCTCCTATGGGGACACCTGTGAGAA-3′ (54°C, 26 cycles, 364 bp).
PCR was performed in a total volume of 50 μL, using Taq-Gold polymerase (Perkin-Elmer, by Roche Molecular System, NJ) according to manufacturer's instructions; 10 μL of each sample was separated in a 2% agarose gel (BRL) and transferred to a nitrocellulose filter (Schleicher and Schuell, Dassel, Germany). Filters were hybridized with a specific probe, labeled with γ32P-ATP using a polynucleotide-kinase (TAKARA Shuzo, Japan). A mock reaction was used for each RT-PCR experiment. Semiquantitative evaluation of mRNA levels, including dose-response curves for the assayed templates and analysis of aliquots of the reactions removed at different PCR cycles (2 cycles more and 2 cycles less than the cycle number indicated earlier) was performed by densitometric analysis (Instant Imager, Packard, Canberra).
Measurements of platelet factor 4 and β thromboglobulin
Platelet factor 4 (PF4) and β thromboglobulin (βTG) were measured on supernatants of megakaryocytic cultures derived from about 104 cells at different days using a commercial EIA kit (Asserachrom, Boehringer Mannheim, Diagnostica STAGO) according to manufacturer's specifications. PF4 and βTG concentrations were expressed as international units per milliliter.
Statistics
Results of experimental points obtained from multiple experiments were reported as the mean ± SEM or SD. The significance of differences in mean value was determined by using the Student t test.
Results
MK culture: proliferation and phenotypical analysis
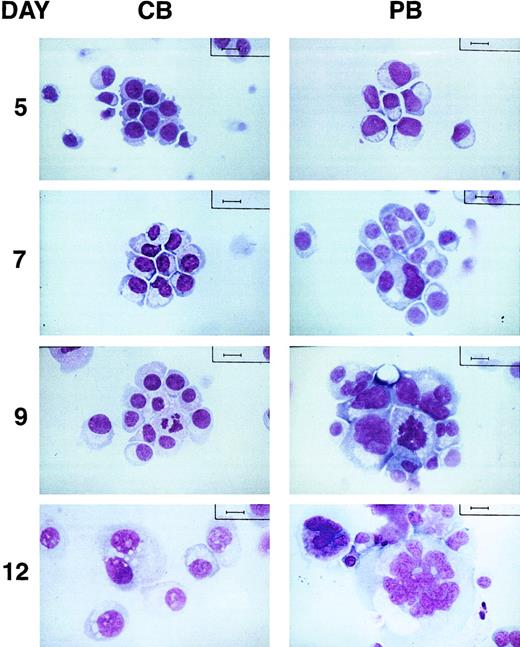
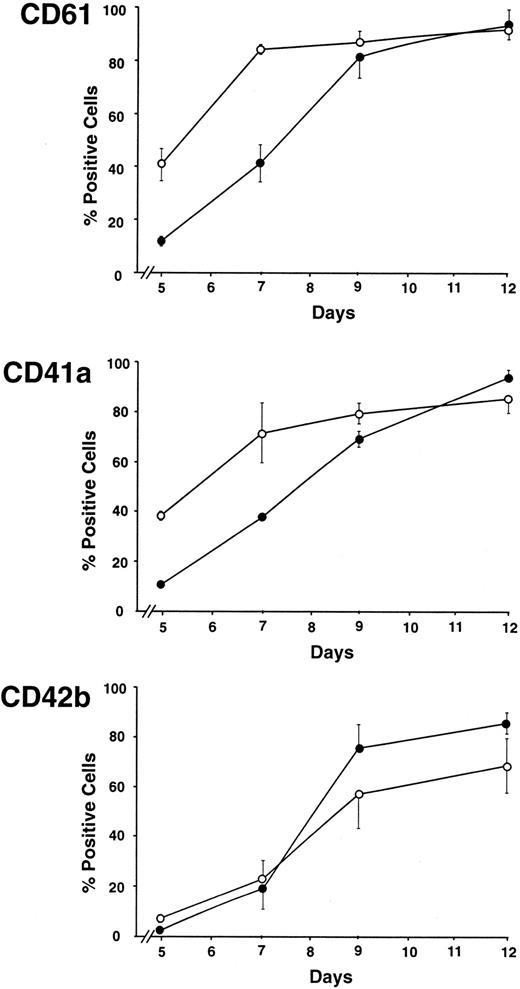
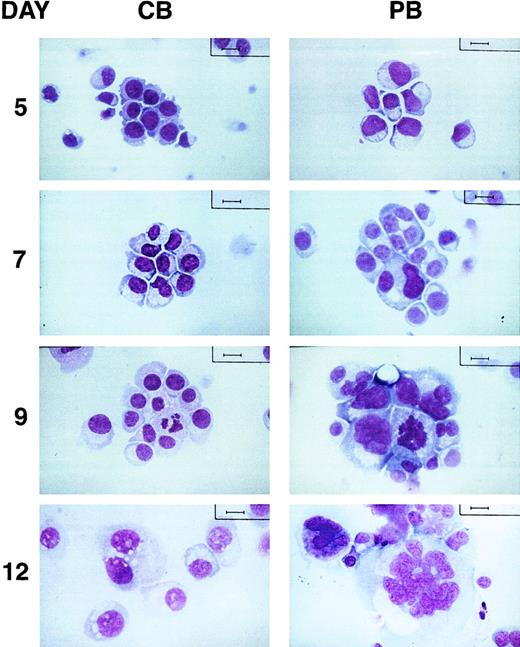
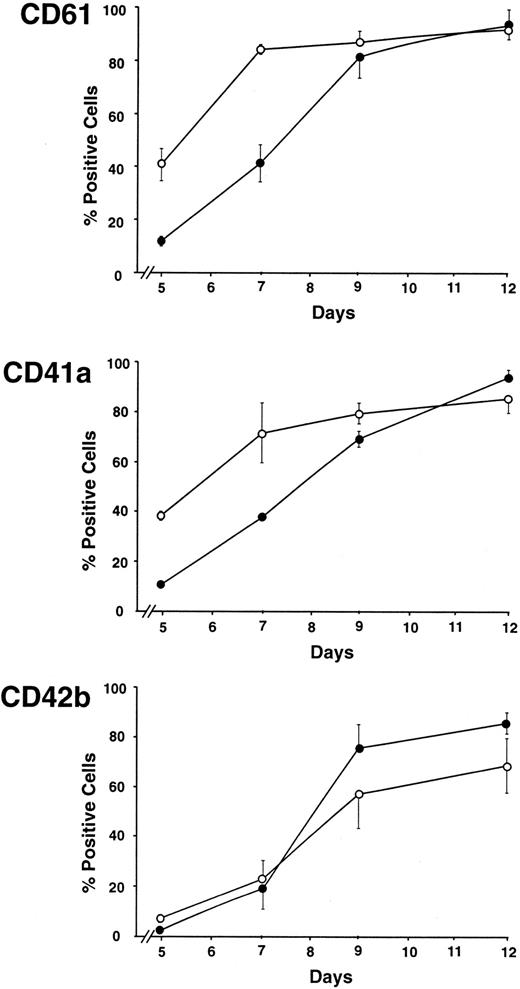
Cells purified from PB or CB were characterized as CD34+ with a positivity of 96.8% ± 2.2% and 98.1% ± 1.6% (mean ± SEM from 5 separate experiments), respectively, as evaluated by cytofluorimetric analysis. CD34+ cells generated from PB and CB, grown in liquid suspension culture in a serum-free medium in the presence of TPO (100 ng/mL), differentiated through megakaryocytic lineage, and gave rise to a virtually pure megakaryocytic population, as observed by morphologic (Figure 1) and phenotypic analyses (Figure 2). The comparative morphologic analysis (Figure 1) of PB (right panels) versus CB megakaryocytic cultured cells (left panels) showed that, at day 5, PB-derived cells were essentially mononuclear, representing MK precursors with a characteristic large oval shape with pale blue cytoplasmic ring; in contrast CB-MK precursors presented more undifferentiated features with small and heavily basophilic cytoplasm. The same morphologic aspect of the PB at day 5 was observed in CB cells between days 7 and 9, whereas at these days PB-derived MKs increased their cytoplasmic volume and showed a marked development of their polyploidization. At day 12, the CB-MKs did not show evident granulation into the cytoplasm and exhibited 2 or more nuclear lobes only in a minority of the cells. At days 18 to 21 in most of the cells the characteristic granulations became evident, but the DNA content was always low (data not shown). In contrast at day 12 PB-MKs were fully mature, showing innumerable cytoplasmic granules scattered throughout the pink cytoplasm, cytoplasmic process emanating from cell bodies similar to proplatelets, and a high proportion of 2, 4, or 8 nuclear lobes. Fluorescence studies on specific megakaryocytic membrane markers using FITC- or PE-labeled anti-CD61 (glycoprotein [GpIIIa]) and anti-CD41a (GpIIb) revealed a reduced expression in CB cells compared with PB cells at the early stage of the culture (Figure 2). Indeed at day 5, CD61 and CD41a expression was 11.9% ± 1.8% versus 40.7% ± 6.1% and 10.7% ± 1.4% versus 38.2% ± 1.8% in CB and PB cells, respectively. Generally, we observed a 2-day delay in the appearance of a comparable expression between CB- and PB-derived cells, from days 5 to 9; at day 12 the percentage of positive cells was similar in both cultures. The more maturative CD42b (GpIbα) marker was similarly expressed in both systems (Figure 2).
Morphologic differences between CB- and PB-derived megakaryocytic cells.
Morphology of MKs derived from CB- (left panels) and PB-CD34+ cells (right panels) induced to differentiate in serum-free medium in the presence of TPO (100 ng/mL) is presented. Cytospins were observed at different days by light microscopy after May-Grünwald staining. (Bar = 10 μm.)
Delay in the appearance of CD61 and CD41a expression in MKs generated from CB with respect to PB.
Comparative analysis of the megakaryocytic markers CD61, CD41a, and CD42b during MK differentiation of the CD34+ cells cultured in the presence of TPO (100 ng/mL). Cells were labeled with either PE- or FITC-conjugated MoAbs and analyzed by flow cytometry. ●, CB; ○, PB. (Mean ± SEM values from 5 experiments.)
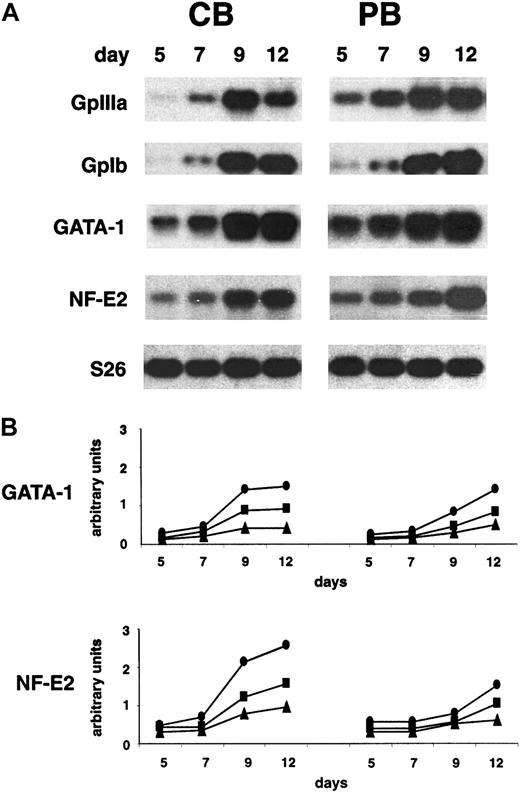
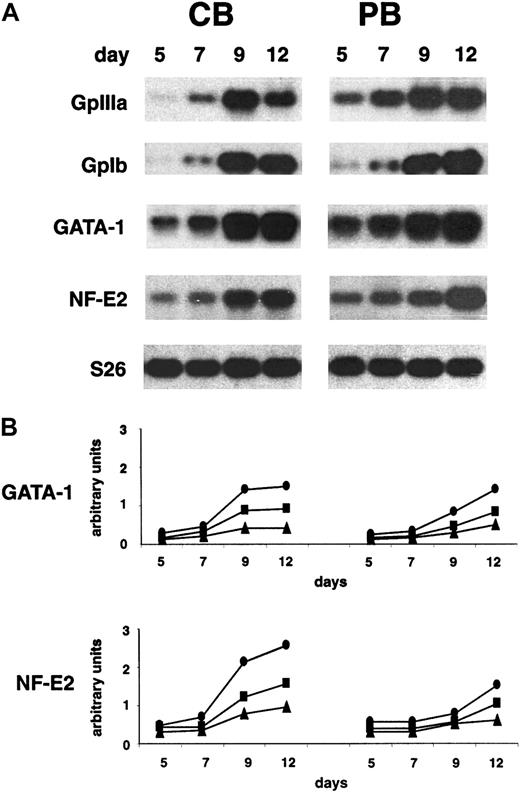
GpIIIa and GpIbα were also analyzed in megakaryocytic-differentiating cells by means of RT-PCR. Similarly to that observed at the protein level, the expression of GpIIIa mRNA increased from day 5 until the end of the culture in PB-derived MKs, whereas its expression in CB culture started at day 7 and became significantly expressed at day 9. The GpIb transcript was expressed at a similar level in both the systems with a relevant induction starting from day 9 (Figure3A).
Similar expression of NF-E2, GATA-1, and GpIbα but delay in the GpIIIa expression in MKs derived from CB compared with PB.
(A) RT-PCR analysis of GpIIIa, GpIbα, GATA-1, and NF-E2 mRNA expression during in vitro megakaryocytic differentiation of CD34+ cells generated from CB (left panels) and PB (right panels). S26 controls are presented. Representative results from 3 independent experiments are shown. (B) Densitometric analysis (Instant Imager, Packard, Canberra) of GATA-1 and NF-E2 expression normalized to the S26 controls. ●, 1:1, ▪, 1:2; ▴, 1:4 sample dilution. (See also “Materials and methods.”)
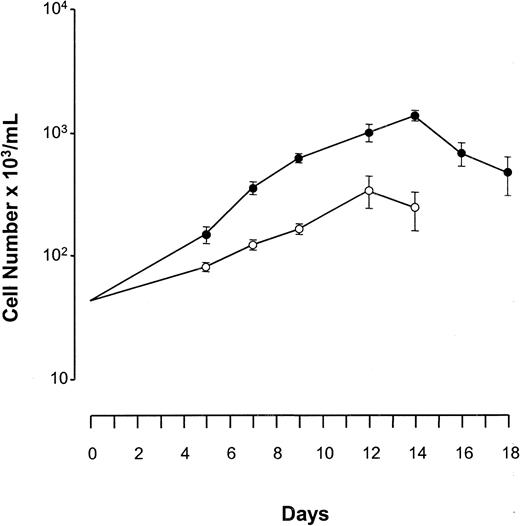
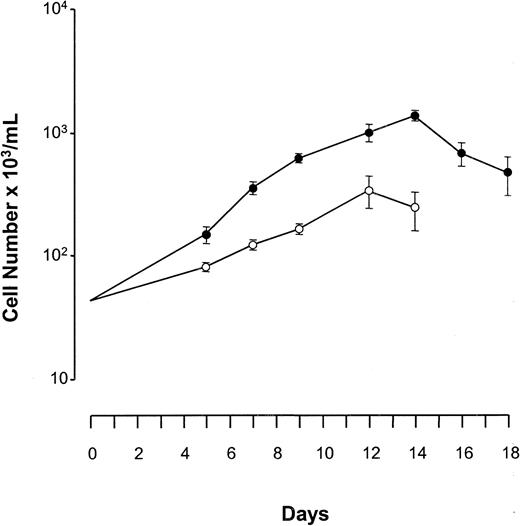
In our culture conditions proliferation of CB-CD34+cells was higher than that of PB cells, (60-fold versus 10-fold amplification of the cell number). The CB cells grew until day 14 when we observed the peak of growth and then slowly decreased until day 21, whereas PB cells proliferated until day 12 and then rapidly disappeared from the culture, having disintegrated (Figure4).
Increased proliferation of MKs derived from CB with respect to PB CD34+ cells.
Cells were grown in serum-free liquid suspension culture in presence of TPO (100 ng/mL) at 4 × 10⁴cells/mL and enumerated at different days of culture. ●, CB; ○, PB. Mean ± SEM values from 5 experiments are reported.
Increased proliferation of MKs derived from CB with respect to PB CD34+ cells.
Cells were grown in serum-free liquid suspension culture in presence of TPO (100 ng/mL) at 4 × 10⁴cells/mL and enumerated at different days of culture. ●, CB; ○, PB. Mean ± SEM values from 5 experiments are reported.
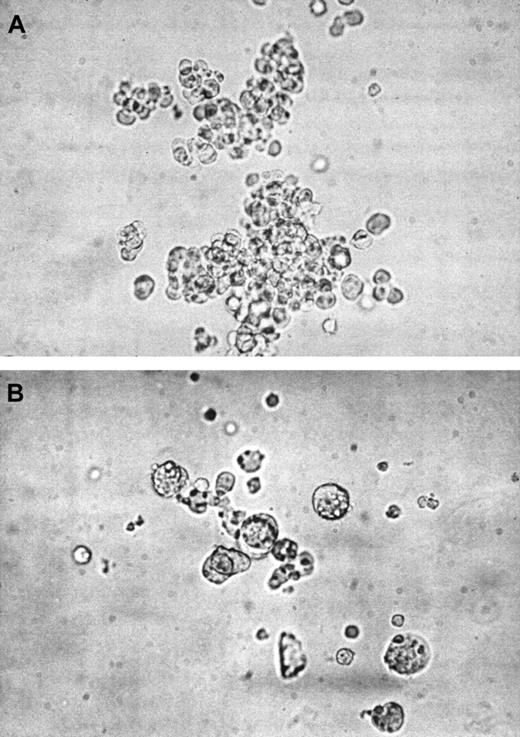
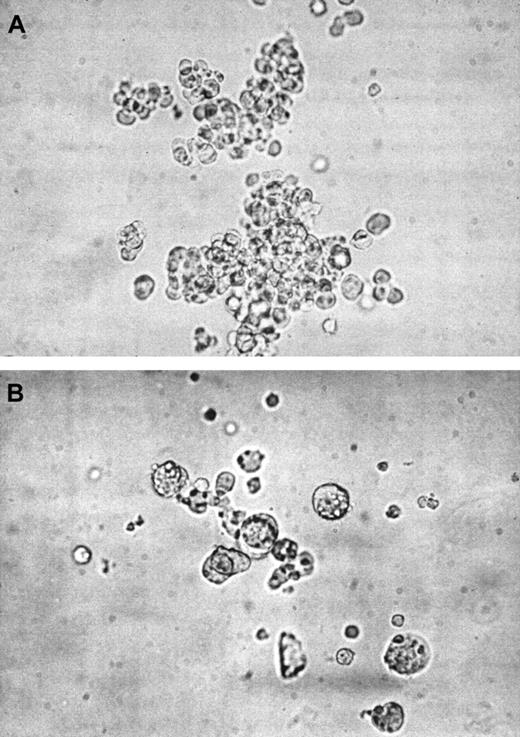
Day 0 purified progenitor cells assayed in megakaryocytic clonogenetic culture by using a serum-free medium supplemented with 50 ng/mL TPO gave rise to megakaryocytic colonies, evaluated as more than 95% CD61+ cells when individual colonies have been harvested from the plate and analyzed by FACS. The megakaryocytic clonogenetic capacity of CD34+ cells derived from CB was about 13% at days 14 to 16. A portion (27%) of these CB colonies were multifocal, constituted by numerous small cells (mean 107 ± 6 cells/colony) and then considered MK burst-forming units (BFUs-MK) (Figure 5A), being the other colonies constituted by few large spread cells (mean 15 ± 5 cells/colony) and evaluated as MK colony-forming units (CFUs-MK) (not shown). The MK clonogenetic capacity of CD34+ cells derived from PB was about 7% at day 12; the PB-derived MK colonies were all CFUs-MK (Figure 5B).
Morphologic aspects of CB and PB megakaryocytic colonies.
CD34+ cells purified from CB or PB were assessed for their capacity to give rise to MK colonies when cultured in 0.9% methylcellulose using the same serum-free medium of the liquid suspension culture containing 50 ng/mL TPO. (A) CB-derived multifocal BFU-MK colony after 16 days of culture, showing > 100 small cells. (B) PB-derived CFU-MK colony at day 12 of culture, with few large cells. Colonies were evaluated by inverted light microscopy. (Original magnification, × 32.)
Megakaryocyte ploidy development
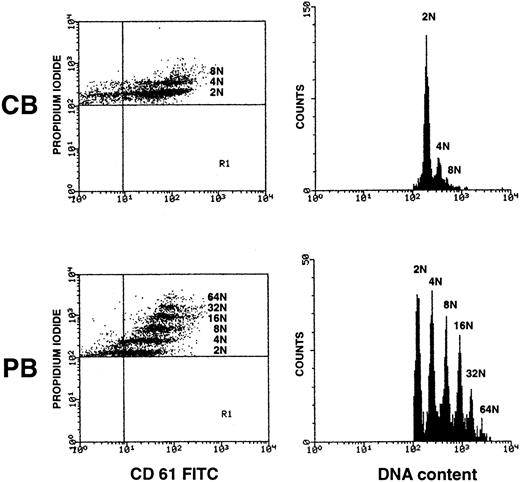
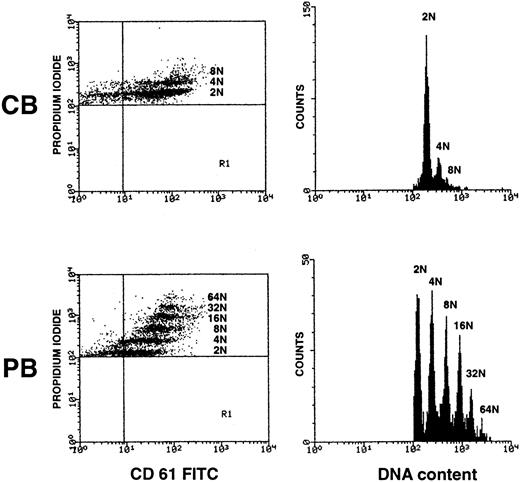
MKs derived from PB- or CB-CD34+ cells were analyzed to determine their ploidy level. As already evidenced by morphologic analysis, MKs derived from PB showed a larger percentage of polyploidy nuclei with respect to CB. In particular, PB-MKs showed a ploidy state since days 8 to 9 (≥ 8N = 11.9% ± 2.2%). At day 12 about 40% of the nuclei had equal or more than 8N (2N = 35.8% ± 5.3%; 4N = 27.4% ± 2.7%; 8N = 18.8% ± 2.1%;16N = 12.3% ± 3.4%; 32N = 4.3% ± 2.4%; 64N = 1.4% ± 0.3%; mean ± SD), whereas most CB cells were not able to give rise to highly lobated nuclei (2N = 83.9% ± 5.8%; 4N = 13.5% ± 4.6%; 8N = 2.6% ± 1.5%). As shown in a representative experiment in Figure 6, cells with 16N or more were not observed. Although the CB-derived MKs were maintained in the culture system until days 18 to 21, we did not observe a further increase in DNA content also at these late days of culture (data not shown).
Low DNA content of MKs differentiated from CB in comparison with PB-derived CD34+ cells.
CD34+ cells were cultured for 12 days in serum-free media with TPO (100 ng/mL). MK ploidy was measured by a double-staining technique and flow cytometry (left panels). Histograms of DNA content (right panels) were obtained gating the cells double-labeled with anti-CD61 MoAb and propidium iodide (see also “Materials and methods”). Representative experiment of 5 independent ones is presented.
Detection of proplatelet-forming MKs and platelet production
From day 9 onward, the cultures were examined for the emergence of proplatelet-bearing MKs, by visual examination through a Bürcker camera. The presence of proplatelets increased during the differentiation process and was more consistent in the PB cultures (Table 1).
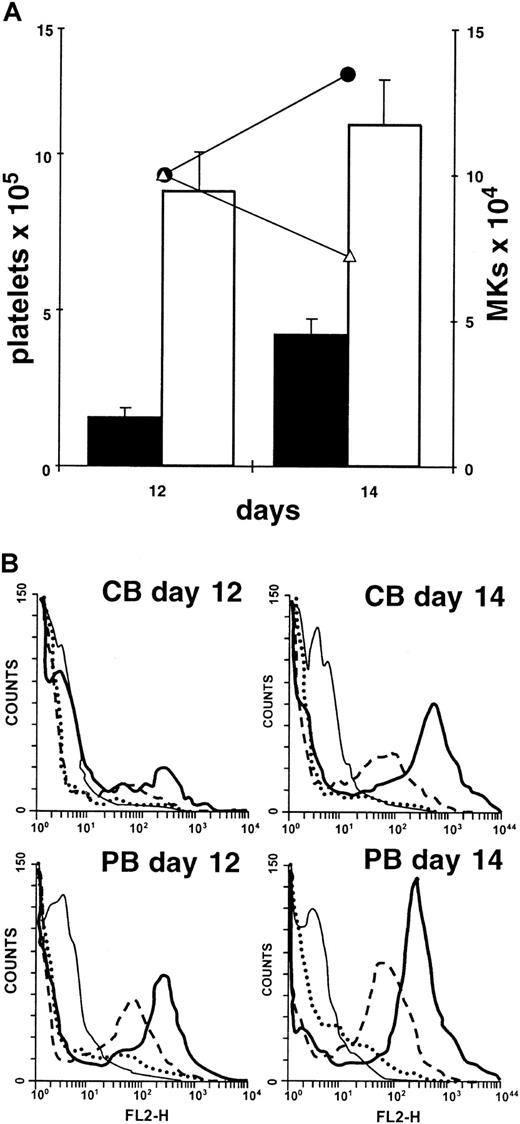
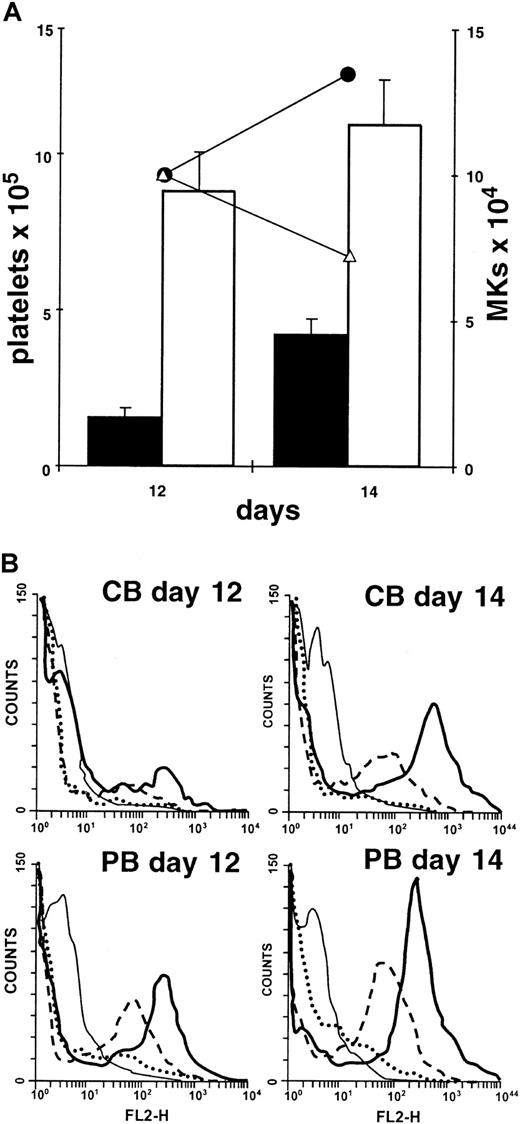
The platelets produced in culture by MKs were enumerated by flow cytometry as particles having the same scatter properties as blood platelets and expressing CD61. Platelet release was analyzed at days 9 to 14, showing 2 to 3 days of delay in their appearance in CB with respect to PB-derived culture. Platelets could be detected at very low levels (< 2 platelets/MK) in the PB-MK supernatant at day 9, and their number increased at a significant level at day 12. They were barely detectable (< 2 platelets/MK) in the CB-MK supernatant at day 12 and finally clearly numerable in both the cultures at day 14. However, a difference in the amount of platelets was always evidenced in the 2 cultures; platelets were significantly more numerous in PB than in CB culture (Figure 7A).
Reduced level of platelet production in CB-derived MK culture.
(A) Platelets released from CB- (▪) and PB-derived (■) cultures. Platelets were enumerated using anti-CD61 FITC-conjugated MoAb; see also panel B. Histograms were the mean ± SD of 5 independent experiments. Statistical significance was established by using the Student t test, P < .002. Corresponding CB (●) and PB (▵) megakaryocytic growth is indicated (right axis); see also Figure 4. (B) Platelets obtained from CB-MKs (upper panels) and PB-MKs (bottom panels) were analyzed at days 12 and 14 by flow cytometry. In vitro–produced platelets were evidenced by using anti-CD61 FITC-conjugated MoAb (solid line). Expression of P-selectin on the surface of platelets before (dotted line) and after (dashed line) stimulation with 2 U/mL thrombin at 37°C for 15 minutes was analyzed by using anti-CD62 PE-conjugated MoAb. Isotype control is also presented (thin line). Representative experiment of 5 independent ones is presented.
To understand if platelets at this time were functional, they were activated directly in the well for 15 minutes with 2 U/mL thrombin, labeled with anti-CD62 MoAb, and analyzed by flow cytometry. The peak of CD62+ platelets increased after activation, being 10% ± 2% and 75% ± 5% before and after thrombin addition, respectively (Figure 7B). Platelets showed a similar volume in both the cultures, as suggested by their fitting in the same area when acquired by flow cytometry with the same SSC and FSC parameters. Then, the most relevant difference was evidenced in the amount of platelets released in the PB supernatant that were 3 times more numerous than those released in the CB-derived supernatant (Figure 7A).
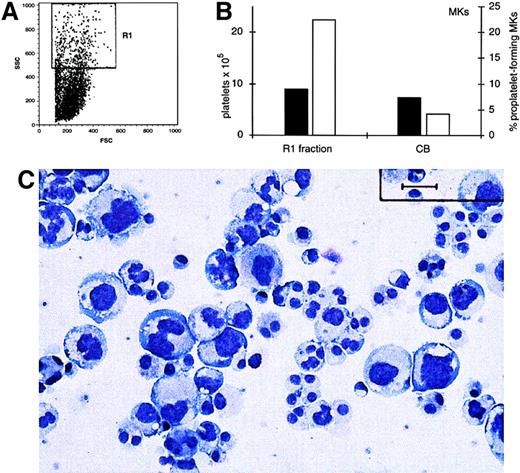
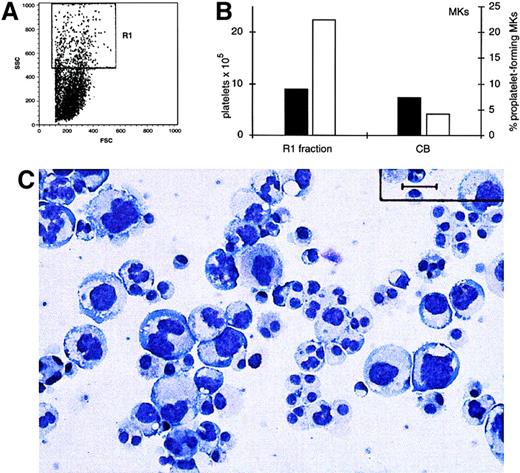
To investigate if the amount of platelets released in the supernatant correlated with the DNA content of the cells, we sorted from PB-derived cells, at day 8 of the culture, a polyploid-enriched population according to SSC parameters (Figure8A). This population was essentially constituted by polyploid cells, as evidenced by morphologic analysis (Figure 8C). This cell fraction had properties similar to CB-MKs at day 12 of culture for phenotypic markers and percentage of proplatelet-forming MKs (Figure 8C, black bars). Then, we enumerated the platelets released in the polyploid PB-fraction and diploid day 12 CB-MK cultures. The polyploid PB-MKs cultured after sorting gave about 6 times more numerous platelets than those released by CB diploid MKs (Figure 8B, white bars).
Ploidy MKs release more platelets than diploid MKs.
(A) MKs from PB culture were sorted on the basis of the cell size at day 8. The R1 obtained population (∼10%) was recultured in serum-free medium in the presence of TPO (100 ng/mL). (B) Morphology of the megakaryocytic-sorted fraction after Wright-Giemsa staining (Bar = 30 μm). (C) ▪: percentage of proplatelets forming MKs on PB-R1 fraction and day 12 CB-derived MKs. ■: platelets produced by the same populations were enumerated at days 12 and 14, respectively. (See also “Materials and methods” and “Results.”)
Soluble negative modulators
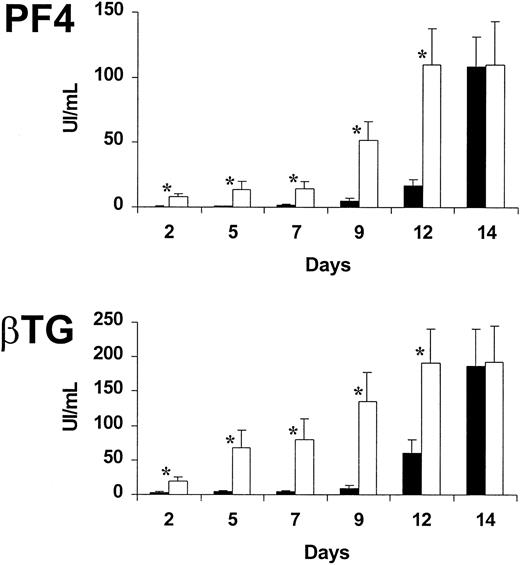
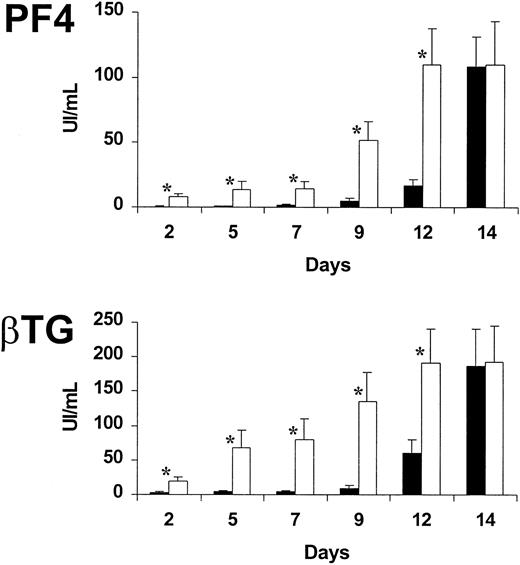
To identify the mechanisms responsible for the reduced ploidy and reduced number of platelets/MK released in the medium by CB-MKs, we investigated the concentration of negative modulators of megakaryopoiesis, as PF4 and βTG, present in the supernatants of the culture. The amount of proteins released by 1 × 10⁴cells was analyzed at different times (Figure9). In PB culture the PF4 expression started as early as day 2, increasing during the whole culture. In CB medium a very low PF4 expression was detected until day 9, at day 12 its expression started, and at day 14 it was similar to that of the PB culture at day 12 (Figure 9, upper side). βTG was expressed with a pattern similar to that of PF4 (Figure 9, bottom side). The reduced level of PF4 and βTG in the CB medium could be responsible for the increased proliferative rate.
Late release of PF4 and βTG in the supernatant of megakaryocytic cell cultured from CB-CD34+ cells.
The concentration of PF4 and βTG was measured by immunoenzymatic assay in the supernatants of MK cultures obtained from CB (▪) and PB (■) CD34+ cells in the presence of TPO (100 ng/mL). The supernatant volume corresponding to 10 000 cells was used. Protein levels were expressed as international units per milliliter at the indicated days of culture. Histograms were the mean ± SD of 3 different experiments. Asterisk indicates a significant difference established, using the Student t test (P < .05).
Transcription factors
We also examined the expression of transcription factors specifically involved in megakaryocytopoiesis, as NF-E2 and GATA-1, by means of semiquantitative RT-PCR and immunofluorescence analysis. They were both expressed from the beginning of the culture in both the differentiating systems, at both mRNA (Figure 3A,B) and protein (data not shown) levels.
Semiquantitative RT-PCR analysis was performed by using dose-response curves for the assayed templates (Figure 3B). In particular, we observed at day 9 a higher increase (about 2 times) of both the transcripts in the CB with respect to PB; at day 12 GATA-1 expression became similar in both the systems, whereas NF-E2 mRNA was 2 times higher in CB compared with PB. Similar results were obtained with different PCR cycles (data not shown). By using specific antibodies against GATA-1 and NF-E2, most of the cells were strongly positive (> 70%) in both the system (data not shown).
Expression of cyclin D3 and cyclin B1
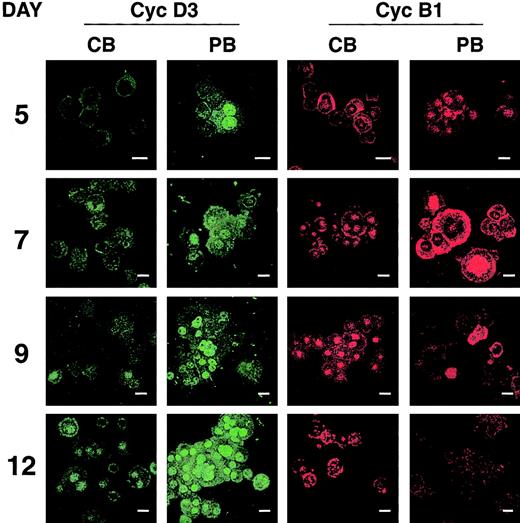
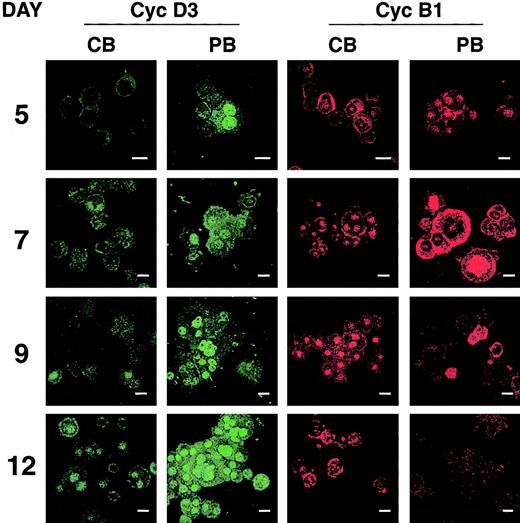
We investigated 2 cyclins that could be involved in the ploidization process, namely cyclin D3 and cyclin B1. Their expression, studied by immunofluorescence, revealed different patterns between MKs derived from CB and PB CD34+ cells. The differences were evident from day 5 onward. Indeed, cyclin D3 began to be accumulated in PB-MKs at nuclear level from day 5 and was present in 60% at day 9; at day 12 more than 90% of the cells showed an up-regulation of this cyclin (Figure 10, Cyc D3, right panels). In CB-MKs, on the contrary, cyclin D3 began to be evident at nuclear level only at day 9 and in a low number of cells (5%) and, from day 12 until the end of the culture, no more than 50% of the cells showed nuclear cyclin D3 expression (Figure 10, Cyc D3, left panels).
The expression patterns of cyclin D3 and cyclin B1 differ in PB- and CB-derived MKs.
Immunofluorescence analysis by confocal laser microscopy revealed up-regulation of cyclin D3 in PB-derived MKs (green, right panels) from day 5 to the end of the culture. In CB-derived culture (green, left panels) cyclin D3 was evident at day 9 in only 5% of the cells and reaching not more than 50% at day 12. Cyclin B1 immunofluorescence expression at nuclear level decreased at late endomitotic stage (from day 9) in PB culture (red, right panels), whereas its expression was constant in whole CB cultures (red, left panels). A total of 300 cells per slide were enumerated. These expression patterns were confirmed in 2 other experiments. (Bar = 10 μm.)
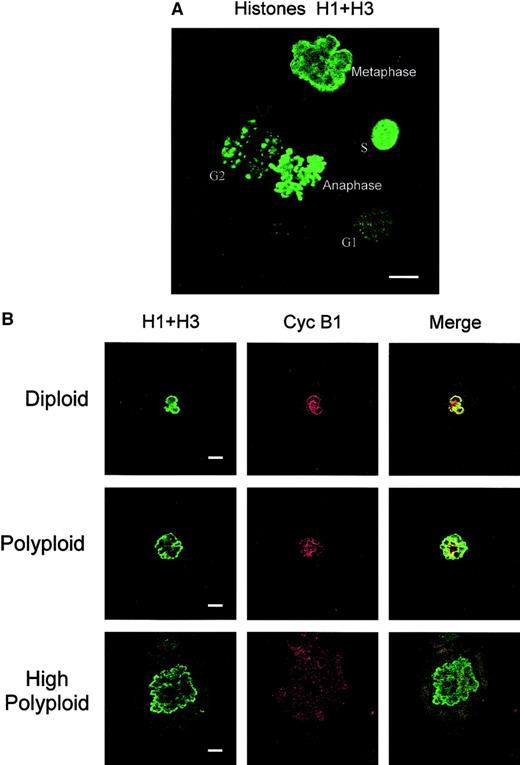
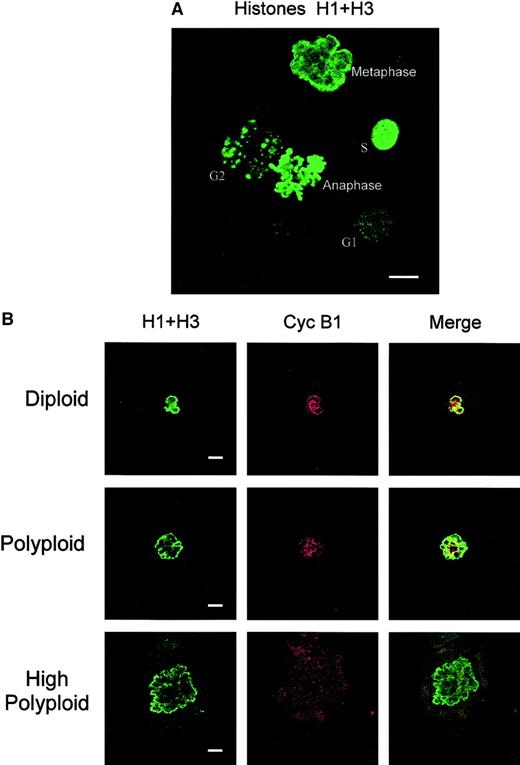
In CB-derived MKs, cyclin B1 is expressed at the nuclear level during the whole culture time (Figure 10, Cyc B1, left panels). In PB-MKs, cyclin B1 was detectable at the nuclear level at day 5, before the beginning of the endomitotic process (Figure 10, Cyc B1, right panels), and then its localization changed and it was evident also in the cytoplasm. At day 9, a reduction of cyclin B1 expression in highly polyploid cells was observed; cyclin B1 was substantially absent at day 12, when most cells were quiescent and consequently stopped to express cyclin B1. To further investigate the decreased expression of cyclin B1 in cells at day 9, we analyzed the different stages of the cell cycle by staining procedure with anti-H1 + anti-H3 antibodies (Figure11A), estimating 35% ± 5% of cycling cells. Expression pattern of cyclin B1 was studied in diploid, polyploid, and high polyploid cells, distinguished according to their different size, in metaphase stage as evidenced by H1 + H3 staining (green, Figure 11B), when cyclin B1 is described to be expressed. Cyclin B1 (red, Figure 11B) was expressed in diploid and polyploid MKs at similar levels and was strongly concentrated in the mitotic areas. Only the high-ploidy cells at metaphase stage showed a decreased cyclin B1 expression that was spread over the cytoplasm. Diploid, polyploid, and high polyploid MKs analyzed at anaphase stage were negative for cyclin B1 expression (data not shown).
Cyclin B1 expression is decreased in high polyploid MKs in metaphase stage.
(A) Basic pattern of cell-cycle stages observed in megakaryocytic cells stained with anti–phospho-histone H1 + H3 antibodies; the different cell-cycle stages (G1, S, G2, metaphase, and anaphase) are indicated. (B) Double-immunofluorescence analysis by confocal laser microscopy of MKs at the metaphase stage, displaying different ploidy level, was performed by anti-H1 + H3 antibodies (in green, left panels) and anti–cyclin B1 MoAb (in red, middle panels). The yellow area (merge, right panels) indicates colocalization of histones and cyclin B1. A total of 100 MKs in the metaphase stage at different ploidy levels were analyzed. (Bar = 10 μm.)
Discussion
CB transplantation is associated with later recovery of PB cells of donor origin, in particular of platelets, as compared with transplantation of BM or mobilized PB. This may result from qualitative differences of MK progenitor cells from CB and other sources of progenitor and stem cells. Then we investigated the differences between CB- and PB-derived CD34+ cells induced to differentiate into megakaryocytic lineage. Our results showed that MKs generated from PB had at the late stage of the culture a high content of DNA (up to 64 times), whereas the cells from CB rarely showed more than 2 times the normal DNA content. These data were consistent with others previously reported18,36 and suggested the presence of a more immature MK progenitor cell in CB with respect to PB. It was hypothesized that mature megakaryocytic progenitors with low proliferative ability give rise to high-ploidy MKs, whereas more primitive progenitors will proliferate at the expense of endomitosis during terminal differentiation.6 Our results are in line with these data. The CB-MKs were maintained in the culture containing TPO longer than the PB-derived MKs and the clonogenetic assay of CD34+ cells showed BFU-MK colonies, indicative of the presence of earlier progenitors. The analysis of the level of PF4 and βTG, platelet-specific factors that can directly and specifically inhibit human MK-colony formation and may function as negative autocrine regulators of megakaryocytopoiesis,37 38revealed a late release in CB supernatants that could at least in part contribute to the higher proliferative rate observed in CB versus PB cultures.
In CB-generated cells we observed that endomitosis occurs in less than 5% of the cells with a consequent reduced size of CB-MKs in respect to PB-MKs that corresponded to a reduced number of platelets/MK released in the medium. However, as the phenotypic pattern of the megakaryocytic cells was similar in both the systems at day 12 of the culture, we consider that the reduced ploidy of the CB-derived MKs could not be attributed to a dissimilar differentiation stage of CB with respect to PB-derived cells but to a specific block in the endomitotic process that represents the last event before platelet release. So far the capacity of MKs to dissociate the DNA synthesis and cell division resulting in a cell containing up to 64 times the normal content of DNA in a single highly lobated nucleus, although representing the main feature of MKs, is still a challenging question.
The endomitotic cell cycle is composed of repeating rounds of DNA replication separated by short gaps,21 and it has been shown that it lacks the late anaphase-telophase stages.26As the cyclins/CdKs complexes regulate the progression through the cell cycle, we looked for differences in cyclin D3 and cyclin B1 expression in cultures generating diploid (CB culture) and polyploid (PB culture) MKs.
Cyclin D3 is especially active in promoting passage through the G1 phase,39 it is present at significant levels in mature MKs,21 and the specific oligo-antisense dramatically suppresses endomitosis and inhibits MK development.40 Our results revealed a reduced level of cyclin D3 protein in diploid MKs generated from CB in comparison with PB polyploid MKs. In these last cells cyclin D3 protein accumulation correlates with a high DNA content. However, the presence of cyclin D3 in 50% of mature diploid MKs generated from CB indicates that cyclin D3 alone is not sufficient to address the endomitosis in these cells.
Activation of the cyclin B/Cdc2 kinase complex triggers entry into mitosis in all eukaryotic cells.41 Synthesis of cyclin B1 begins at the G1/S phase transition and is maximally expressed in G2/M; its localization changes during the cell cycle from the cytoplasm to the nucleus at G2/M transition.42,43Cyclin B1 reduction has been associated with the switch to polyploidization in megakaryocytic cell lines23,24; it was reported that in polyploid megakaryocytes cyclin B1 expression oscillates normally with cell-cycle phase.28,29 Our results indicated that in CB-derived MKs cyclin B1 expression is present, prevalently at nuclear level, during the whole culture time, correlating with the high cycling activity of these cells. In PB-MKs cyclin B1 expression decreased at days 9 to 12 of the culture. A more detailed analysis on day 9 MKs at metaphase stage showed similar expression in diploid and polyploid cells, suggesting that cyclin B1 is not specifically involved in the endomitotic process. On the contrary and in contrast with other data,28 29 high polyploid cells at metaphase showed a decreased cyclin B1 expression. The different technical approaches that we used could explain, at least in part, this discrepancy. Therefore, this observation could be relevant in the ploidy process, and we consider that further studies are needed to clarify this point.
CB-derived MKs, although with reduced size and DNA content, were fully mature in respect not only to their phenotypical markers but also to their capability to release platelets, that represents the last event in the MK “life.” However, a reduced number of platelets were observed in CB culture (CB platelets were 3 times less numerous than those obtained from PB) that we consider a direct consequence of the reduced size and DNA content of these cells. A confirmation of a direct consequence between DNA content and platelet production was obtained by sorting polyploid cells from PB-MKs and evaluating the platelets released in the supernatant. Six times more numerous platelets than those released by CB-diploid MKs were obtained, although the phenotypical pattern and the proportion of the proplatelets bearing MKs were similar in both the systems. Cultured platelets, defined on the basis of CD61 expression and cytometric scatter properties identical to blood platelets, could be activated, indicating their functionality. Furthermore, to investigate if another mechanism could be involved in the reduced number of released platelets, we analyzed the expression of transcriptional factors specifically involved in their production like GATA-119 or NF-E2,20 but they were both strongly expressed in both the systems. Other genes could be involved in the regulation of platelet release. Our preliminary data on ets-family transcriptional factors known to be involved in the regulation of MK specific genes, in particular on fli-1,44 indicates a high expression in both the systems (F.V., G. Macioce, A.B., et al, unpublished results, 2001).
In conclusion, during the CB-MK differentiation program the low level of the inhibitors (ie, PF4 and βTG) released in the medium, the absence of cyclin D3 up-regulation, and the constant cyclin B1 expression could contribute to explain the higher proliferative rate and the incapacity of these cells to reach the high characteristic polyploidization of the PB-MKs. Furthermore, although with a different timing of appearance of membrane glycoproteins and platelet release, all the functional activities are normal in the 2 models but the endomitotic process and consequently the cytoplasmic mass and the number of platelets. We consider that the polyploidization process is not necessary to reach a full MK differentiation but is necessary to release a high number of platelets.
Although an in vitro model, our comparison between PB- and CB-CD34+ cells induced to differentiate into MK lineage could contribute to understanding the mechanisms underlying the delayed engraftment of bone marrow by CB-CD34+ cells in comparison to PB and could represent a model for further studies.
We thank Dr Maria Orlando and Dr Ugo Testa for critical reading of the manuscript and helpful suggestions, Luciano Mandarino for photographic assistance, and Dr Francesca Abbonizio for the manuscript preparation.
Supported by grant “Problematiche emergenti in Medicina Trasfusionale sulla sicurezza e l'autosufficienza del sangue e dei suoi prodotti.”
The publication costs of this article were defrayed in part by page charge payment. Therefore, and solely to indicate this fact, this article is hereby marked “advertisement” in accordance with 18 U.S.C. section 1734.
References
Author notes
Hamisa Jane Hassan, Department of Clinical Biochemistry, Istituto Superiore di Sanità, Viale Regina Elena 299, 00161, Rome, Italy; e-mail: j.hassan@iss.it.

