Abstract
Vascular endothelial (VE) cadherin, PECAM-1 (platelet endothelial cell adhesion molecule-1, CD31), Tie2, CD34, and endoglin are established markers for adult and embryonic endothelial cells (ECs). Here, we report that the expression of these EC markers is initiated in the extraembryonic region at the late-streak stage (nominal stage E6.75). Immunohistochemical analysis shows that EC marker–positive cells arise in a subset of Flk1 (VEGF-R2) mesodermal cells. In contrast, GATA1, a marker for primitive erythropoietic progenitors, is expressed in a more restricted subset of Flk1-positive cells. Using flow cytometry, we observed that the GATA1-positive cell population existed as a subset of the EC marker–positive cell. Consistent with this notion, we showed with the primitive hematopoietic colony assay that primitive erythropoietic progenitors are enriched in PECAM-1– and Tie2-positive cells. These results suggest that primitive hematopoietic cells arise from EC marker–positive cells. Thus, VE-cadherin, PECAM-1, CD34, endoglin, and Tie2 are expressed not only in adult and embryonic ECs but in extraembryonic Flk1-positive cells during gastrulation. The latter cell population includes progenitors that give rise to primitive hematopoietic cells, suggesting that primitive and definitive hematopoietic cells in the mouse embryo arise from EC marker–positive cells.
Introduction
Primitive hematopoietic cells (HCs) arise in the yolk sac from mesodermal cells called blood islands (BIs).1,2 The extraembryonic mesoderm that gives rise to primitive HCs has been mapped to the posterior part of the primitive streak.3 On the other hand, endothelial cells (ECs) arise from a broader range of the region of the primitive streak.3 The possibility of a common progenitor for ECs and HCs, termed the hemangioblast, has been proposed4 based on the observation that ECs and HCs emerge from BIs in close proximity and at a similar time during embryonic development. In differentiating embryonic stem (ES) cells, the blast colony–forming cell (BL-CFC) has been shown to give rise to HCs and ECs,5 though BL-CFCs may give rise to additional lineages, such as smooth muscle cells.6,7 Using the BL-CFC assay, Huber et al8 recently found that the posterior streak has the potential to give rise to HCs and ECs. HCs and ECs share a number of common markers during the course of their development, including Flk1, Flt1, and Tal1, providing further evidence in favor of the existence of the hemangioblast.
VE-cadherin is a cell adhesion molecule expressed exclusively in endothelium,9 leading to its use by a number of laboratories as an endothelial marker. Other endothelial markers have been identified, including PECAM-1 (CD31), CD34, Tie2, and endoglin,10-14 although the latter are also expressed in other tissues. The expression of an individual marker or a combination of EC markers by a particular cell is interpreted as supporting evidence that the cell is an endothelial cell or is of endothelial origin, though functional data or morphologic data are important for classifying a cell as an endothelial cell. Given the difficulty of interpreting anatomic data, combination EC markers in differentiating ES cells lead to the supposition that the cell is an endothelial cell or is of endothelial origin.5,15
Definitive hematopoietic stem cells (HSCs) arise in the aortagonad-mesonephros (AGM) region in the vicinity of the dorsal aorta around embryonic day 10.5 (E10.5).16 In addition to anatomic data showing that HCs bud from the luminal wall of the ventral side of dorsal aorta,17 HCs have been shown to express CD34, Tie2, and PECAM-1.18-20 Nishikawa et al21,22 found that lymphohematopoietic cells are derived from VE-cadherin–expressing cells derived from differentiating ES cells and embryonic cells. PECAM-1 and VE-cadherin are expressed in fetal HSCs.23,24 Thus, it has been proposed that definitive HCs have a close developmental relationship with ECs and that they originate from endothelial precursors25-28 ; this idea, however, remains controversial.29
Although it has been reported that definitive HCs arise from cells expressing VE-cadherin, PECAM-1, Tie2, and CD34,25-28,30 we showed here that Flk1-positive cells in the extraembryonic region during gastrulation expressed VE-cadherin, PECAM-1, Tie2, endoglin, and CD34 and that the GATA1-positive cell population existed as a subset of the EC marker–positive cell population. With the use of flow cytometry, we also showed that primitive erythropoietic progenitors were enriched in the EC marker–positive population. Thus, these EC markers were expressed not only in ECs and definitive HCs, they were also expressed in the progenitor cells that gave rise to primitive HCs. However, the expression of these EC markers in primitive HCs decreased as they differentiated.
Materials and methods
Mice and embryo dissection
Pregnant ICR mice were purchased from Japan SLC (Hamamatsu, Japan). GATA1-LacZ31 and GATA1-GFP32 mice have previously been described. Tie2-LacZ transgenic animals have also previously been described33 and were obtained from the Jackson Laboratory (Bar Harbor, ME). Flk1-GFP knock-in mice, in which the EGFP cDNA has been inserted into the first exon of the Flk1 gene, have also been described previously.34
Antibodies
Antibodies used in this study were as follows: anti–VE-cadherin antibody (VCAD1, a generous gift from Dr N. Matsuyoshi), anti–ϵy globin antibody (a generous gift from Dr T. Atsumi), anti–PECAM-1 (MEC13.3; BD Biosciences, San Jose, CA), anti-CD34 (clone RAM34; BD Biosciences, anti-Tie2 (TEK4; eBioscience, San Diego, CA), anti-GATA1 (N6; Santa Cruz Biotechnology, Santa Cruz, CA), antiendoglin (MJ7/18; BD Biosciences), anti-Flk1 (AVAS12α1; BD Biosciences), and anti-GFP (rabbit polyclonal; Molecular Probes, Eugene, OR).
Cell preparation and flow cytometry
Embryos were incubated with 0.1% collagenase S-1 (Nitta Gelatin, Osaka, Japan) at 37°C for 15 minutes. After washing, single cells were exposed to the following antibodies: phycoerythrin (PE)–conjugated antibody to PECAM-1 (MEC13.3; BD Biosciences), Tie2 (TEK4; eBioscience), and allophycocyanin (APC)–conjugated antibody to VE-cadherin (VCAD1; a generous gift from Drs N. Matsuyoshi and M. Ogawa). We excluded dead cells stained with propidium iodide from the analyses. Cells were analyzed by FACSCalibur or were sorted by FACSVantage (both from Becton Dickinson, San Jose, CA). Primitive hematopoietic colony assay was performed as described previously.35
Immunohistochemistry
Embryos were dissected, staged according to the method of Downs and Davies,36 and fixed with 4% paraformaldehyde (PFA) overnight. After washing with PBS, the embryos were soaked in 30% sucrose and mounted on OCT compound, and 4-μm cryosections were prepared. After blocking reaction in PBSMT (PBS + 2% skim milk + 0.1% Tween 20) for 1 hour, the sections were incubated with primary antibodies at 4°C overnight. Sections were washed twice in PBST for 5 minutes and then incubated with fluorochrome-conjugated secondary antibodies at room temperature for 1 hour. Nuclei were visualized by incubation with 2 μg/mL Hoechst 33342 for 10 minutes at room temperature, and the sections were mounted in PermaFluor Mounting medium (Thermo Electron, Pittsburgh, PA). Images were captured by a digital camera system (DC500; Leica, Wetzlar, Germany) using a Leica DMRXA2 microscope. Whole mount immunohistochemistry was performed, and HRP activities were visualized by diaminobenzidine (DAB) staining. Some embryos were sectioned and counterstained by methyl green.
X-gal staining
Results
Expression of PECAM-1 in ϵyglobin-producing cells
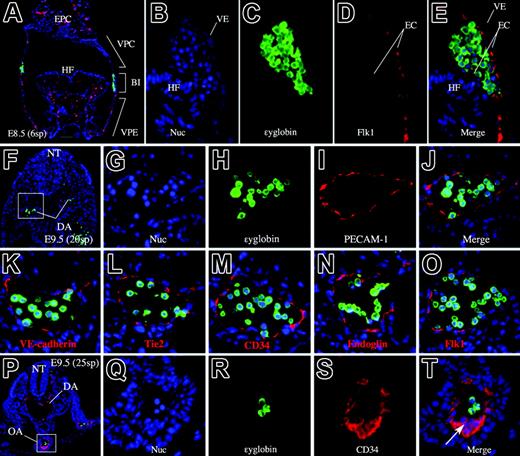
In the extraembryonic visceral yolk sac, the mesodermally derived vascular plexus and associated BIs are well defined by E8.538 (Figure 1). The yolk sac can be divided into 3 regions. The vascular plexus, close to the chorion (VPC), and the vascular plexus, close to the embryo (VPE), contain vascular endothelium but lack HCs, whereas the BI region contains HCs enclosed by endothelium38 (Figure 1A). Thus, the yolk sac appears to be separated into areas containing endothelial precursors only (VPCs and VPEs) and an area (BI) in which ECs and HCs may both develop. In addition, when ϵyglobin and Flk1 are used as markers for primitive erythrocytes and endothelium, respectively, in the E8.5 embryo, their expression is observed exclusively in distinct regions of the embryo (Figure 1A-E). Thus, at this stage, the sites of hematopoiesis and endothelial development are clearly distinguished by the expression of respective genetic markers and by embryonic morphology.
Anatomic locations of primitive hematopoiesis and vasculogenesis. (A) Transverse section of an E8.5 (6sp) embryo. Flk1 (red) and ϵyglobin (green) are expressed exclusively. Note that Flk1 marks endothelial cells, whereas ϵyglobin marks hematopoietic cells. The domain of the vascular plexus and the blood island region are clearly regionalized. (B-E) High-magnification image of the blood island region stained with a nuclear staining dye, Hoechst 33342 (B), anti-ϵyglobin antibody (C), anti-Flk1 antibody (D), and the merged image (E). (F) Merged image of PECAM-1 (red), ϵyglobin (green), and Hoechst dye staining (blue) of a transverse section of an E9.5 embryo proper. Scale bar represents 100 μm. (G-J) Higher magnification of the boxed area in panel F. (G) Hoechst 33342 staining. (H) Anti–ϵyglobin antibody staining. (I) Anti–PECAM-1 antibody staining. (J) Merged image of panels G-I. (K-O) Merged image of anti-ϵyglobin antibody staining and Hoechst 33342 staining in combination with staining for VE-cadherin (K), Tie2 (L), CD34 (M), endoglin (N), or Flk1 (O). Endothelial markers are expressed in endothelial but not in hematopoietic cells. (P) Merged image of CD34 (red), ϵyglobin (green), and Hoechst dye staining (blue) of a transverse section of an E9.5 embryo proper. (Q-T) Higher magnification of the boxed area in panel P. (Q) Hoechst 33342 staining. (R) Anti-ϵyglobin antibody staining. (S) Anti-CD34 antibody staining. (T) Merged image of panels Q-T. (arrow) Clump of cells at the ventral side of OA. ex indicates extra-embryonic region; em, embryonic region; DA, dorsal aorta; VE, visceral endoderm; EPC, ectoplacental cone; HF, head fold; NT, neural tube; OA, omphalomesenteric artery. All images were captured by a Leica DC500 CCD camera with IM50 Imaging Manager through a Leica DMRXA microscope using a 5×/0.15 NA objective (panel A) or a 20×/0.50 NA objective (panels B-T).
Anatomic locations of primitive hematopoiesis and vasculogenesis. (A) Transverse section of an E8.5 (6sp) embryo. Flk1 (red) and ϵyglobin (green) are expressed exclusively. Note that Flk1 marks endothelial cells, whereas ϵyglobin marks hematopoietic cells. The domain of the vascular plexus and the blood island region are clearly regionalized. (B-E) High-magnification image of the blood island region stained with a nuclear staining dye, Hoechst 33342 (B), anti-ϵyglobin antibody (C), anti-Flk1 antibody (D), and the merged image (E). (F) Merged image of PECAM-1 (red), ϵyglobin (green), and Hoechst dye staining (blue) of a transverse section of an E9.5 embryo proper. Scale bar represents 100 μm. (G-J) Higher magnification of the boxed area in panel F. (G) Hoechst 33342 staining. (H) Anti–ϵyglobin antibody staining. (I) Anti–PECAM-1 antibody staining. (J) Merged image of panels G-I. (K-O) Merged image of anti-ϵyglobin antibody staining and Hoechst 33342 staining in combination with staining for VE-cadherin (K), Tie2 (L), CD34 (M), endoglin (N), or Flk1 (O). Endothelial markers are expressed in endothelial but not in hematopoietic cells. (P) Merged image of CD34 (red), ϵyglobin (green), and Hoechst dye staining (blue) of a transverse section of an E9.5 embryo proper. (Q-T) Higher magnification of the boxed area in panel P. (Q) Hoechst 33342 staining. (R) Anti-ϵyglobin antibody staining. (S) Anti-CD34 antibody staining. (T) Merged image of panels Q-T. (arrow) Clump of cells at the ventral side of OA. ex indicates extra-embryonic region; em, embryonic region; DA, dorsal aorta; VE, visceral endoderm; EPC, ectoplacental cone; HF, head fold; NT, neural tube; OA, omphalomesenteric artery. All images were captured by a Leica DC500 CCD camera with IM50 Imaging Manager through a Leica DMRXA microscope using a 5×/0.15 NA objective (panel A) or a 20×/0.50 NA objective (panels B-T).
VE-cadherin, PECAM-1, and other EC markers have been previously used to distinguish ECs from other cells, including HCs. Consistent with these data, we have observed that EC markers are expressed in ECs, but not in circulating ϵyglobin-producing cells, at E9.5 (Figure 1F-O). Previous studies39,40 report that definitive hematopoietic progenitors at E9.5 in a part of the yolk sac and a clump of cells located at the ventral side of the omphalomesenteric artery coexpress these antigens. Consistent with these reports, we observed that a clump of cells located on the ventral side of the omphalomesenteric artery was CD34+ (Figure 1P-T) and also Flk1, PECAM-1, and Tie2 positive (data not shown).
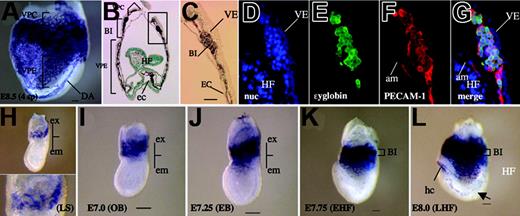
At E8.5 (6 somite pairs [6sp]), however, we did observe that PECAM-1 was expressed in the BI region (Figure 2A). A transverse section also showed diaminobenzidine (DAB)–stained cells within the BI. The stained cells presumably represent primitive erythrocytes and ECs (Figure 2B-C). To demonstrate PECAM-1 expression in these putative primitive erythrocytes, we costained the cells with an antibody against embryonic ϵyglobin, a marker of primitive erythrocytes. Fluorescent immunohistochemical analysis showed that PECAM-1 is expressed in most, if not all, the ϵyglobin-producing cells, indicating that PECAM-1 was expressed in primitive erythrocytes at this developmental stage (E8.5, 6sp).
The finding that PECAM-1 marks primitive HCs in the BI region was unexpected. Thus, we next investigated when and where PECAM-1–positive cells arose during primitive hematopoiesis (Figure 2). Embryos were staged carefully according to the method of Downs and Davies.36 Surprisingly, PECAM-1 expression was detected in the extraembryonic region, the future yolk sac, as early as the late-streak stage (nominal stage E6.75; Figure 2H). We detected the expression of PECAM-1 in subsequent stages to E8.0 (Figure 2I-L), though we did not detect its expression in primitive HCs at E9.5 (Figure 1J). We were unable to detect PECAM-1 and other EC markers before the late-streak stage (data not shown). Other EC markers showed similar expression patterns in extraembryonic region (Figure S1, available at the Blood website; see the Supplemental Materials link at the top of the online article).
VE-cadherin, PECAM-1, CD34, Tie2, and endoglin are expressed in extraembryonic Flk1-positive cells of gastrulating embryos
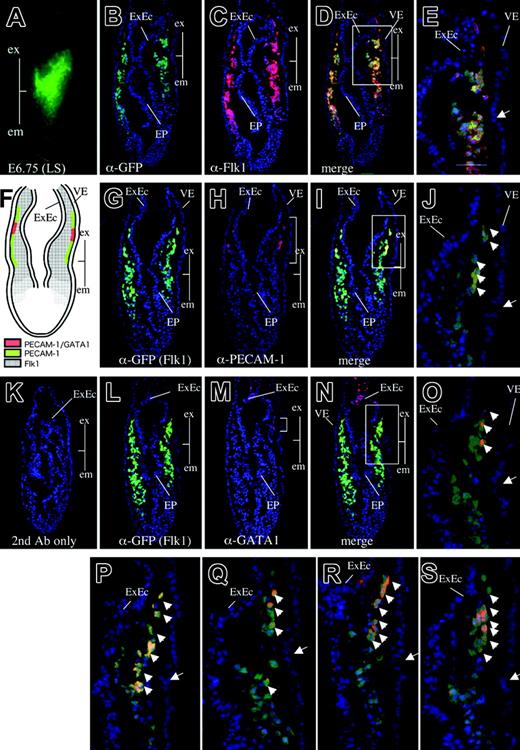
Although whole mount chromogenic staining after exposure to anti–PECAM-1 antibody showed that PECAM-1 is expressed in the extraembryonic region in the gastrulating embryo, the precise anatomic localization and the cell type of the PECAM-1 immunoreactive cells were not identified. To investigate the spatial location of the PECAM-1–positive cells during mesoderm development, we made use of an Flk1-GFP knock-in embryo in which the expression of the GFP reporter was controlled by the regulatory elements of the native Flk1 gene, such that it could be used as a surrogate to monitor the expression pattern of the endogenous Flk1 gene.34 Flk1-GFP knock-in mice also facilitate estimation of the developmental stage of dissected embryos more precisely because Flk1 expression patterns, as monitored by GFP fluorescence, reflect the developmental stage of the embryo.34 When serial transverse sections of these embryos were subjected to immunohistochemistry performed with anti-Flk1 and anti-GFP antibodies, the expression of GFP and Flk1 was found to colocalize to a broad spectrum of mesodermal cells, including extraembryonic and embryonic mesoderm cells emigrating from the primitive streak to the space between the endoderm and the ectoderm and were identified anatomically according to Kaufman41 (Figure 3B-E). This expression pattern was consistent with our previous finding that Flk1 marks a broad spectrum of mesodermal progenitors that give rise to hematopoietic, endothelial, cardiac, skeletal muscle, and other mesoderm-derived cells.34 (In this paper, we use the term “mesodermal cells” to mean mesoderm-derived cells.) We do not know the expression status of the Brachyury gene on these cells.
PECAM-1 expression in globin-producing cells and in the extraembryonic region as early as the streak stage. (A) Whole mount anti–PECAM-1 antibody staining of E8.5 (4sp) embryo. Note that most blood vessels, including arteries and veins, are well stained with the anti–PECAM-1 antibody and that there are densely stained cells within the blood island region. (B) Transverse section showing that blood island cells are PECAM-1 positive. Nuclei are visualized by methyl green staining. (C) High magnification of the boxed area in panel B. (D-G) High magnification of the blood island region stained with Hoechst 33342 (D), anti-ϵyglobin antibody (E), anti–PECAM-1 antibody (F), and the merged image (G). PECAM-1 is expressed in globin-positive cells. (H-L) Whole mount PECAM-1 antibody staining of embryo at late-streak stage (H), no-bud (OB) stage (I), early-bud (EB) stage (J), early–head fold (EHF) stage (K), and late–head fold (LHF) stage (L). PECAM-1 is expressed in the extraembryonic region, presumably corresponding to the mesodermal layer as early as the late-streak stage, and is expressed continuously in the extraembryonic regions including the blood island region until E8.5. (H, inset) High magnification of PECAM-1–positive cells in the extraembryonic region. (arrow) Forming dorsal aortae. hc indicates heart crescent; HF, head fold; ec, endocardium; VE, visceral endoderm. Images in panels A and H-L were captured by Leica DC500 CCD camera with IM50 Imaging Manager through Leica MZ FLIII microscope a PLAN APO lens. A Leica DC500 CCD camera with IM50 Imaging Manager through Leica DMRXA microscope was used to capture the images using a PLAN APO 1.0/0.125 NA lens (panel A; total magnification, ×32), a 5×/0.15 NA objective (panel B) or a 20×/0.50 NA objective (panels C-G).
PECAM-1 expression in globin-producing cells and in the extraembryonic region as early as the streak stage. (A) Whole mount anti–PECAM-1 antibody staining of E8.5 (4sp) embryo. Note that most blood vessels, including arteries and veins, are well stained with the anti–PECAM-1 antibody and that there are densely stained cells within the blood island region. (B) Transverse section showing that blood island cells are PECAM-1 positive. Nuclei are visualized by methyl green staining. (C) High magnification of the boxed area in panel B. (D-G) High magnification of the blood island region stained with Hoechst 33342 (D), anti-ϵyglobin antibody (E), anti–PECAM-1 antibody (F), and the merged image (G). PECAM-1 is expressed in globin-positive cells. (H-L) Whole mount PECAM-1 antibody staining of embryo at late-streak stage (H), no-bud (OB) stage (I), early-bud (EB) stage (J), early–head fold (EHF) stage (K), and late–head fold (LHF) stage (L). PECAM-1 is expressed in the extraembryonic region, presumably corresponding to the mesodermal layer as early as the late-streak stage, and is expressed continuously in the extraembryonic regions including the blood island region until E8.5. (H, inset) High magnification of PECAM-1–positive cells in the extraembryonic region. (arrow) Forming dorsal aortae. hc indicates heart crescent; HF, head fold; ec, endocardium; VE, visceral endoderm. Images in panels A and H-L were captured by Leica DC500 CCD camera with IM50 Imaging Manager through Leica MZ FLIII microscope a PLAN APO lens. A Leica DC500 CCD camera with IM50 Imaging Manager through Leica DMRXA microscope was used to capture the images using a PLAN APO 1.0/0.125 NA lens (panel A; total magnification, ×32), a 5×/0.15 NA objective (panel B) or a 20×/0.50 NA objective (panels C-G).
We next used this embryo to determine the precise anatomic location of the expression of various endothelial markers in the early embryo. We found that PECAM-1 is expressed in a subset of Flk1-positive mesodermal cells in the extraembryonic region (Figures 3G-J, S2). PECAM-1–positive cells were located close to the visceral endodermal layer and were distributed in a region extending from the boundary between the extraembryonic and embryonic regions toward the chorion (Figure 3G-J). Interestingly, the spatial pattern of expression of CD34, endoglin, VE-cadherin, and Tie2 was similar to that of PECAM-1 (Figure 3P-S), suggesting that these EC markers were coexpressed in the PECAM-1–positive population. To confirm the coexpression of these endothelial markers, we subjected wild-type cells derived from late streak–stage embryos to flow cytometry after exposure to antibodies against VE-cadherin and PECAM-1 (Figure S3). This analysis confirmed that VE-cadherin and PECAM-1 were coexpressed in a cell population (4.1%), though some cell populations expressed either PECAM-1 or VE-cadherin (Figure S3).
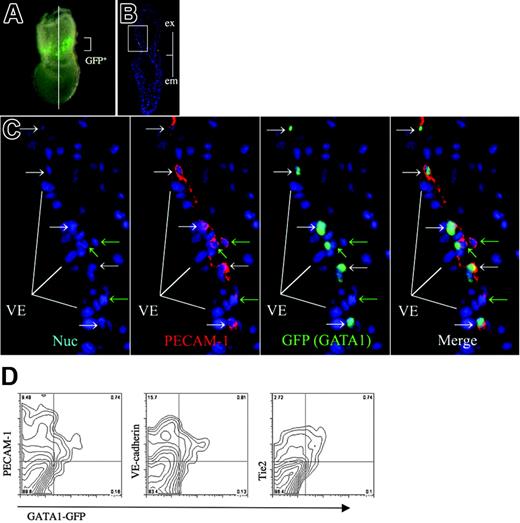
In contrast, we detected the expression of GATA1, a marker for primitive erythropoietic progenitors,42,43 in a small subset of the extraembryonic Flk1-positive cells (Figures 3L-O, S2). We also observed the expression of GATA1 in the extraembryonic ectoderm, as reported previously.44 The expression of GATA1 in the extraembryonic mesoderm was limited to a more narrow domain than was the expression of PECAM-1 (Figures 3L-O, S2), suggesting that GATA1 expression is more strictly restricted to hematopoietic progenitors. GATA1-GFP Tg mice express GFP under the control of G1HE regulatory elements, such that the expression pattern of the GFP reporter recapitulates hematopoietic expression of the endogenous GATA1 gene (Figure 4A).32 When sections of the GATA1-GFP Tg embryo at no-bud (OB) stage were stained with anti–PECAM-1 antibody and anti-GFP antibody, GATA1 (GFP) expression was clearly shown to be limited to a more narrow domain than was the expression of PECAM-1 (Figure 4C). We next performed flow cytometry on cells derived from GATA1-GFP embryos so as to investigate whether GATA1 expression overlapped the expression of PECAM-1, VE-cadherin, and Tie2 (Figure 4D). We observed that most GFP-positive cells expressed PECAM-1, VE-cadherin, and Tie2, indicating that GATA1 is coexpressed with these EC markers, although the EC markers were expressed more widely than GATA1 in the GATA1-GFP Tg embryos. No significant change was observed in the percentage of cell populations that expressed GATA1 and PECAM-1 compared with those that expressed GATA1 and VE-cadherin or GATA1 and Tie2 (Table S1).
Gastrulating embryos express PECAM-1, VE-cadherin, CD34, endoglin, and Tie2 in the extraembryonic mesoderm layer. (A) GFP expression in Flk1-GFP knock-in embryos at the late-streak stage. Line shows a transverse section used for immunohistochemistry (PLAN APO lens, 1.0×/0.125; final magnification ×80). (B-D) Immunohistochemical analysis of a transverse section as shown in panel A using anti-GFP antibody (B, green), anti-Flk1 antibody (C, red), and the merged image (D). Note that GFP expression driven by the endogenous Flk1 locus recapitulates endogenous Flk1 protein expression. (Arrow) Boundary between the extraembryonic and embryonic regions. Boxed area in panel D is magnified in panel E. (F) Schematic representation of PECAM-1, GATA1, and Flk1 expression. (G-J) Immunohistochemical staining of a transverse section as shown in panel A using anti-GFP antibody (G, green), anti–PECAM-1 antibody (H, red), and the merged image (I). Note that PECAM-1 is expressed in extraembryonic mesoderm cells contacting the visceral endoderm layer from the boundary between the extraembryonic and embryonic regions. Boxed area in panel I is magnified in panel J. (K) Control embryo section stained with secondary antibodies alone. (L-O) Immunohistochemical staining of a transverse section as shown in panel A using anti-GFP antibody (L, green), anti-GATA1 antibody (M, red), and the merged image (N). (O) Higher magnification of GATA1-positive cells in panel N. Note that GATA1 is expressed in a small subset of extraembryonic mesoderm cells, in contrast to the broader spectrum of PECAM-1 expression. (P) CD34 expression in the extraembryonic mesoderm layer. (Q) Tie2 expression in the extraembryonic mesoderm layer. (R) Endoglin expression in the extraembryonic mesoderm and ectoderm layers. (S) VE-cadherin expression in the extraembryonic mesoderm layer. Arrowheads indicate Flk1-positive cells expressing either PECAM-1, GATA-1, CD34, Tie2, endoglin, or VE-cadherin. Images in panel A were captured with a Leica MZ FLIII microscope and a Leica DC500 CCD camera with IM50 Imaging Manager, with a PLAN APO 1.0 lens (1.0×/0.125 NA). Images in panels B-S were captured by Leica DC500 CCD camera with IM50 Imaging manager and a Leica DMRXA microscope using a 20×/0.50 NA objective.
Gastrulating embryos express PECAM-1, VE-cadherin, CD34, endoglin, and Tie2 in the extraembryonic mesoderm layer. (A) GFP expression in Flk1-GFP knock-in embryos at the late-streak stage. Line shows a transverse section used for immunohistochemistry (PLAN APO lens, 1.0×/0.125; final magnification ×80). (B-D) Immunohistochemical analysis of a transverse section as shown in panel A using anti-GFP antibody (B, green), anti-Flk1 antibody (C, red), and the merged image (D). Note that GFP expression driven by the endogenous Flk1 locus recapitulates endogenous Flk1 protein expression. (Arrow) Boundary between the extraembryonic and embryonic regions. Boxed area in panel D is magnified in panel E. (F) Schematic representation of PECAM-1, GATA1, and Flk1 expression. (G-J) Immunohistochemical staining of a transverse section as shown in panel A using anti-GFP antibody (G, green), anti–PECAM-1 antibody (H, red), and the merged image (I). Note that PECAM-1 is expressed in extraembryonic mesoderm cells contacting the visceral endoderm layer from the boundary between the extraembryonic and embryonic regions. Boxed area in panel I is magnified in panel J. (K) Control embryo section stained with secondary antibodies alone. (L-O) Immunohistochemical staining of a transverse section as shown in panel A using anti-GFP antibody (L, green), anti-GATA1 antibody (M, red), and the merged image (N). (O) Higher magnification of GATA1-positive cells in panel N. Note that GATA1 is expressed in a small subset of extraembryonic mesoderm cells, in contrast to the broader spectrum of PECAM-1 expression. (P) CD34 expression in the extraembryonic mesoderm layer. (Q) Tie2 expression in the extraembryonic mesoderm layer. (R) Endoglin expression in the extraembryonic mesoderm and ectoderm layers. (S) VE-cadherin expression in the extraembryonic mesoderm layer. Arrowheads indicate Flk1-positive cells expressing either PECAM-1, GATA-1, CD34, Tie2, endoglin, or VE-cadherin. Images in panel A were captured with a Leica MZ FLIII microscope and a Leica DC500 CCD camera with IM50 Imaging Manager, with a PLAN APO 1.0 lens (1.0×/0.125 NA). Images in panels B-S were captured by Leica DC500 CCD camera with IM50 Imaging manager and a Leica DMRXA microscope using a 20×/0.50 NA objective.
Enrichment of primitive erythropoietic progenitors in PECAM-1– and Tie2-positive populations
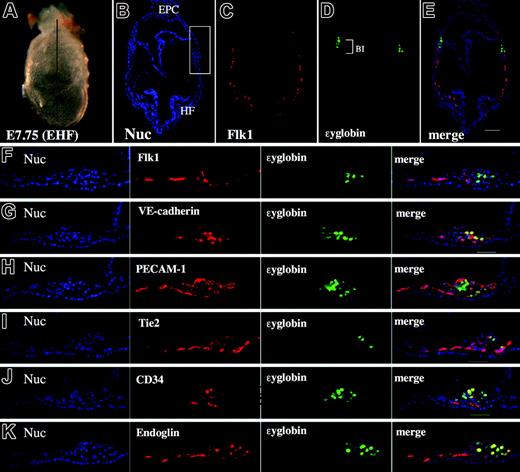
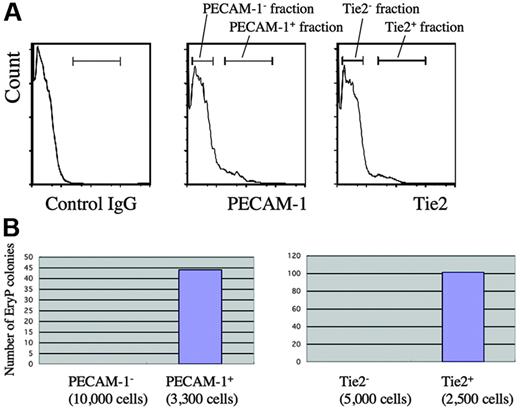
Given that various EC markers were already expressed by GATA1-positive cells during gastrulation, we next addressed whether primitive, ϵyglobin-expressing erythrocytes continued to coexpress these EC markers and performed immunohistochemistry on early head fold (EHF)–stage embryos (nominal stage, E7.75) (Figure 5). E7.75 embryos already expressed ϵyglobin in a subset of BI cells (Figure 5D). Interestingly, the expression of Flk1 was already decreased in these globin-positive cells (Figure 5F), which is consistent with the results of a previous study. However, we observed that each of the other EC markers was expressed in most, if not all, the globin-positive cells (Figure 5G-K), suggesting that these EC markers were expressed in the mesodermal progenitors during gastrulation and that their expression is maintained in globin-positive cells. We examined whether the progenitor population for primitive erythrocytes expressed the EC markers PECAM-1 and Tie2. We sorted wild-type cells into fractions that were individually positive or negative for the expression of PECAM-1 or Tie2 and then subjected the sorted cells to the primitive hematopoietic colony assay (Figure 6). We found that cells that expressed either PECAM-1 (4.4%) or Tie2 (3.7%) were able to generate primitive erythropoietic colonies (Figure 6B), whereas those cells that did not express either marker failed to do so, indicating that primitive erythropoietic progenitors are enriched in PECAM-1– and Tie2-positive fractions.
GATA1-positive cell population exists as a subset of EC marker–positive cell. (A) GFP expression in GATA1-GFP embryos at no-bud (OB) stage. Line shows a transverse section used for immunohistochemistry (PLAN APO lens, 1.0×/0.125; final magnification, ×63). (B) Immunohistochemical analysis of a transverse section as shown in panel A using anti-GFP antibody shown in green and anti–PECAM-1 antibody shown in red. Merged image is shown. (C) High magnification of the blood island region shown in panel B, Hoechst 33342 staining, anti–PECAM-1 antibody, anti-GFP antibody, and the merged image. (white arrows) Cells expressing GFP but not PECAM-1. (green arrows) Cells expressing PECAM-1 but not GFP. Note that GFP (GATA1) is expressed in a subset of extraembryonic mesoderm cells, in contrast to the broader spectrum of PECAM-1 expression. (D) Flow cytometric analysis of GATA1-GFP embryos (LS-OB) with GFP and cell surface markers VE-cadherin, PECAM-1, or Tie2. Note that GATA1 (GFP)–positive cells coexpress VE-cadherin and Tie2. Images were captured by a Leica DC500 CCD camera with IM50 Imaging Manager. Images in panel A were captured through a Leica MZ FLIII microscope using a PLAN APO 1.0 lens. Images in panels B and C were taken with a Leica DMRXA microscope using a 5×/0.15 NA objective (B) or 20×/0.50 NA objective (C).
GATA1-positive cell population exists as a subset of EC marker–positive cell. (A) GFP expression in GATA1-GFP embryos at no-bud (OB) stage. Line shows a transverse section used for immunohistochemistry (PLAN APO lens, 1.0×/0.125; final magnification, ×63). (B) Immunohistochemical analysis of a transverse section as shown in panel A using anti-GFP antibody shown in green and anti–PECAM-1 antibody shown in red. Merged image is shown. (C) High magnification of the blood island region shown in panel B, Hoechst 33342 staining, anti–PECAM-1 antibody, anti-GFP antibody, and the merged image. (white arrows) Cells expressing GFP but not PECAM-1. (green arrows) Cells expressing PECAM-1 but not GFP. Note that GFP (GATA1) is expressed in a subset of extraembryonic mesoderm cells, in contrast to the broader spectrum of PECAM-1 expression. (D) Flow cytometric analysis of GATA1-GFP embryos (LS-OB) with GFP and cell surface markers VE-cadherin, PECAM-1, or Tie2. Note that GATA1 (GFP)–positive cells coexpress VE-cadherin and Tie2. Images were captured by a Leica DC500 CCD camera with IM50 Imaging Manager. Images in panel A were captured through a Leica MZ FLIII microscope using a PLAN APO 1.0 lens. Images in panels B and C were taken with a Leica DMRXA microscope using a 5×/0.15 NA objective (B) or 20×/0.50 NA objective (C).
Primitive erythropoietic progenitors coexpress PECAM-1, VE-cadherin, Tie2, CD34, and endoglin. (A) Lateral view of a mouse embryo at the EHF stage. Line shows a transverse section (PLAN APO lens, 1.0×/0.125; final magnification, ×40). (B-E) Immunohistochemical staining of a transverse section as shown in panel A using Hoechst 33342 (B blue), anti-Flk1 antibody (C, red), anti-ϵyglobin antibody (D, green), and the merged image (E). (F-K) High magnification of the blood island region stained with Hoechst 33342 (blue), anti-ϵyglobin antibody (green), anti-Flk1 antibody (F, red), anti–VE-cadherin antibody (G, red), anti–PECAM-1 antibody (H, red), anti-Tie2 antibody (I, red), anti-CD34 antibody (J, red), and antiendoglin antibody (K, red). Note that the expression of VE-cadherin, PECAM-1, Tie2, endoglin, and CD34 is observed in globin-producing cells but that the expression of Flk1 is decreased in globin-producing cells. The scale bar indicates 50 μm. Images were captured with a Leica DC500 CCD camera with IM50 Imaging Manager. The image in panel A was taken through a Leica MZFLIII microscope using a PLAN APO 1.0 lens. Images in panels B-K were taken with a Leica DMRXA microscope using a 5×/0.15 NA objective (panels B-E) or a20×/0.50 NA objective.
Primitive erythropoietic progenitors coexpress PECAM-1, VE-cadherin, Tie2, CD34, and endoglin. (A) Lateral view of a mouse embryo at the EHF stage. Line shows a transverse section (PLAN APO lens, 1.0×/0.125; final magnification, ×40). (B-E) Immunohistochemical staining of a transverse section as shown in panel A using Hoechst 33342 (B blue), anti-Flk1 antibody (C, red), anti-ϵyglobin antibody (D, green), and the merged image (E). (F-K) High magnification of the blood island region stained with Hoechst 33342 (blue), anti-ϵyglobin antibody (green), anti-Flk1 antibody (F, red), anti–VE-cadherin antibody (G, red), anti–PECAM-1 antibody (H, red), anti-Tie2 antibody (I, red), anti-CD34 antibody (J, red), and antiendoglin antibody (K, red). Note that the expression of VE-cadherin, PECAM-1, Tie2, endoglin, and CD34 is observed in globin-producing cells but that the expression of Flk1 is decreased in globin-producing cells. The scale bar indicates 50 μm. Images were captured with a Leica DC500 CCD camera with IM50 Imaging Manager. The image in panel A was taken through a Leica MZFLIII microscope using a PLAN APO 1.0 lens. Images in panels B-K were taken with a Leica DMRXA microscope using a 5×/0.15 NA objective (panels B-E) or a20×/0.50 NA objective.
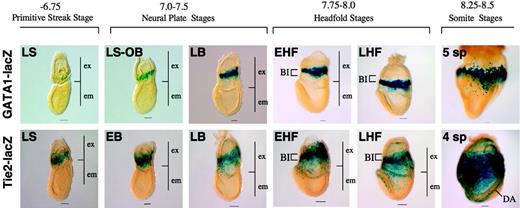
The results reported here are based largely on immunohistochemical analyses. GATA1-lacZ31 and Tie2-lacZ33 transgenic mice express β-galactosidase in a fashion that recapitulates the pattern of expression of endogenous GATA1 and Tie2, respectively. We thus monitored the expression of GATA1 and Tie2 based on the pattern of β-gal expression. This analysis revealed that Tie2 was expressed in the extraembryonic mesoderm during gastrulation and in migrating angioblasts, whereas GATA1 was expressed in the prospective blood island region in a more restricted manner than Tie 2 (Figure 7). Thus, this analysis revealed an expression pattern of Tie2 and GATA1 that was similar to that observed by the immunohistochemical analyses reported here.
Primitive erythropoietic progenitors are enriched in PECAM-1– and Tie2-positive cells. (A) Flow cytometric analysis of a 7.75 dpc wild-type embryo at the late–head fold (LHF) stage using anti–PECAM-1 or Tie2 antibody. (B) Primitive hematopoietic colony assay. Cells from fractions positive or negative for the expression of endothelial markers shown in panel A were subjected to the primitive hematopoietic colony assay.
Primitive erythropoietic progenitors are enriched in PECAM-1– and Tie2-positive cells. (A) Flow cytometric analysis of a 7.75 dpc wild-type embryo at the late–head fold (LHF) stage using anti–PECAM-1 or Tie2 antibody. (B) Primitive hematopoietic colony assay. Cells from fractions positive or negative for the expression of endothelial markers shown in panel A were subjected to the primitive hematopoietic colony assay.
Discussion
Definitive HCs have previously been reported to express EC markers such as VE-cadherin, PECAM-1, Tie2, and CD34,18-20 suggesting that definitive HCs arise from endothelium.16 The expression of EC markers on primitive HCs remains to be confirmed. We report here that VE-cadherin and other EC markers are already coexpressed in a subset of Flk1-positive cells during gastrulation. Use of the hematopoietic colony assay clearly demonstrated that primitive HCs can arise from EC marker–positive cells.
The expression of endothelial (eg, VE-cadherin) and hematopoietic (eg, GATA1) genes by hematopoietic progenitors might be compatible with the interpretation by Gering et al45 —who found that forced expression of Tal1 converts the nonaxial mesoderm to the endothelial lineage in zebrafish but that forced expression of GATA1 and Tal1 convert the nonaxial mesoderm to a hemangioblast lineage—that ECs develop in a default pathway.45 It would be interesting to determine whether enforced expression of GATA1 or other hematopoietic genes could convert endothelial progenitors to hematopoietic cells.
A potential caveat to these studies is that the level of expression of the EC markers we detected was low. However, the whole mount immunohistochemical analysis using anti–PECAM-1 and other antibodies shown in Figure 2 and Figure S1 were performed in the same reaction tube, indicating a comparable level of expression of these EC markers in the ECs at E8.5 and the extraembryonic cells during gastrulation. In addition, β-gal expression driven by the Tie2-lacZ promoter/enhancer recapitulated a pattern of Tie2 expression that was similar to that observed after immunohistochemistry using the anti-Tie2 antibody. Taken together, these results indicate that the level of expression of the EC markers is not low. The functional significance of the expression of these EC markers remains to be determined because none of these genes has been shown to play a role in primitive erythropoiesis.
Tie2 and GATA1 expression in transgenic mice. β-Galactosidase activities driven by the transgene recapitulate endogenous Tie2 and GATA1 protein expression, respectively, in the Tie2-LacZ and GATA1-LacZ transgenic mice. ex indicates extraembryonic region; em, embryonic region. Note that the pattern of Tie2 expression visualized by β-gal activity is similar to the pattern observed after immunohistochemical analysis using an anti-Tie2 antibody. Scale bars indicate 50 μm. All images were captured with a Leica DC500 CCD camera with IM50 Imaging Manager through a Leica MZ FLIII microscope using a PLAN APO 1.0×/0.125 lens (final magnification, ×32 for embryos at somite stages; ×40 for embryos at headfold stages; and ×63 for embryos at streak and neural plate stages).
Tie2 and GATA1 expression in transgenic mice. β-Galactosidase activities driven by the transgene recapitulate endogenous Tie2 and GATA1 protein expression, respectively, in the Tie2-LacZ and GATA1-LacZ transgenic mice. ex indicates extraembryonic region; em, embryonic region. Note that the pattern of Tie2 expression visualized by β-gal activity is similar to the pattern observed after immunohistochemical analysis using an anti-Tie2 antibody. Scale bars indicate 50 μm. All images were captured with a Leica DC500 CCD camera with IM50 Imaging Manager through a Leica MZ FLIII microscope using a PLAN APO 1.0×/0.125 lens (final magnification, ×32 for embryos at somite stages; ×40 for embryos at headfold stages; and ×63 for embryos at streak and neural plate stages).
GATA1 has been shown to play roles in hematopoiesis, including erythropoiesis and megakaryopoiesis, but not vascular development. Given evidence that GATA1-positive cells coexpress EC markers and hematopoietic genes, however, it may be thought that these cells represent a common progenitor, the hemangioblast, for both lineages. Although they did not perform a clonogenic assay, Fujimoto et al46 found that GATA1– and Flk1–double-positive cells have the potential to develop into ECs and primitive HCs during ES cell differentiation. Furthermore, we have observed, with the use of a clonogenic assay in vitro, that the GATA1-positive fraction in the mouse embryo includes hemangioblastic cells that give rise to primitive and definitive HCs and ECs (T.Y., S.T., Naomi Mochizuki, Takahashi Kuroha, M.E., A.W., Ritsuko Shimizu, Osamu Ohneda, Motomi Osata, Hitoshi Okada, Toshihisa Komori, Minetaro Ogawa, Shin-Ichi Nishikawa, Yoshiaki Ito, and M.Y., manuscript submitted). The efficiency of derivation of hemangioblastic cells was 1 of 144 (5 of 720), suggesting that the hemangioblastic cell population was low. To investigate the developmental potential of GATA1-positive cells in vivo, we created GATA1-CreER transgenic animals to perform Cre-loxP lineage tracing experiments (M.E., unpublished data, April 2006). Thus far, we have observed that GATA1-positive cells could only be found among primitive, ϵyglobin-expressing erythroid cells at E8.5, suggesting that most of the GATA1-positive cells had committed to a primitive erythropoietic lineage. Thus, a small fraction of the GATA1-positive cells in the mouse embryo have hemangioblast potential. More extensive studies are required to demonstrate the existence of the hemangioblast in vivo.
PECAM-1 and other EC markers are expressed in a subset of Flk1-positive cells in the extraembryonic mesoderm region during gastrulation, suggesting that the expression of PECAM-1 is induced in a subset of Flk1-positive cells as they enter the extraembryonic region, where the visceral endoderm is well developed. EC marker–positive cells are located in a layer of cells adjacent to the visceral endodermal layer, suggesting that the former may receive an inductive signal from the visceral endoderm. Consistent with this notion, the visceral endoderm is known to be a rich source of secreted molecules, including hedgehog, which is known to be indispensable for vasculogenesis and hematopoiesis.47
Taken together, we have demonstrated that primitive erythropoietic precursors arise from cells expressing PECAM-1, VE-cadherin, Tie2, endoglin, and CD34. These results suggest that primitive and definitive hematopoietic precursors arise from cells expressing VE-cadherin, PECAM-1, CD34, and Tie2. It will be interesting to determine whether a common transcriptional regulatory mechanism underlies these 2 processes.
Authorship
Contribution: M.E. designed and performed research and wrote the paper; T.Y., A.W., and T.T. designed and performed research; M.Y. provided vital reagents; and S.T. designed research and wrote the paper.
Conflict-of-interest disclosure: The authors declare no competing financial interests.
Prepublished online as Blood First Edition Paper, August 22, 2006; DOI 10.1182/blood-2006-03-012872.
The online version of this article contains a data supplement.
The publication costs of this article were defrayed in part by page charge payment. Therefore, and solely to indicate this fact, this article is hereby marked “advertisement” in accordance with 18 USC section 1734.
M.E. thanks M. Hamada and Masanori Hirashima for artwork and helpful comments on this project, respectively. We would like to thank Naomi Kaneko and Masami Ojima for sectioning embryos and technical assistance, respectively.
This work was supported in part by Special Coordination Funds for Promoting Science and Technology.

This feature is available to Subscribers Only
Sign In or Create an Account Close Modal