Key Points
Azacytidine and sorafenib are effective in patients with relapsed and refractory FLT3-mutated AML.
Abstract
Patients received 5-azacytidine (AZA) 75 mg/m2 intravenously daily for 7 days and sorafenib 400 mg orally twice daily continuously; cycles were repeated at ∼1-month intervals. Forty-three acute myeloid leukemia (AML) patients with a median age of 64 years (range, 24-87 years) were enrolled; 37 were evaluable for response. FMS-like tyrosine kinase-3 (FLT3)-internal tandem duplication (ITD) mutation was detected in 40 (93%) patients, with a median allelic ratio of 0.32 (range, 0.009-0.93). They had received a median of 2 prior treatment regimens (range, 0-7); 9 had failed prior therapy with a FLT3 kinase inhibitor. The response rate was 46%, including 10 (27%) complete response with incomplete count recovery (CRi), 6 (16%) complete responses (CR), and 1 (3%) partial response. The median time to achieve CR/CRi was 2 cycles (range, 1-4), and the median duration of CR/CRi was 2.3 months (range, 1-14.3 months). Sixty-four percent of patients achieved adequate (defined as >85%) FLT3 inhibition during their first cycle of therapy. The degree of FLT3 inhibition correlated with plasma sorafenib concentrations. FLT3 ligand levels did not rise to levels seen in prior studies of patients receiving cytotoxic chemotherapy. The combination of AZA and sorafenib is effective for patients with relapsed AML and FLT-3-ITD. This trial was registered at clinicaltrials.gov as #NCT01254890.
Introduction
Internal tandem duplication (ITD) mutations in the juxtamembrane domain of the FMS-like tyrosine kinase-3 (FLT3) gene have been detected in ∼25% of patients with acute myeloid leukemia (AML) in several large, retrospective studies.1 These mutations are associated with leukocytosis, higher marrow blast percentage, and poor outcomes.2-4 Their presence is associated with an increased risk of relapse and a shorter overall survival (OS).2,5 This negative impact also exists in the setting of relapse; patients harboring the FLT3-ITD mutation have a significantly worse outcome in first relapse compared with those without the mutation.6-8
Several novel agents targeting the FLT3 kinase have shown promising activity in patients with AML and mutated FLT3.9-11 These small molecule tyrosine kinase inhibitors (TKIs), such as lestaurtinib (CEP-701), midostaurin (PKC412), and tandutinib (MLN518), have been evaluated either as monotherapy or in combination with cytotoxic chemotherapy.11,12 These agents block the autophosphorylation of the FLT3 kinase, leading to inhibition of cell proliferation and induction of apoptosis. FLT3 inhibitors have been particularly active in patients with FLT3-ITD mutations.13-15 Sorafenib (Nexavar), another small molecule FLT3 TKI, induces pronounced apoptosis in vitro in blast cells from AML patients.12 This promotion of programmed cell death is accompanied by extracellular signal-regulated kinase (ERK)1/2 inactivation and caspase-independent downregulation of MCL-1.12 Sorafenib is an orally active multikinase inhibitor with potent activity against FLT3 and the Raf/ERK/mitogen-activated protein kinase pathway.16 In phase 1 clinical trials, sorafenib significantly reduced the number of leukemia blasts in the peripheral blood (PB) and bone marrow (BM) in patients with the FLT3-ITD mutation.12,17,18 Melzelder and coauthors19 have also reported that sorafenib induced remission and facilitated allogeneic stem cell transplant in patients with refractory AML with the FLT3-ITD mutation.
In vitro studies have demonstrated that FLT3 kinase inhibitors are synergistic with cytotoxic agents when used simultaneously with or immediately after chemotherapy.20 A number of clinical trials combining FLT3 TKIs with traditional chemotherapy have been reported.14,21 In a phase 1/2 study of idarubicin, high-dose cytarabine, and sorafenib in younger patients (median age of 53 years) with AML, all patients with mutated FLT3 achieved complete response (CR) or CR with incomplete platelet recovery (CRp).21 Mutant FLT3 was suppressed in all 10 patients evaluated, with fivefold greater suppression of mutant FLT3 compared with wild-type FLT3 on plasma inhibitory assays.21 This study demonstrated that sorafenib could be safely administered with chemotherapy and result in potent inhibition of FLT3 signaling. However, a German multicenter, randomized, placebo-controlled, double-blind trial of chemotherapy with or without sorafenib in older (>60 years) patients with AML did not show an improvement in CR rate, event-free survival, or OS for the patients receiving sorafenib, and sorafenib was associated with increased toxicity.22
It has been suggested that elevated FLT3 ligand (FL) levels related to aplasia induced by chemotherapy regimens can block the action of TKIs such as sorafenib on the FLT3 kinase or could promote the survival of FLT3-ITD blasts by augmenting signaling from the mutant receptor.11,23,24 We hypothesized that the combination of 5-azacytidine (AZA) with sorafenib may be associated with less resistance by promoting lower levels of FL than traditional chemotherapy regimens. The objectives of this study were to determine the feasibility, safety and efficacy of combining sorafenib with AZA and to determine whether reduced levels of FL associated with AZA will translate to higher responses.
Materials and methods
Study design and eligibility
This phase 1/2 single-arm study was conducted in patients with refractory or relapsed AML from January 2011 to September 2012. The study was approved by the University of Texas–MD Anderson Cancer Center Institutional Review Board, and all participating patients signed an informed consent document in accordance with the Declaration of Helsinki. Patients were ≥18 years of age, had a diagnosis of AML, and needed to have failed prior induction therapy or relapsed after achieving a response to prior therapy; patients >60 years of age who refused standard induction therapy or were deemed unfit for it were also eligible to participate. Other requirements for study entry included an Eastern Cooperative Oncology Group (ECOG) performance status ≤2, adequate hepatic (serum total bilirubin ≤1.5× upper limit of normal [ULN], alanine aminotransferase, and aspartate aminotransferase ≤2.5× ULN), renal (serum creatinine ≤1.5× ULN), and pancreatic (amylase and lipase ≤2× ULN) function. Exclusion criteria included patients with a diagnosis of acute promyelocytic leukemia, known HIV infection, or active viral hepatitis (B or C); evidence of a bleeding diathesis or coagulopathy; and a history of solid organ transplant. Nursing and pregnant females were excluded. In addition, patients were excluded if there was a known history of congestive heart failure greater than class II New York Heart Association, uncontrolled hypertension, malignant disease of the central nervous system, or advanced malignant hepatic tumors. Presence of the FLT3-ITD mutation was not a necessary inclusion criteria but such patients were actively sought for inclusion.
Treatment regimen
Initially, to assess the safety of the combination, patients were treated with a low dose of sorafenib (200 mg orally twice daily) in combination with AZA. After 3 patients were evaluated without any significant toxicity observed, all patients were enrolled in the phase 2 part of the study and received sorafenib 400 mg orally twice daily. They received AZA 75 mg/m2/day subcutaneously or intravenously daily for 7 days per cycle without any interruptions; in addition, sorafenib was given orally twice daily continuously every cycle starting on day 1 of AZA. Cycles were repeated every 4 to 8 weeks at the discretion of the treating physician. In general, and in the absence of significant toxicity, sorafenib was continued without interruption even if the AZA administration was delayed (eg, due to cytopenias). A minimum of 1 full cycle (defined as AZA for 7 days and sorafenib for 28 days) was required for a patient to be eligible for evaluation of efficacy. Any patient who received ≥1 dose of either drug was considered evaluable for toxicity. After the first 3 cycles of therapy, subsequent cycles of AZA were administered only if the absolute neutrophil count was ≥1 × 10⁹/L, and platelets were ≥30 × 109/L in the absence of residual leukemia in the BM. If prolonged myelosupression (>60 days) with evidence of a hypocellular marrow (marrow cellularity <5% without evidence of leukemia) was observed, lower doses of AZA could be administered if approved by the principal investigator. Concomitant use of strong CYP3A4 inducers within 7 days of initiating dosing was prohibited. However, the use of azoles such as voriconazole and posaconazole was not prohibited. Intrapatient dose escalation with shortening the interval between AZA courses was allowed if it was felt to be in the best interest of the patient (eg, if there was a perceived or real rise in peripheral blasts). All patients received antimicrobials, supportive care, and transfusions of blood products according to the institutional guidelines.
Laboratory correlative studies
Whole blood at designated time points was collected into heparinized vacuum tubes, and after centrifugation, the plasma was stored frozen. In vivo FLT3 inhibition was determined using a surrogate ex vivo assay, the plasma inhibitory activity (PIA) assay, as previously described, using the Molm-14 cell line (human AML with a naturally occurring FLT3-ITD mutation).25 First, the frozen plasma samples were thawed and clarified by centrifugation. For each sample, ∼3 × 10⁶ Molm-14 cells were suspended in 1 mL of patient plasma. The suspension was incubated for 1 hour at 37°C. The cells were subsequently washed twice with ice-cold phosphate-buffered saline and lysed, and immunoprecipitation and phospho-FLT3 (P-FLT3) immunoblotting was carried out as described. Densitometry was used to calculate the relative level of P-FLT3 in each plasma sample. The density of each band was expressed as a percentage of the density of the baseline plasma band for each patient or the density of the control plasma band.
FL concentrations in plasma samples were determined using an enzyme-linked immunosorbent assay kit obtained from R & D Systems (Minneapolis, MN) as previously described.23
Sorafenib and sorafenib N-oxide concentrations were determined using a validated liquid chromatography/tandem mass spectrometry method, as previously described.26
FLT3-ITD mutation status was determined in DNA from initial, follow-up, and relapsed unsorted BM aspirate samples by a polymerase chain reaction–based method with an analytical sensitivity of 1% to 2% mutation-bearing cells. FLT3 allele burden was determined by ratio of the area under the mutated and unmutated polymerase chain reaction amplicon peaks detected following capillary electrophoresis on 3100 or 3130 Genetic Analyzers (Applied Biosystems, Foster City, CA). Manual 400-cell differential performed on smears and multicolor flow cytometry on aspirate samples was used to track the levels of residual leukemia blasts. When leukemic blasts were detected, FLT3 mutant ratios23 were normalized to blast count.
Response assessment
CR was defined by the presence of <5% blasts in the BM, with >1 × 10⁹/L neutrophils and >100 × 109/L platelets in the PB with no detectable extramedullary disease.27 Patients who met the above criteria but had neutrophil or platelet counts less than the stated values were considered to have achieved CRi (CR with incomplete recovery of PB counts). Partial response (PR) required all of the hematologic values for a CR but with a decrease of ≥50% in the percentage of blasts to 5% to 25% in the BM aspirate. CR duration was calculated from the time of achieving CR until relapse. Relapse was defined by the recurrence of >5% blasts in BM aspirate not related to count recovery or the development of extramedullary disease. OS was calculated from the time of diagnosis until death. Patients were censored at the time of last contact with healthcare professionals at our institution.
Statistical analysis
Survival curves were plotted by the Kaplan-Meier method and compared using the log-rank test. Differences in subgroups by different covariates were evaluated using the χ2 test for nominal values and the Mann-Whitney U and Fischer’s exact test for continuous variables. In the PIA analysis, the log-rank (Mantel-Cox) test was used to evaluate the survival curves for statistical significance.
Results
Patient characteristics
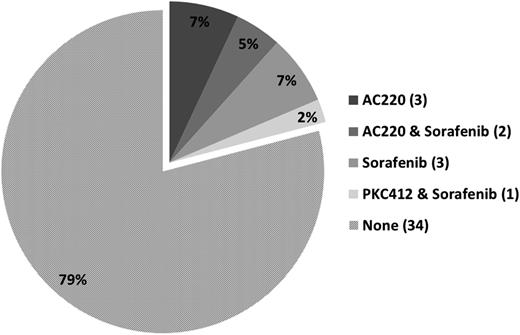
Between January 2011 and September 2012, a total of 43 patients with AML meeting the eligibility criteria were enrolled. Six patients were inevaluable as they discontinued therapy before response assessment at 1 month. Pretreatment characteristics of the evaluable patients are summarized in Table 1. Their median age was 64 years (range, 24-87 years). Karyotype included 19 (44%) patients with diploid cytogenetics, 11 (26%) with chromosome 5/7 or complex cytogenetic abnormalities, and 13 (30%) with other miscellaneous chromosomal abnormalities. FLT-3-ITD was detected prior to the initiation of treatment in 40 of 43 (93%) patients with a median allelic burden of 0.32 (range, 0.009-0.93) in those with FLT3-ITD. Patients had received a median of 2 prior treatments (range, 0-7) including 16 (37%) patients who had received ≥3 prior regimens. Among the 37 evaluable patients, 6 had no prior therapy, 12 were primarily refractory to their previous induction regimen, and 19 had relapsed after prior therapy. Nine patients had failed prior therapy with FLT3 kinase inhibitors (5 with AC220, 1 with PKC412, and 6 with sorafenib, either as monotherapy or together with chemotherapy or plerixafor); 3 had failed 2 prior FLT3 inhibitors (Figure 1). Seven patients had received a prior allogeneic stem cell transplant.
Patient characteristics
| Characteristics . | No. of patients (%) . |
|---|---|
| Total enrolled | 43 |
| Median age in years [range] | 64 [24-87] |
| Male: female | 22 (51):21 (49) |
| Median WBC × 109/L [range] | 8.9 [0.4-107.8] |
| Median percentage blasts in PB [range] | 51 [0-99] |
| Median percentage blasts in BM [range] | 66 [2-98] |
| Cytogenetics | |
| Diploid | 19 (44) |
| Chromosome 5 or 7/complex | 11 (26) |
| Miscellaneous | 13 (30) |
| Median no. prior therapy [range] | 2 [0-7] |
WBC, white blood cell count.
Response and outcomes
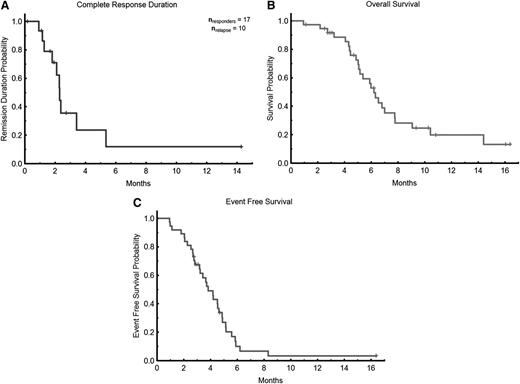
The overall composite response rate among the evaluable patients was 46% (Table 2), including 6 (16%) with CR, 10 (27%) with CRi, and 1 (3%) with PR (in this patient, BM blasts declined from 66% to 6% with normalization of blood counts). Overall, patients received a median of 3 (range, 1-18) treatment cycles. Among the responders, the median number of cycles to response was 2 (range, 1-4), and the median time to achieving response was 2 months (range, 1-4.6 months). Response rate was higher in previously untreated patients (4 of 6 [67%] patients including 1 with CR, 2 with CRi, and 1 with PR) compared with primary refractory patients (7 of 12 [58%] patients including 3 CR and 4 CRi) and compared with relapsed patients (6 of 19 [32%] patients including 2 CR and 4 CRi; P = not significant). The median duration of response was 2.3 months (range, 1-14.3 months; Figure 2A). Six patients have proceeded to allogeneic stem cell transplant, including 2 non-responders. With a median follow-up of 5.5 months (range, 1-16 months), the median OS for all evaluable patients is 6.2 months (Figure 2B) with a longer OS of 7.8 months for responders vs 6.0 months for nonresponders (P = .01). Of the 16 responding patients, 3 relapsed after 1 month in remission, an additional 6 relapsed after 3 months in remission, 4 underwent stem cell transplant, and 7 remain in CR at last follow-up. The median event free survival was 3.8 months (range, 1.0-16.4 months; Figure 2C).There was no statistical difference for the duration of response or OS between previously untreated, primary refractory, or relapsed patients (data not shown).
Overall response
| Parameter . | N = 37 (%) . |
|---|---|
| Median no. cycles received [range] | 3 [1-18] |
| Median follow-up in weeks [range] | 24 [5-71] |
| Response | |
| CR | 6 (16) |
| Cri | 10 (27) |
| PR | 1* (3) |
| NR | 18 (49) |
| Died | 2 (5) |
| Median no. cycles to response [range] | 2 [1-7] |
| 4-wk mortality | 1 (3) |
| 8-wk mortality | 1 (3) |
Patient’s BM blast percentage fell from 66% to 6% with normalization of peripheral counts.
Patient outcomes. (A) Remission duration in responders. (B) OS. (C) Event-free survival.
Patient outcomes. (A) Remission duration in responders. (B) OS. (C) Event-free survival.
Among the patients who had received prior therapy with FLT3 kinase inhibitors, 3 with prior sorafenib therapy (including 1 patient who had also received prior PKC412 and 1 patient who had also received prior AC220) achieved CR (1) or CRi (2), with a CR/CRi duration of 1.7, 5.4, and 5.6+ months. One died in CRi at 1.7 months and 1 relapsed after 5.4 months, with the third patient continuing in CR. Six other patients with prior FLT3 kinase therapy did not respond.
Safety and toxicity
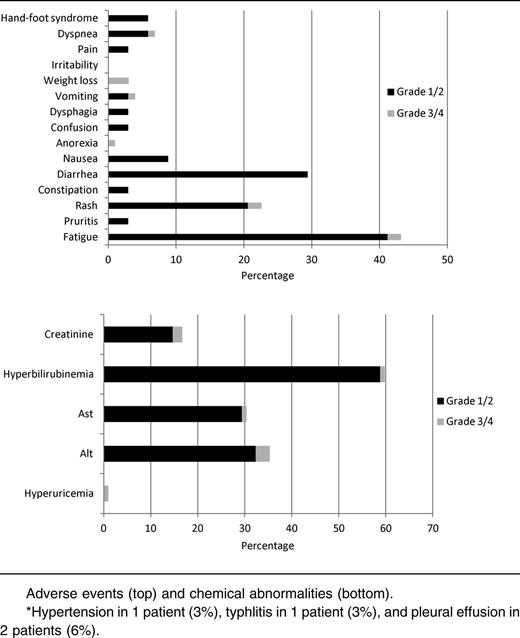
The majority (53%) of patients experienced grade <3 adverse effects attributable to sorafenib (Table 3). The most common grade ≥3 adverse events were thrombocytopenia, neutropenia, anemia, and neutropenia with fever or infection. Only 4 of 18 (22%) of patients with grade ≥3 hematologic adverse effects had normal PB counts prior to initiation of the study. Only 1 patient discontinued treatment because of a grade 4 nonischemic (proven by cardiac catheterization) cardiomyopathy. Although hepatotoxicity was seen, most instances were grade 1 or 2. Fatigue was the most common adverse event overall (47%) but was most often grade 1 (29%) in severity. Overall, the 4-week mortality was 9% (4 of 43 patients enrolled), and the 8-week mortality was 16% (7 of 43). Among patients evaluable for response, the 4-week mortality was 3% (1 of 37), and the 8-week mortality was 3% (1 of 37), with all 6 deaths occurring during the study treatment resulting from infection. Reduction of the dose and/or duration of AZA (to 75 mg/m2 daily for 5 days [n = 3] or 50 mg/m2 daily for 5 days [n = 1]) occurred in 4 patients due to gastrointestinal toxicity or myelosuppression that was deemed to be related to therapy.
Correlation of response with FLT3 kinase inhibition and pharmacokinetic studies
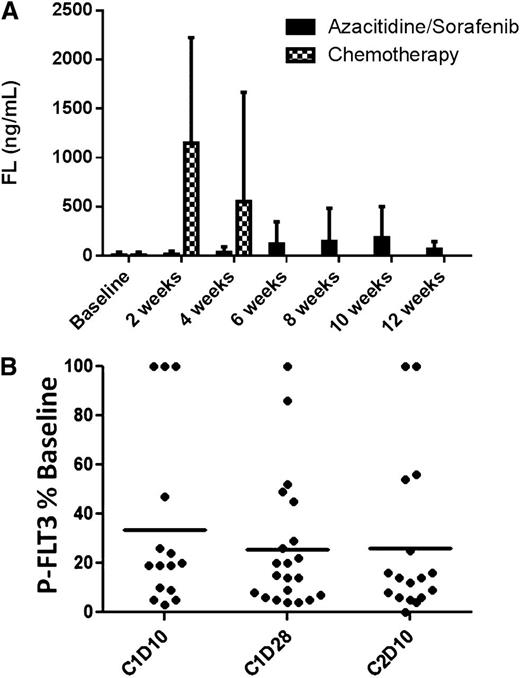
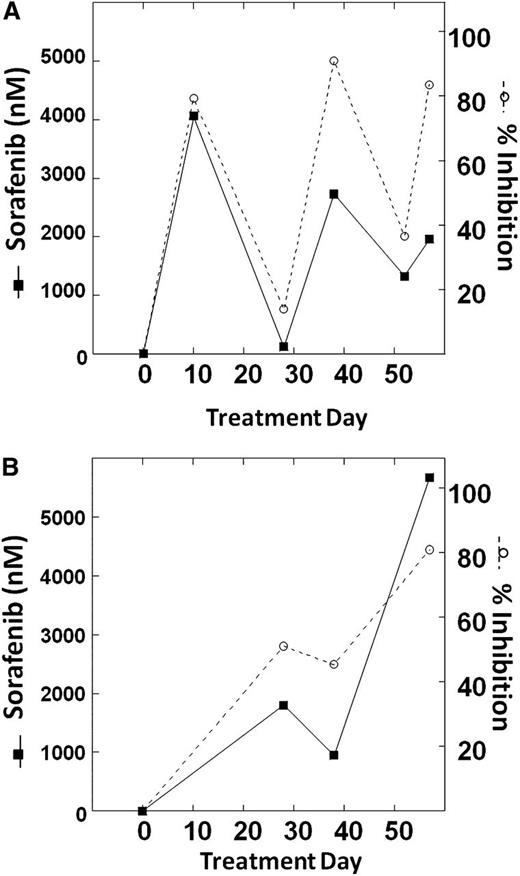
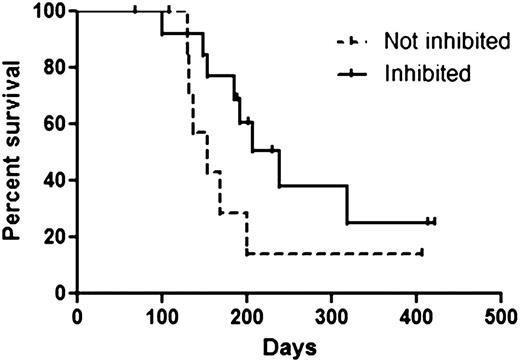
Among the patients included in the clinical analysis, there were 22 patients for whom both clinical outcome data and plasma samples spanning ≥1 cycle of therapy were available. These 22 patients were included in our analysis of FLT3 inhibition and FL concentrations. As predicted, the relatively low-intensity therapy with AZA resulted in minimal or no increase in plasma FL levels (Figure 3A). The levels of FL observed following intensive chemotherapy (data from the Cephalon 204 trial of chemotherapy followed by lestaurtinib24 ) are shown for comparison. Mean FL concentrations at baseline and at the end of cycles 1, 2, and 3 were 8, 35, 149, and 65 ng/mL, respectively. Median FL levels at the same time points were 0, 16, 24, and 46 ng/mL, respectively. In vivo FLT3 inhibition, as determined by the PIA assay (Figure 3B), was highly variable. Sorafenib concentrations, determined in a limited subset of these samples, showed a relatively tight correlation with the degree of in vivo FLT3 inhibition (Figure 4). This suggests that the variability in FLT3 inhibition in vivo was primarily due to variable sorafenib levels. In vitro studies of other FLT3 inhibitors suggest that FLT3 inhibition to <15% of baseline activity is necessary for optimal cytotoxicity. Therefore, this level was used as the threshold for adequate FLT3 inhibition in the current trial. In this study, 64% of patients achieved FLT3 inhibition to >15% of baseline at some point during their first cycle of therapy. Median survival in patients who achieved this degree of inhibition was 238 days. Median survival in patients who did not reach this level was 154 days. The difference in survival did not attain statistical significance (P = .13; Figure 5).
FL levels and in vivo FLT3 inhibition. (A) Plasma FL levels determined by enzyme-linked immunosorbent assay using samples collected from the current trial of 5-azacitidine/sorafenib (solid columns). For comparison (hatched columns) is shown FL levels from plasma samples collected from relapsed/refractory FLT3-ITD AML patients on the Cephalon 204 trial24 2 or 4 weeks after starting salvage chemotherapy (mitoxantrone/etoposide/cytarabine). (B) FLT3 inhibition grouped according to treatment time point. PIA assays (see Materials and methods) were performed on individual plasma samples collected during therapy. Densitometry measurements from individual FLT3 PIA assays are plotted against time point. The solid lines indicate the mean level of P-FLT3 for the patient group at each time point. C, cycle; D, day.
FL levels and in vivo FLT3 inhibition. (A) Plasma FL levels determined by enzyme-linked immunosorbent assay using samples collected from the current trial of 5-azacitidine/sorafenib (solid columns). For comparison (hatched columns) is shown FL levels from plasma samples collected from relapsed/refractory FLT3-ITD AML patients on the Cephalon 204 trial24 2 or 4 weeks after starting salvage chemotherapy (mitoxantrone/etoposide/cytarabine). (B) FLT3 inhibition grouped according to treatment time point. PIA assays (see Materials and methods) were performed on individual plasma samples collected during therapy. Densitometry measurements from individual FLT3 PIA assays are plotted against time point. The solid lines indicate the mean level of P-FLT3 for the patient group at each time point. C, cycle; D, day.
Plasma levels of sorafenib versus in vivo FLT3 inhibition. Plasma levels of sorafenib at individual time points from 2 different patients are compared with the results of PIA assays from those same time points. The PIA results are expressed inversely, as percent inhibition. (A) and (B) represent results from 2 different patients.
Plasma levels of sorafenib versus in vivo FLT3 inhibition. Plasma levels of sorafenib at individual time points from 2 different patients are compared with the results of PIA assays from those same time points. The PIA results are expressed inversely, as percent inhibition. (A) and (B) represent results from 2 different patients.
Survival grouped by PIA assay results. The Inhibited group consisted of 14 patients whose P-FLT3 levels were <15% of baseline at ≥1 point during the first cycle of therapy. The Not inhibited group consisted of 8 patients whose P-FLT3 levels were never less than 15% of baseline during the first cycle of therapy. Although there was a trend toward improved survival in the Inhibited group, this finding did not reach statistical significance.
Survival grouped by PIA assay results. The Inhibited group consisted of 14 patients whose P-FLT3 levels were <15% of baseline at ≥1 point during the first cycle of therapy. The Not inhibited group consisted of 8 patients whose P-FLT3 levels were never less than 15% of baseline during the first cycle of therapy. Although there was a trend toward improved survival in the Inhibited group, this finding did not reach statistical significance.
Correlation of response with FLT3-ITD allele burden
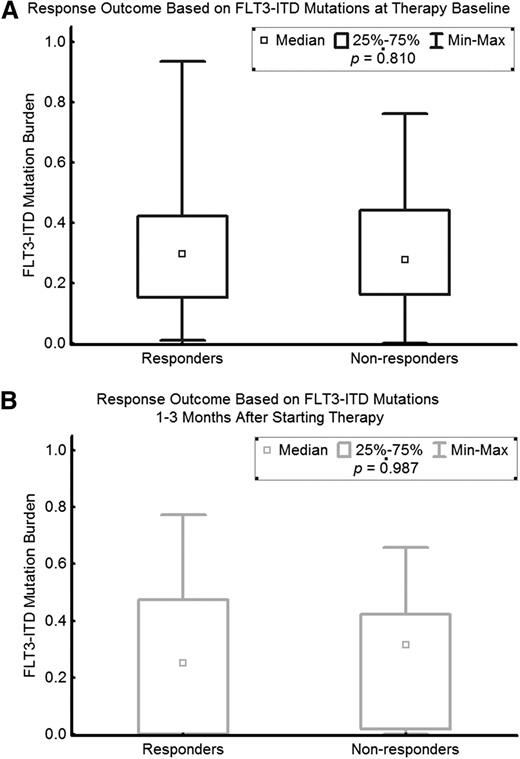
The FLT3-ITD burden prior to therapy was not significantly different among the responders and nonresponders. Similarly, at 1 to 3 months after therapy, the levels of FLT3-ITD allele burden were similar between responders and nonresponders (Figure 6).
Outcomes by FLT3-ITD allele burden. (A) Baseline FLT3-ITD mutation burden of responders vs nonresponders. (B) FLT3-ITD mutation burden of responders versus nonresponders at 1 to 3 months after treatment initiation.
Outcomes by FLT3-ITD allele burden. (A) Baseline FLT3-ITD mutation burden of responders vs nonresponders. (B) FLT3-ITD mutation burden of responders versus nonresponders at 1 to 3 months after treatment initiation.
Discussion
The treatment of patients with primary refractory or relapsed AML remains unsatisfactory.28 FLT3-ITD mutations are associated with an inferior response to salvage therapy and a poor outcome at relapse.6,7,29 A number of FLT3 kinase inhibitors are in development and have been evaluated in patients with FLT3 mutated AML. A large randomized trial combining lestaurtinib with chemotherapy did not improve the outcome of patients with FLT3 mutated AML in first relapse.24 However, the investigators noted that patients who achieved adequate target inhibition were more likely to respond and benefit from the addition of lestaurtinib. Furthermore, the authors suggested that elevated levels of FL may be associated with resistance to lestaurtinib.23,24
Sorafenib has demonstrated activity in patients with relapsed and refractory AML.19 However, responses are of limited duration, and a number of mechanisms of resistance to FLT3 inhibition have been demonstrated in preclinical and clinical studies.23,30,31 We have previously demonstrated a high response rate to the combination of sorafenib with cytarabine and anthracycline-based induction therapy in formerly untreated younger patients with AML.21 The responses were of limited duration, with more than half of patients with the FLT3-ITD mutation relapsing at a median follow-up of 9 months. The median CR duration was 8.5 months.32 We hypothesized that a regimen combining sorafenib with AZA was less likely to be associated with elevated FL levels, and hence, less likely to be associated with development of resistance to FLT3 inhibition.
Furthermore, we hypothesized that the combination may be associated with differentiation of the leukemic cells. Normal myeloid differentiation involves CCAAT/enhancer-binding protein α (C/EBPα) and PU.1 expression.33,34 FLT3-ITD mutations lead to differentiation arrest by inhibiting expression of these transcription factors compared with wild-type FLT3 (FLT3-WT).35,36 Targeting of transcription factors by FLT3-ITD signaling has been confirmed by microarray expression profiling.37 Recent mouse models have shown that FLT3 inhibitors like lestaurtinib induce differentiation in FLT3 mutated AML cells through suppression of C/EBPα.36 In vitro models of FLT3 inhibition have demonstrated that in the BM microenvironment, FLT3 inhibition does not induce immediate apoptosis. Rather, FLT3 inhibition promotes differentiation, and this differentiation is dependent on the expression of functional C/EBPα.38 Others have demonstrated that activating mutations of FLT3 block C/EBPα function by ERK1/2 mediated phosphorylation of its serine 21 residue, leading to the differentiation block in the leukemia cells.39 The demethylating agents decitabine and AZA also have clearly demonstrable differentiation-inducing properties.40-42 AZA, as well as histone deacetylase inhibitors, has been shown not only to maintain normal hematopoietic stem cell renewal but also to induce terminal differentiation in AML cells.41,43 We hypothesized that the combination of FLT3 inhibition with hypomethylation therapy might be synergistic in inducing differentiation in vivo. We saw clinical evidence of differentiation in several patients during the course of therapy as demonstrated by a single case provided in the supplemental Materials on the Blood website.
Several mechanisms of resistance to FLT3-TKIs have been proposed. Most prominently, the acquisition of mutations in the ATP-binding pocket of FLT3 inducing clinical resistance to FLT3 inhibitors has now been reported.11,30 We did not systemically evaluate the patients at relapse for the development of such mutations. Other mechanisms of resistance include activation of compensatory survival pathways (eg, through activating NRAS mutations) that render leukemic cells independent of FLT3,44 as well as enhanced activation of signal transducer and activator of transcription pathways and overexpression of survivin.45 Last, autocrine and/or paracrine FLT3 receptor stimulation via FL can lead to resistance to FLT3 inhibitors. Increased FL expression has been demonstrated in response to standard myelosuppressive chemotherapy.23
In prior studies, FL levels have been demonstrated to rise markedly during the aplasia caused by chemotherapy.23,46,47 In this study of AZA and sorafenib, FL levels did not rise to the levels seen in prior studies of FL levels in patients receiving cytotoxic chemotherapy. High FL levels have been shown to impede the efficacy of FLT3 inhibitors including sorafenib.23 Therefore, it has been postulated that treatment regimens that do not cause abrupt increases in FL levels may create a more favorable environment for FLT3 inhibition.23 In the current study, it appears that low FL levels are not sufficient to foster optimal activity of the FLT3 inhibitor sorafenib. As noted above, other factors may have been responsible for suboptimal FLT3 inhibition in some patients.
In the current study, FLT3 inhibition was variable. There was a sizable subset of patients who achieved excellent FLT3 inhibition and sustained this inhibition. While not statistically significant, our survival curve shows a trend toward improved survival in patients with adequate FLT3 inhibition during cycle 1. The small number of patients with evaluable clinical outcomes and sufficient plasma samples may have been an important limitation to this survival analysis. On the other hand, 36% of patients did not meet the threshold for FLT3 inhibition during the first month of therapy. Moreover, when FLT3 inhibition occurred, it was not always sustained. There are several possible explanations for the failures to achieve adequate FLT3 inhibition in some cases. First, sorafenib concentrations can be variable in patients receiving this medication, possibly due to age, gender, and effects of concomitant medications (chemotherapy or CYP3A4 inhibitors) on the metabolism of the drug.25,26,48 Variability in FLT3 inhibition as assessed by the PIA assay has previously been noted with sorafenib.26 Second, some patients in the current study were administered reduced doses of sorafenib due to toxicity. Finally, the plasma concentration of sorafenib required to inhibit FLT3 is significantly higher than the inhibitory concentration of newer agents such as quizartinib.49
Previous studies have reported the feasibility of combining sorafenib and chemotherapy.21,37 Serve et al22 randomized 197 elderly patients with AML to receive either placebo or sorafenib with the standard “3+7” induction chemotherapy. The addition of sorafenib did not improve event-free survival or OS and was associated with increased toxicity. Here we demonstrated that the combination of AZA plus sorafenib is effective and well tolerated, producing a high number of responses in patients with relapsed/refractory FLT3-ITD AML, a condition for which treatment alternatives are limited and associated with poor outcomes. Future studies should evaluate this combination and other combinations of demethylating agents with FLT3 kinase inhibitors both in the relapse and frontline settings.
The online version of this article contains a data supplement.
The publication costs of this article were defrayed in part by page charge payment. Therefore, and solely to indicate this fact, this article is hereby marked “advertisement” in accordance with 18 USC section 1734.
Acknowledgments
This work was supported by a research grant from Celgene and in part by National Cancer Institute (NCI) Leukemia Specialized Program of Research Excellence grant P50 CA100632. This work was also supported by grants from the NCI (NCI Leukemia Special Program of Research and Education P50 CA100632-06, R01 CA128864) and the American Society of Clinical Oncology (M.L.). M.L. is a Clinical Scholar of the Leukemia and Lymphoma Society. The project described was supported by the Analytical Pharmacology Core of the Sidney Kimmel Comprehensive Cancer Center at Johns Hopkins (National Institutes of Health, National Cancer Institute grants P30 CA006973 and UL1 RR025005 and Shared Instrument grant 1S10RR026824-01).
The content is solely the responsibility of the authors and does not necessarily represent the official views of the National Cancer Institute or the National Institutes of Health.
Authorship
Contribution: M.L.A. collected and analyzed data and wrote the manuscript; M.L., M.R.G., T.R., and M. A. Rudek conducted in vitro experiments, analyzed data, and wrote the manuscript; H.K., N.D., G.G.-M., S.F., M.K., G.B., J.B., A.N., M.A., T.K., and J.C. treated patients on the trial and critically reviewed the manuscript; M. A. Richie, S.P., and S.D. collected and analyzed clinical data; and F.R. designed the research, collected and analyzed the data, and wrote the manuscript.
Conflict-of-interest disclosure: F.R. received research funding and honoraria from Onyx/Bayer and Celgene. G.G.-M. received research funding and honoraria from Celgene. J.C. received research funding from Celgene. M. A. Rudek received research funding from Celgene. The remaining authors declare no competing financial interests.
Correspondence: Farhad Ravandi, Department of Leukemia, Unit 428, The University of Texas MD Anderson Cancer Center, 1515 Holcombe Blvd, Houston, TX 77030; e-mail: fravandi@mdanderson.org.
References
Author notes
F.R. and M.L.A. contributed equally to this study.

