Key Points
T cells recognizing yeast and mold can be rapidly manufactured using CD137 activation marker selection and short-term in vitro expansion.
T cells recognizing fungal antigens presented on fully and partially HLA-matched HLA DRB1 molecules have antifungal activity in vivo.
Abstract
Invasive fungal infections are a major cause of disease and death in immunocompromised hosts, including patients undergoing allogeneic hematopoietic stem cell transplant (HSCT). Recovery of adaptive immunity after HSCT correlates strongly with recovery from fungal infection. Using initial selection of lymphocytes expressing the activation marker CD137 after fungal stimulation, we rapidly expanded a population of mainly CD4+ T cells with potent antifungal characteristics, including production of tumor necrosis factor α, interferon γ, interleukin-17, and granulocyte-macrophage colony stimulating factor. Cells were manufactured using a fully good manufacturing practice–compliant process. In vitro, the T cells responded to fungal antigens presented on fully and partially HLA-DRB1 antigen–matched presenting cells, including when the single common DRB1 antigen was allelically mismatched. Administration of antifungal T cells lead to reduction in the severity of pulmonary and cerebral infection in an experimental mouse model of Aspergillus. These data support the establishment of a bank of cryopreserved fungus-specific T cells using normal donors with common HLA DRB1 molecules and testing of partially HLA-matched third-party donor fungus-specific T cells as a potential therapeutic in patients with invasive fungal infection after HSCT.
Introduction
Invasive fungal diseases (IFDs) occur most commonly in patients with hematological malignancy, including those undergoing hemopoietic stem cell transplantation (HSCT).1-4 In HSCT patients, Aspergillus fumigatus is the most common IFD-associated pathogen, followed by invasive candidiasis, zygomycosis, and other molds.2,3,5 The 1-year mortality associated with IFDs in HSCT patients can be ≤90%.2 Despite progress in the development of effective and safe antifungal drugs,6-8 in recent years, there has been emergence of increasing fungal drug resistance9 and breakthrough infections with rarer fungal pathogens such as Fusarium, Scedosporium, Zygomycetes, and nonalbicans Candida species10-13 that are less susceptible to current treatments.14,15
Recovery of functional adaptive antifungal immunity correlates with resolution of IFD after HSCT.16,17 However, regeneration of functional adaptive immunity after HSCT can be slow, especially in the setting of graft-versus-host disease, ongoing immunosuppressive treatment, and HLA mismatch. Adoptive transfer of virus-specific T cells (including partially HLA-matched virus-specific T cells from banks of normal third-party donors) has excellent therapeutic effects in severe post-HSCT viral infection,18-33 raising the possibility that a similar approach could be effective for IFDs occurring after HSCT.
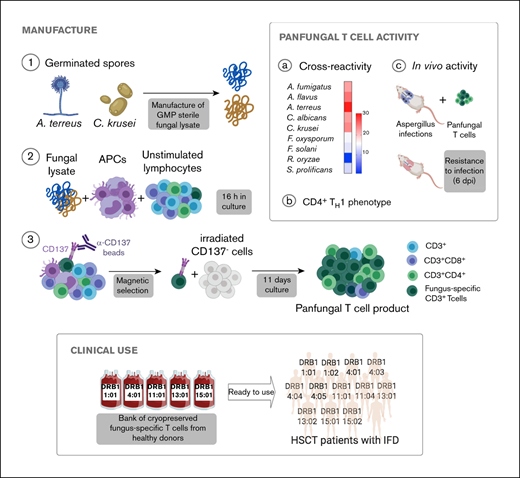
Here, we describe a new good manufacturing practice–compliant method for rapid expansion of fungus-specific T cells and present evidence that these cells retain antifungal activity even when there is only partial HLA matching between T cells and fungal targets. These data support the development and testing of a bank of fully characterized third-party partially HLA-matched fungus-specific T cells as a therapeutic option for patients with IFD not responding to standard antifungal drugs and suggest that adoptive transfer of antifungal T cells may improve clinical outcomes in patients with IFDs after HSCT.
Methods
Ethics approval and donors
The project was approved by the Western Sydney Local Health District Human Research Ethics Committee. All participants gave written informed consent. Haemopoietic progenitor cells were from healthy individuals donating for HSCT whose stem cells had been mobilized by the administration of granulocyte colony-stimulating factor. Hemopoietic progenitor cells (HPCs) were platelet reduced by washing in phosphate-buffered saline (PBS) (Lonza) containing 1% human albumin. High-resolution tissue typing for HLA-A, HLA-B, and DR alleles was done as part of routine testing pre-HSCT by the Australian Red Cross Blood Service (Alexandria, NSW, Australia) (supplemental Table 1).
Culture of fungus-specific T cells
Platelet-reduced HPCs were incubated with 40 µg/mL fungal lysates of A fumigatus, Aspergillus terreus, Candida krusei, or/and Rhizopus oryzae, alone or in combination, with 1 µg/mL of anti-CD28 pure reagent (Miltenyi Biotech) in complete AIM-V medium (Gibco) supplemented with 10% heat-inactivated autologous plasma for 16 to 18 hours. Following incubation, cells were labeled with CD137 antibody conjugated to phycoerythrin (PE), washed, and then incubated with a magnetic anti-PE reagent (Miltenyi Biotech). CD137+ cells were selected using a MS magnetic column (Miltenyi Biotech). The CD137+-enriched population was resuspended in complete AIM-V medium and plated in a G-Rex cell culture plate. The CD137− cell population was irradiated at 30 Gy and cocultured with the CD137+-enriched population in AIM-V medium with 20 U/mL interleukin-2 (IL-2), 200 U/mL IL-7, and 200 U/mL IL-15 at 37°C and 5% CO2. Cytokines were replenished every 2 or 3 days. Fungal T-cell cultures were maintained for a total of 11 to 12 days or on occasion were restimulated and maintained for ≤20 days.
Preparation of fungal lysates
Fungal lysates used for manufacturing of fungal T cells were prepared as previously described.34,35 Briefly, pure strains of fungi isolated from the environment (A terreus) or clinical specimens (C krusei and R oryzae) were subcultured on potato dextrose agar plates for 3 to 5 days. Spores were separated from hyphal fragments by passing through 40-μm pore filters, germinated in potato dextrose medium, washed with sterile water, and then homogenized using 0.5-mm SiLibeads ceramic beads (Sigmund Lindner, Warmensteinach, Germany). Fungal lysates were clarified by centrifugation and passed through 0.22-μm sterile filters. Protein content was measured using bicinchoninic acid protein assay kit. Lysates were tested for endotoxin and toxicity was measured quantitatively in fresh peripheral blood mononuclear cells (PBMCs) using Annexin-V fluorescein isothiocyanate (BD Biosciences, San Jose, CA) and propidium iodide. Magnetic-activated cell sorting good manufacturing practice A fumigatus lysate was purchased from Miltenyi Biotech.
Preparation of MoDCs for fungal T-cell culture restimulation assays
Three to 5 days before restimulation, autologous monocyte-derived dendritic cells (MoDCs) were thawed and suspended in DendriMACS (Miltenyi Biotec) supplemented with 1000 U/mL granulocyte-macrophage colony stimulating factor (GM-CSF) and 1000 U/mL IL-4. MoDCs were activated with 100 U/mL tumor necrosis factor α (TNF-α) and pulsed with 10 µg/mL fungal lysate 16 to 24 hours before fungal T-cell activation. MoDCs activated with 100 U/mL of TNF-α served as negative controls (DC control).
Flow cytometry
Flow cytometry was performed using monoclonal antibodies directed against CD3, CD4, CD8, CD14, CD19, CD56, CD62L, CD45RA, Tim-3, PD-1, and CTLA-4 (supplemental Table 2; BD Biosciences). Fungal antigen specificity was assessed by intracellular cytokine flow cytometry as previously described.36 T cells and MoDCs were mixed at a 5:1 ratio and cultured in the presence of antibodies to CD28 and CD49d (BD Biosciences). Extracellular release of cytokines was blocked with 1 µg/mL brefeldin A and 2 µg/mL monensin (BD Biosciences). Cells were stained with Zombie NIR fixable viability dye (BioLegend) and surface antibodies and then fixed, permeabilized, and stained for intracellular molecules (interferon-γ [IFN-γ], TNF-α, IL-17A, IL-9, CD154, and CD137). A FACSCanto II or LSR Fortessa (BD Biosciences) flow cytometer was used for acquisition with FlowJo software (version 10.0.8r1; Tree Star, Ashland, OR) for analysis.
TCR repertoire analysis
A fumigatus T cells mixed with A fumigatus–pulsed DCs were cultured overnight in the presence of 1 µg/mL CD40 (Miltenyi Biotec). RNA was purified from 100 000 CD3+CD4+CD154+ cells sorted on a FACSAria (BD Biosciences) using RNAmicro plus kit (Qiagen) according to the manufacturer’s instructions. Complementary DNA synthesis was performed on 2.5μL of RNA and polymerase chain reaction (PCR) products were purified with AMPure XP beads (Agencourt), T -cell receptor (TCR-β) specific PCR was performed with a primer targeting the constant region of the TCR-β chain and a forward primer (ADP_fwd) against a 5′ incorporated template switch oligo (supplemental Table 3). Complete adapter sequences and sample barcodes were added using the primers from the Illumina Nextera Index Kit (Illumina). PCR amplification was performed using the Q5 High-Fidelity DNA Polymerase kit (New England BioLabs) and sequencing on the Illumina MiSeq platform using the MiSeq Reagent Kit v3. Reads were aligned for detection of V (D) and J gene segments and CDR3 amino acid sequences using MIXCR.37
Cytokine array
Cryopreserved panfungal T cells were thawed, mixed with control DCs or C krusei and A terreus–pulsed DCs and cultured in AIM-V medium for 16 h. Conditioned medium from panfungal T-cell cultures was hybridized with antibody-coated membranes (Cytokine Human Membrane Antibody Array kits; Abcam, Cambridge, MA). A biotin-conjugated second antibody was used and cytokines were detected by horseradish peroxidase–conjugated streptavidin. Signals were measured using ChemiDoc XRS detection system (Bio-Rad) driven by Quantity One software. ImageJ (Dot Blot Analyzer) was used for determining the area and density of target cytokines in the membrane. Background was subtracted and densities from each spot were normalized to positive control signal.
Mass cytometry by time of flight (CyTOF)
Cells were stained with 1.25 μM cisplatin in RPMI for 3 minutes and quenched with fluorescence-activated cell sorting buffer (PBS, 0.02% sodium azide, 0.5% bovine serum albumin, and 2 mM EDTA). Panfungal T cells cultured with control or fungal pulsed DCs were barcoded using CD45 antibodies tagged with different metal tags, washed and incubated at 4°C with metal-conjugated antibodies targeting surface antigens as listed in supplemental Table 2 (all antibodies obtained from the Ramaciotti Facility for Human Systems Biology, Sydney, Australia). Following wash, cells were fixed in Fix/Perm buffer (BD Biosciences), permeabilized and incubated at 4°C with antibodies targeting intracellular antigens. Cells were washed with Perm/Wash buffer then fluorescence-activated cell sorting buffer, fixed overnight in 4% paraformaldehyde containing DNA intercalator (0.125 μM iridium-191/193; Fluidigm, Toronto, ON, Canada), diluted to 800 000 cells/mL in MilliQ with EQ beads (Fluidigm) and acquired at a rate of 200 to 400 cells/s using a CyTOF 2 Helios upgraded mass cytometer (Fluidigm). Cells were normalized for signal intensity of EQ beads. FlowJo × 10.0.7 software (FlowJo, Ashland, OR) was used to gate populations of interest and export cell counts and mean fluorescence intensity across populations. The t-stochastic neighborhood embedding (t-SNE) algorithm (implemented in FlowJo as a PlugIn) was used to perform dimensionality reduction and visualization of immune subpopulations across samples. t-SNE plots were visualized by showing each individual marker from all the samples.
Fungal hyphal damage assay
Antifungal activity was assessed with the use of a calorimetric assay with 2,3-bis-[2-methoxy-4-nitro-5-sulfophenyl]2H-tetrazolium-5-carboxyanilide sodium salt (XTT; Sigma) and coenzyme Q (Sigma) as previously described.38,39 1 × 10⁴ viable fungal spores in 200 μL YPD broth were germinated in 96-well plates for 16 hours, and hyphal masses were washed twice in RPMI-1640. White blood cells obtained by red cell lysis of whole blood and panfungal T cells were added at an effector-to-target ratio of 5:1. Each condition was tested in quadruplicate. After incubation for 2 hours, cells were lysed by washing in sterile water (Baxter). Stock solutions of XTT (10 mg/mL) and coenzyme Q (10 mg/mL) were prepared. Hyphal masses were resuspended in 200 μL RPMI-1640 with 400 μg/mL XTT and 50 μg/mL coenzyme Q. After vortexing, the plate was incubated for 45 minutes and centrifuged at 3000g for 10 minutes. Supernatant was collected, absorbance of the XTT reduction product (formazan) was measured using the 450-nm filter, with a 620-nm reference on the Victor 3 plate reader (Perkin Elmer).
Murine model for adoptive cell therapy in invasive aspergillosis
C57BL/6N and NOD.Cg-Prkdcscid Il2rgtm1Wjl/SzJ (NSG) mice, 8- to 10-week-old females, were bred and maintained under specific-pathogen–free conditions at the Animal facility of the University of Perugia, Italy. Animals were randomized to treatment groups at the beginning of each study. In all mouse experiments, a minimum of 3 animals per group were used. Mouse experiments were performed according to Italian Approved Animal Welfare Authorization 360/2015-PR and Legislative Decree 26/2014 regarding the animal license obtained by the Italian Ministry of Health lasting for 5 years (2015-2020). Viable conidia from the A fumigatus Af293 strain, obtained as described previously,40 were intranasally injected at 107 to 109 conidia/20 μL saline in anesthetized mice. Recipient mice were injected via the lateral tail vein with 13 × 106 unrelated HLA DR–matched PBMCs and 7 × 10⁶ autologous PBMCs 1 day before the infection followed or not by the IV infusion of 106 panfungal T cells the day after the infection. A combination of autologous and partially HLA DR–matched cells was used to provide support for T cells and predominant fungal antigen presentation by partially HLA DR–matched cells, the latter to mimic the clinical situation of a patient receiving partially HLA DR–matched fungus-specific T cells after allogeneic stem cell transplant. Mice were monitored for fungal growth, cell recruitment in bronchoalveolar lavage (BAL) fluid, histopathological analysis, and parameters of innate and adaptive immunity 6 or 14 days after infection (dpi).
Collection of BAL fluid and histopathological analysis
Lungs were filled thoroughly with 1.0-mL aliquots of pyrogen-free saline through a 22G bead-tipped feeding needle introduced into the trachea. BAL fluid was collected in a plastic tube on ice and centrifuged at 4000g at 4°C for 5 minutes. For differential BAL fluid cell counts, cytospin preparations were stained with May-Grünwald-Giemsa reagents (Sigma-Aldrich). At least 10 fields (200 cells/field) were counted, and the percent of polymorphonuclear and mononuclear cells was calculated. Photographs were taken using a high-resolution Olympus DP71 microscope.
Immunofluorescence
Lung tissues were removed and fixed in 10% phosphate-buffered formalin (Bio-Optica), embedded in paraffin. and sectioned at 3 μm. For immunofluorescence, sections were rehydrated and, after antigen retrieval in citrate buffer (10 mM, p H6), fixed in 4% formaldehyde for 20 minutes at room temperature and permeabilized in a blocking buffer containing 5% bovine serum albumin and 0.2% Triton X-100 in PBS. The slides were then incubated overnight at 4°C with the primary antibodies anti-CD11c-PE (clone N418, eBioscience) and anti-CD11b (clone M1/70.15, Thermo Fisher Scientific). After extensive washing with PBS, the slides were then incubated at room temperature for 60 minutes with secondary antibody anti-rat immunoglobulin G (whole molecule)/fluorescein isothiocyanate (Sigma-Aldrich) for CD11b. Nuclei were counterstained with DAPI. Images were acquired using a microscope BX51 and analySIS image processing software (Olympus).
Enzyme-linked immunosorbent assay and real-time PCR
Cytokine content was determined by enzyme-linked immunosorbent assays on lung homogenates. The detection limits were <8 pg/mL. The concentration of secreted cytokines in the supernatants was normalized to total tissue protein and expressed as picograms cytokine per milligram total protein. Real-time RT-PCR was performed using CFX96 Touch Real-Time PCR Detection System and SYBR Green chemistry (Bio-Rad). Cells were lysed and total RNA was reverse transcribed with complementary DNA Synthesis Kit (Bio-Rad), according to the manufacturer’s instructions.
Statistical analysis
Results obtained are presented as means ± standard error of the mean (SEM) or standard deviation (SD). Student t test was performed to analyze the results of all in vitro studies using Prism software (version 3.0; GraphPad Software). For multiple comparisons, P values were calculated using 1-way analysis of variance (Bonferroni’s post-test). The results were considered significant when P < .05.
Results
Rapid expansion of CD4+ fungus-specific T cells after CD137 selection
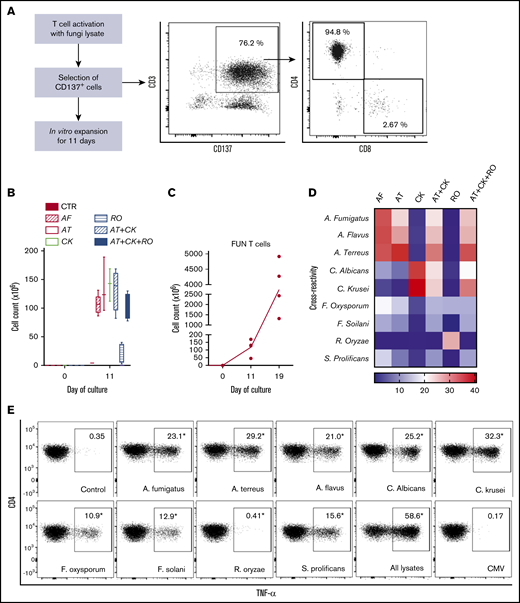
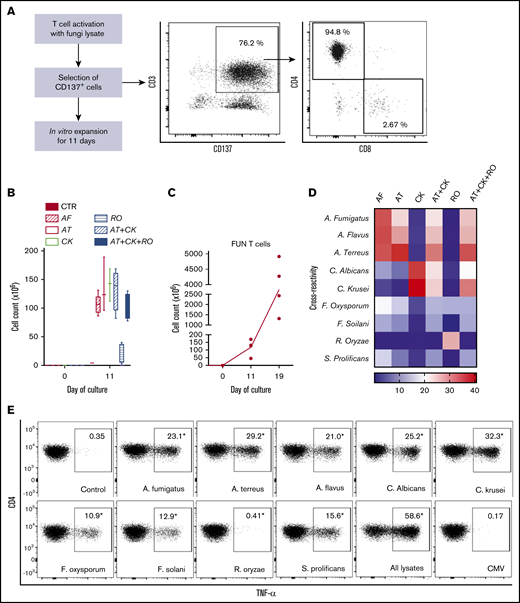
We used CD137 enrichment to select activated fungus-specific T cells from healthy donor HPCs that had been exposed for 16 hours to fungal lysates (A fumigatus, C krusei, A terreus, R oryzae, or a combination) (Figure 1A). A mock lysate containing no fungal antigen resulted in a significantly lower number of CD137+ cells after isolation than either A terreus or C krusei lysate (data not shown). R oryzae lysate stimulation expanded T cells poorly and was not considered further. All CD137-enriched fungal T cells comprised ≥80% CD3+ cells and ≥74% CD4+ T cells (Table 1). Selected cells were further expanded in vitro, increasing from 0.073 to 0.096 × 10⁶ to 103.2 to 147.8 × 10⁶ at the end of culture (≥1000-fold), (Figure 1B; Table 1). Restimulation of C krusei and A terreus exposed T cells with irradiated autologous PBMCs pulsed with the same fungal lysates and cultured for 7 days increased the cell count from 130.2 × 10⁶ ± 39.8 to 3234.1 × 106 ± 1656.6 (≥10-fold) (Figure 1C; Table 1). Individually stimulated T-cell cultures generated >97% CD3+ cells, of which >88% were CD4+ T cells and <6% were CD8+ T cells (Table 2). Cross-reactivity of cultures stimulated with individual or multiple fungal lysates was assessed in order to determine the individual fungal lysate or combination that would provide broadest reactivity to multiple fungal species (Figure 1D). We screened for the main cytokines related to immunity against fungi, including TNF-α, IFN-γ, and IL-17A.41 All 3 cytokines were produced in response to different fungal species (supplemental Figure 1A). The combination of C krusei and A terreus was chosen to generate fungus-specific T-cell products (hereafter called panfungal T cells) based on the favorable antifungal cross-reactivity observed using only these fungal lysates, and TH1 type T cells responding to the greatest number of clinically relevant fungal pathogens could be generated. Panfungal T cells responded to all individual lysates (except R oryzae), and >50% responded to DCs pulsed with a mixture of all fungal lysates (Figure 1E). Panfungal T cells produced TNF-α in response to DCs exposed to A terreus germinated spores or to fungal lysate (data not shown).
Method to generate clinical grade fungus-specific T cells targeting different fungal species. (A) Diagram of the method used for selection and enrichment of fungus-specific T cells from stem cell apheresis product. Representative flow cytometric analysis of the CD137-selected product after activation with fungal lysate (showing the content of CD3+CD137+ and CD4+ or CD8+ from this population). (B) Total cell number of fungus-specific T cells selected using different fungal lysates at the start of culture (CD137+-selected cells, day 0) and after expansion (end of culture, day 11). (C) Total cell number of T cells (FUN T cells) at the start of culture, after expansion, and after restimulation for 7 or 8 days with irradiated PBMCs pulsed with A terreus and C krusei lysates. Results are means of 3 to 5 experiments (±SEM) and shown total cell count. (D) TNF-α expression in fungus-specific T cells selected and expanded using different fungal lysates (shown on the top x-axis) after 6-hour coculture with DCs pulsed with a range of fungal species (shown on the y-axis) analyzed by flow cytometry. Results are expressed in terms of heat map in which each square represents the mean value percentage of CD4+ TNF-α+ cells from 3 to 6 experiments. Results are expressed in terms of heat map in which each square represents the mean value percentage of the indicated marker from 3 to 6 experiments. (E) Representative flow cytometric analysis showing TNF-α expression determined by flow cytometry in panfungal T cells after 6-hour coculture with DCs pulsed with individual fungal lysates, a mix of all fungal lysates, or pp65 cytomegalovirus (CMV) pepmix as irrelevant control antigen. Results are means of 6 experiments and shown as percentage of CD4+ T cells (*P ≤ .001 DC control vs fungal lysate–pulsed DC; paired, 2-tailed Student t test). AT, A terreus; CK, C krusei; CTR, control; RO, R oryzae.
Method to generate clinical grade fungus-specific T cells targeting different fungal species. (A) Diagram of the method used for selection and enrichment of fungus-specific T cells from stem cell apheresis product. Representative flow cytometric analysis of the CD137-selected product after activation with fungal lysate (showing the content of CD3+CD137+ and CD4+ or CD8+ from this population). (B) Total cell number of fungus-specific T cells selected using different fungal lysates at the start of culture (CD137+-selected cells, day 0) and after expansion (end of culture, day 11). (C) Total cell number of T cells (FUN T cells) at the start of culture, after expansion, and after restimulation for 7 or 8 days with irradiated PBMCs pulsed with A terreus and C krusei lysates. Results are means of 3 to 5 experiments (±SEM) and shown total cell count. (D) TNF-α expression in fungus-specific T cells selected and expanded using different fungal lysates (shown on the top x-axis) after 6-hour coculture with DCs pulsed with a range of fungal species (shown on the y-axis) analyzed by flow cytometry. Results are expressed in terms of heat map in which each square represents the mean value percentage of CD4+ TNF-α+ cells from 3 to 6 experiments. Results are expressed in terms of heat map in which each square represents the mean value percentage of the indicated marker from 3 to 6 experiments. (E) Representative flow cytometric analysis showing TNF-α expression determined by flow cytometry in panfungal T cells after 6-hour coculture with DCs pulsed with individual fungal lysates, a mix of all fungal lysates, or pp65 cytomegalovirus (CMV) pepmix as irrelevant control antigen. Results are means of 6 experiments and shown as percentage of CD4+ T cells (*P ≤ .001 DC control vs fungal lysate–pulsed DC; paired, 2-tailed Student t test). AT, A terreus; CK, C krusei; CTR, control; RO, R oryzae.
CD137 expanded fungus-specific T cells are predominantly clonally narrowed CD4+ TH1 effector memory cells producing multiple cytokines and chemokines in response to fungal stimulation
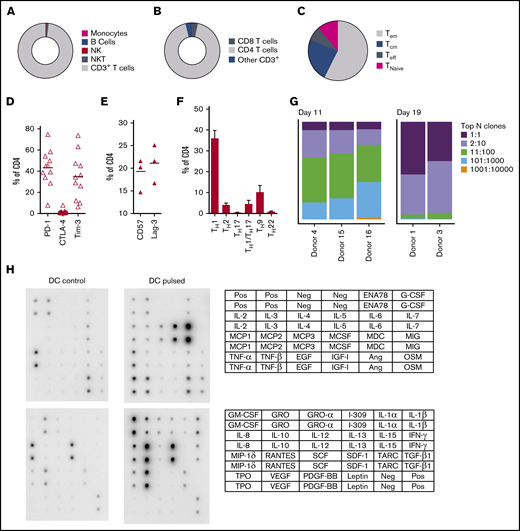
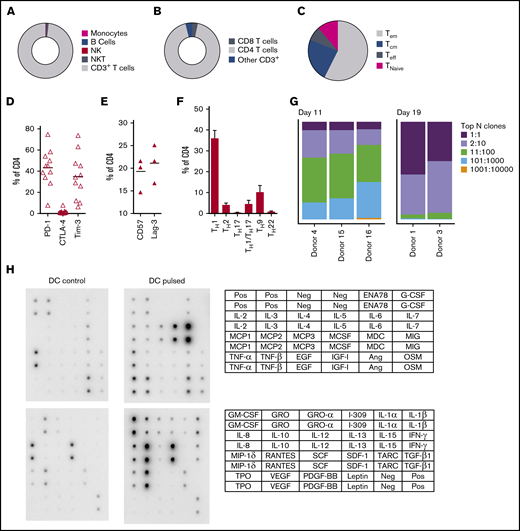
At completion of the culture period, panfungal T cells were predominantly CD4+ T cells (Figure 2A-B). The majority of the CD4 T cells displayed an effector memory phenotype (Tem; 57.5% ± 6.9%) with smaller populations of central memory (Tcm; 23.5% ± 3.8%), and a minority of terminal effector and naive phenotype (7.7% ± 2.1% and 11.3% ± 6.5%, respectively) (Figure 2C). The cells also expressed the inhibitory receptors or exhaustion markers Tim-3, Lag-3, CD57, and PD-1 (Figure 2D-E). Chemokine receptor expression showed that the majority of the CD4+ T cells had a TH1 type pattern (33.25% ± 3.8% of CD4+ T cells), with smaller populations of TH9, TH1/TH17, and TH2 type41 (Figure 2F). We also determined the frequency of a CD4+CD154-CD137+ population reported to be stable regulatory T cells in cultures expanded in vitro.42 Reactive fungus-specific regulatory T cells did not exceed 3% (2.3% ± 0.5) of the total CD4 T cell population. A. fumigatus-specific T cells at the end of culture day 11 (without restimulation) and at day 19 (following restimulation on day 11), were analyzed for TCR-β clonality. At day 11, 1 to 10 TCR clones made up the top 25% of TCR sequences, increasing to ≥75% following expansion for a further week (Figure 2G). Expanded fungus-specific T cells also expressed Toll-like receptors (TLRs) involved in innate fungal immunity.43 Low levels of surface TLR2, TLR4, TLR6, and TLR9 were detected in panfungal T cells (data not shown). Intracellular TLR9 was expressed in 30% to 50% of fungus-specific T cells. Neither surface not intracellular TLR expression was increased after stimulation with fungus lysate–pulsed DCs (data not shown). The production of cytokines and chemokines in panfungal T-cell cultures with control and pulsed DCs was determined by cytokine array. The levels of IL-2, IL-4, IL-10, GM-CSF, IL-5, IL-6, TNF-α, IL-1β, IFN-γ, and TNF-β increased ≥10 fold, and levels of I309, IL-3, IL-1α, RANTES, IL-13, IL-12, MCP-2, MIP-1δ, oncostatin, GRO-α, GRO, TARC increased ≥2-fold in supernatants of panfungal T-cell cultures compared with controls (Figure 2H).
Characterization of panfungal T-cell product. Donor HPCs were stimulated with lysates of A terreus and C krusei and expanded as described in “Methods.” Average composition or percentage of (A) T cells (CD3+), natural killer (NK) cells (CD3−CD56+), natural killer T cells (NKT) (CD3+CD56+), B cells (CD19+), and monocytes (CD14+) of live cells; (B) CD4+ T cells and CD8+ T cells of CD3+ T cells; (C) T central memory (CD45RA−62L+), T terminal effector (CD45RA+62L−), T naive (CD45RA+62L+), and T effector memory (CD45RA−62L−); (D-E) exhaustion marker expression profile of CD4+ T cells (PD-1, Tim-3 and CTLA-4, and CD57 and Lag-3) and (F) the CD4 T helper subtypes TH1 (CCR4−CCR6−CCR10−CXCR3+), TH2 (CCR4+CCR6−CXCR3−), TH9 (CCR4-CCR6+), TH17 (CCR4+CCR6+CCR10−CXCR3−), TH22 (CCR4+CCR6+CCR10+), and TH1/TH17 (CCR4−CCR6+CXCR3+) was determined at the end of culture by flow cytometry (A-D) or mass cytometry by time of fight (E-F). Results are means of 3 to 11 experiments (±SEM) and shown as percentage of live cells, CD3+ T cells, or CD4+ T cells. (G) Quantification of the TCR-β sequences expression in CD4+CD154+ sorted cells from T-cell products expanded for 11 days or 19 days after 16-hour activation with A fumigatus–pulsed DCs. Results are from 5 experiments and give the proportion of the product made up of the top N clones, where N is the number of clones shown. (H) Immunoblot analysis of cytokines in supernatants of panfungal T cells cultured for 24 hours with noncontrol or fungus-pulsed DCs, shown as representative immunoblot image from 2 experiments (cytokines measured in the blot are described in the tables; upper table refers to top 2 blots, and lower table refers to bottom 2 blots). Relative density measurement corresponds to the relative cytokine expression levels from panfungal T cells cultured with pulsed DCs and control DCs and calculated as follows: X(Ny) = X(y) × P1/P(y), where P1 is the mean signal density of positive control spots on reference array, P(y) is the mean signal density of positive control spots on array “y,” X(y) is the mean signal density for spot “X” on array for sample “y,” and X(Ny) is the normalized signal intensity for spot “X” on array “y” spots on reference array “y.”
Characterization of panfungal T-cell product. Donor HPCs were stimulated with lysates of A terreus and C krusei and expanded as described in “Methods.” Average composition or percentage of (A) T cells (CD3+), natural killer (NK) cells (CD3−CD56+), natural killer T cells (NKT) (CD3+CD56+), B cells (CD19+), and monocytes (CD14+) of live cells; (B) CD4+ T cells and CD8+ T cells of CD3+ T cells; (C) T central memory (CD45RA−62L+), T terminal effector (CD45RA+62L−), T naive (CD45RA+62L+), and T effector memory (CD45RA−62L−); (D-E) exhaustion marker expression profile of CD4+ T cells (PD-1, Tim-3 and CTLA-4, and CD57 and Lag-3) and (F) the CD4 T helper subtypes TH1 (CCR4−CCR6−CCR10−CXCR3+), TH2 (CCR4+CCR6−CXCR3−), TH9 (CCR4-CCR6+), TH17 (CCR4+CCR6+CCR10−CXCR3−), TH22 (CCR4+CCR6+CCR10+), and TH1/TH17 (CCR4−CCR6+CXCR3+) was determined at the end of culture by flow cytometry (A-D) or mass cytometry by time of fight (E-F). Results are means of 3 to 11 experiments (±SEM) and shown as percentage of live cells, CD3+ T cells, or CD4+ T cells. (G) Quantification of the TCR-β sequences expression in CD4+CD154+ sorted cells from T-cell products expanded for 11 days or 19 days after 16-hour activation with A fumigatus–pulsed DCs. Results are from 5 experiments and give the proportion of the product made up of the top N clones, where N is the number of clones shown. (H) Immunoblot analysis of cytokines in supernatants of panfungal T cells cultured for 24 hours with noncontrol or fungus-pulsed DCs, shown as representative immunoblot image from 2 experiments (cytokines measured in the blot are described in the tables; upper table refers to top 2 blots, and lower table refers to bottom 2 blots). Relative density measurement corresponds to the relative cytokine expression levels from panfungal T cells cultured with pulsed DCs and control DCs and calculated as follows: X(Ny) = X(y) × P1/P(y), where P1 is the mean signal density of positive control spots on reference array, P(y) is the mean signal density of positive control spots on array “y,” X(y) is the mean signal density for spot “X” on array for sample “y,” and X(Ny) is the normalized signal intensity for spot “X” on array “y” spots on reference array “y.”
Three distinct populations of fungus-reactive CD4+ T cells can be identified in panfungal T-cell cultures using t-SNE
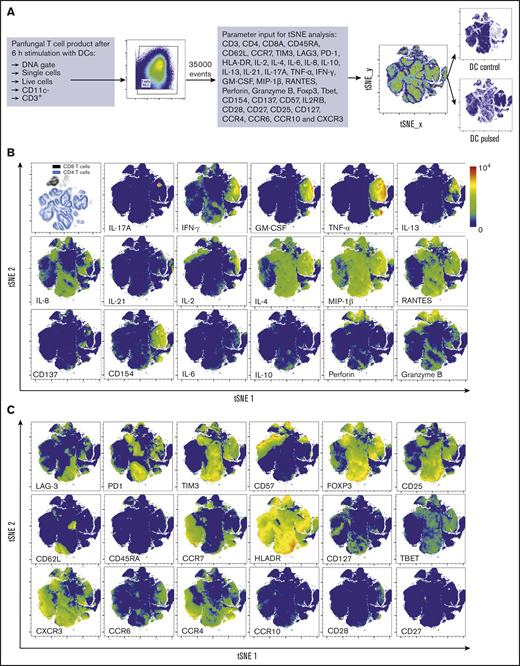
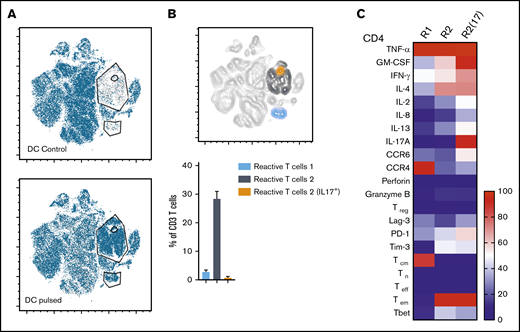
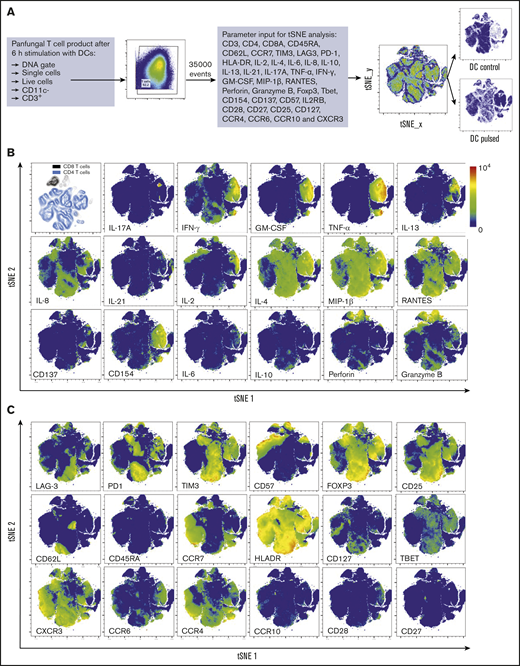
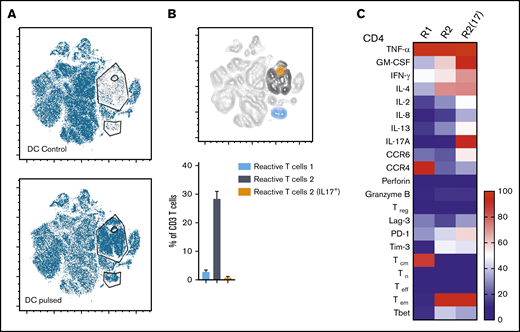
t-SNE analyses (Figure 3A) were used to show the distribution of activation markers and cytokine production (Figure 3B) and memory and chemokine receptor expression (Figure 3C) from panfungal T cells. An increase in the expression levels (mean fluorescence intensity) of cells producing TNF-α, IFN-γ, GM-CSF, IL-2, IL-13, IL-17A, CD154, and CD137 was observed in CD4 T cells following fungal antigen presentation (supplemental Figure 1B). TNF-α, GM-CSF, IL-13, CD154, CD137, and IL-17A were restricted to panfungal T cells responding to fungal restimulation. IFN-γ, IL-8, IL-2, IL-4, MIP-1β, RANTES, and granzyme B were seen in panfungal T cells exposed to control and fungal lysate–pulsed MoDCs. Exclusive markers for reactive fungus-specific T cells allowed us to identify 3 distinct cell cluster populations of reactive T cells upon exposure to fungal antigens (Figure 4A-B). These 3 populations of reactive T cells (R1, R2, and R2(17)) corresponded to 2.8 ± 1.1%, 28.4 ± 4.4%, and 0.78 ± 0.4% of the total T-cell product, respectively (Figure 4B). The 3 populations were functionally and phenotypically distinct. R1 and R2 had similar cytokine profiles, while R2(17) was defined by IL-17A synthesis (Figure 4C). While CD4+ T cells in R1 displayed a central memory phenotype, R2 and R2(17) cells were predominantly effector memory with higher expression of exhaustion markers (Tim-3 and PD-1) compared with R1 (Figure 4C).
T-cell markers associated with T-cell phenotype, functionality, and response to fungi. (A) Diagram describing gating strategy and t-SNE mapping and analysis workflow for samples shown in B and C. t-SNE plot showing marker expression levels for single parameters (B, activation markers and cytokines; C, phenotype markers) on individual cells of panfungal T-cell products cultured for 6 hours with nonpulsed DCs or fungus-pulsed DCs. Responding fungus-specific T cells correspond to the cell cluster showing higher GM-CSF and TNF-α expression. t-SNE plots are representative of control and pulsed DC-treated panfungal T cells from 3 experiments.
T-cell markers associated with T-cell phenotype, functionality, and response to fungi. (A) Diagram describing gating strategy and t-SNE mapping and analysis workflow for samples shown in B and C. t-SNE plot showing marker expression levels for single parameters (B, activation markers and cytokines; C, phenotype markers) on individual cells of panfungal T-cell products cultured for 6 hours with nonpulsed DCs or fungus-pulsed DCs. Responding fungus-specific T cells correspond to the cell cluster showing higher GM-CSF and TNF-α expression. t-SNE plots are representative of control and pulsed DC-treated panfungal T cells from 3 experiments.
Immunophenotype characterization of reactive T cells against fungi. (A) t-SNE plots (described in Figure 3A) for panfungal T cells cultured for 6 hours with nonpulsed DCs (DC control) or fungus-pulsed DCs (DC pulsed). Gates show 3 different populations of cells responding to fungi (these populations were only present in panfungal T cells cultured with fungal pulsed DCs). (B) Percentage of the 3 populations of reactive panfungal T cells after 6-hour coculture with fungal lysate–pulsed DCs analyzed by CyTOF. Results are means of 3 experiments (±SEM) and shown as percentage of CD4+ T cells. (C) Expression of exhaustion and phenotype markers and cytokines (shown on the y-axis) in the 3 different reactive T-cell populations (shown on the x-axis) of panfungal T-cell products after 6-hour coculture with fungal lysate–pulsed DCs and analyzed by CyTOF. Results are expressed in terms of heat map in which each square represents the mean value percentage of CD4+ T cells from 3 experiments. R1, reactive T-cell population 1; R2, reactive T-cell population 2; R2(17), reactive T-cell population 2 (IL-17A+); Tcm, central memory T cells (CD45RA −CCR7+); Teff, terminal effector T cells (CD45RA+CCR7−); Tem, effector memory T cells (CD45RA−CCR7−); Tn, naive T cells (CD45RA+CCR7+); Treg, regulatory T cells (CD137+CD154−).
Immunophenotype characterization of reactive T cells against fungi. (A) t-SNE plots (described in Figure 3A) for panfungal T cells cultured for 6 hours with nonpulsed DCs (DC control) or fungus-pulsed DCs (DC pulsed). Gates show 3 different populations of cells responding to fungi (these populations were only present in panfungal T cells cultured with fungal pulsed DCs). (B) Percentage of the 3 populations of reactive panfungal T cells after 6-hour coculture with fungal lysate–pulsed DCs analyzed by CyTOF. Results are means of 3 experiments (±SEM) and shown as percentage of CD4+ T cells. (C) Expression of exhaustion and phenotype markers and cytokines (shown on the y-axis) in the 3 different reactive T-cell populations (shown on the x-axis) of panfungal T-cell products after 6-hour coculture with fungal lysate–pulsed DCs and analyzed by CyTOF. Results are expressed in terms of heat map in which each square represents the mean value percentage of CD4+ T cells from 3 experiments. R1, reactive T-cell population 1; R2, reactive T-cell population 2; R2(17), reactive T-cell population 2 (IL-17A+); Tcm, central memory T cells (CD45RA −CCR7+); Teff, terminal effector T cells (CD45RA+CCR7−); Tem, effector memory T cells (CD45RA−CCR7−); Tn, naive T cells (CD45RA+CCR7+); Treg, regulatory T cells (CD137+CD154−).
Panfungal T cells have antihyphal activity in vitro
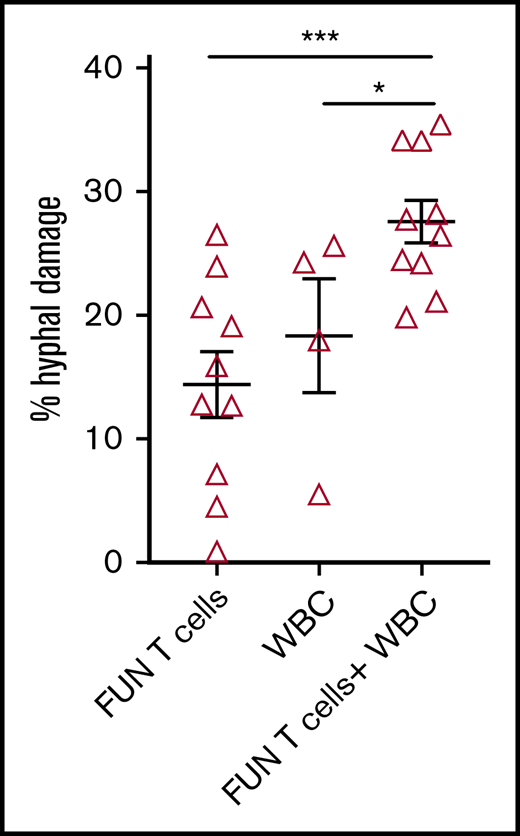
We investigated the ability of CD137 isolated and expanded panfungal T cells to kill germinated conidia. The anti-hyphal activity of T cells was assessed by incubating conidia from A. fumigatus, which is the most common cause of IFD in adults after allogeneic stem cell transplant,1 with panfungal T cells alone, peripheral blood white blood cells (WBCs) that had not previously been cultured with fungi, and a combination of the 2. Damage to fungal hyphae was observed using T cells alone (14.4% ± 2.7% of hyphae damage) and, as expected, WBCs alone also induced fungal hyphae damage (18.3% ± 4.6%), which was concentration dependent (data not shown). When panfungal T cells and WBCs were used together at equal cell numbers at an effector-to-target ratio of 5:1, the level of hyphal damage was potentiated to 27.6% ± 1.3% (Figure 5).
Antihyphal activity of panfungal T cells. Percentage of hyphal damage induced by panfungal T cells, WBCs, and a combination of both after 2-hour incubation with germinated conidia from A fumigatus was assessed using an XTT calorimetric assay. Results are means of 4 experiments (±SEM) and shown as percentage of hyphal damage relative to nontreated hyphae (*P ≤ .05 and ***P ≤ .001 treatment vs none; unpaired, 2-tailed Student t test).
Antihyphal activity of panfungal T cells. Percentage of hyphal damage induced by panfungal T cells, WBCs, and a combination of both after 2-hour incubation with germinated conidia from A fumigatus was assessed using an XTT calorimetric assay. Results are means of 4 experiments (±SEM) and shown as percentage of hyphal damage relative to nontreated hyphae (*P ≤ .05 and ***P ≤ .001 treatment vs none; unpaired, 2-tailed Student t test).
Panfungal T cells mediate antifungal responses in the presence of partial HLA DR antigen and allele mismatch
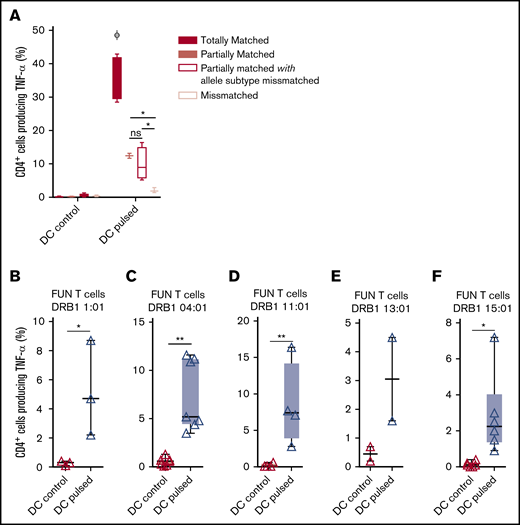
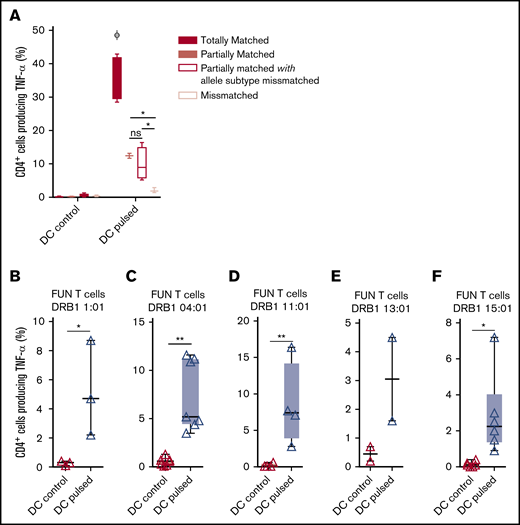
We previously demonstrated that antifungal activity was mediated predominantly via recognition of antigen presented on HLA DRB1 molecules. To minimize the number of third-party donor partially HLA-matched panfungal T-cell products required for a cell bank to treat HSCT patients with IFD, banked cells would ideally recognize fungal antigens presented on only 1 of 2 HLA DR molecules, even if that HLA molecule was an allele mismatch. Panfungal T cells recognized autologous (fully HLA DRB1–matched) lysate-pulsed MoDCs (35.7% ± 3.3% panfungal CD4+ cells producing TNF-α). Fungal lysate–pulsed MoDCs sharing only 1 HLA DR molecule and sharing only 1 HLA DR molecule with allele subtype mismatch were also able to elicit responses from panfungal T cells, albeit at lower levels (12.4% ± 0.7% and 9.9% ± 2.5% of CD4+ cells producing TNF-α, respectively) (Figure 6A). To further explore antifungal activity at the allelic subtype level, we generated panfungal T cells from healthy donors with the 5 most common HLA DRB1 types that have common allelic variants registered by the Australian Red Cross Blood Service in 2016 (DRB1 01:01, 04:01, 11:01, 13:01, or 15:01). These cells were then challenged with fungal antigens presented by MoDCs sharing 2 common but allelic-mismatched HLA DRB1 antigen. Fungal lysate–pulsed MoDCs with HLA DRB1 01:02; 04:03, 04:04, or 04:05; 11:04; 13:02 and 15:02 were able to elicit responses from panfungal T cells with HLADRB1 01:01, 04:01, 11:01, 13:01, and 15:01, respectively (5.2% ± 3.2%, 7.4% ± 3.7%, 8.5% ± 5.7%, 3.1% ± 2.1%, and 3.2% ± 2.3% of CD4+ cells producing TNF-α, respectively, for each HLA DRB1 molecule) (Figure 6B-F). Other HLA DRB1 molecules such as HLA DRB1 03:01 and 07:01 are also common, but their allelic variants are not, and we did not test them.
Ability of common HLA-DRB1 subtypes to present fungal antigens to antigen- and allelically mismatched panfungal T cells. (A) Flow cytometry analysis of TNF-α expression in panfungal T cells cultured for 6 hours with nonpulsed or fungal lysate–pulsed MoDCs when the DCs presenting fungi antigens share 2 HLA-DRB1 antigens, only 1 HLA-DRB1 antigen, and only 1 HLA-DRB1 antigen but with different allele subtype and neither of the HLA-DRB1 antigens (mismatched) with the panfungal T cells. Results are means of 2 to 4 experiments (±SEM) and shown as percentage of CD4+ T cells. (A) *P ≤ .05 partially matched vs mismatched and allele subtype missmatched vs mismatched; ΦP ≤ .001 matched vs partially matched, partially matched with allele subtype missmatched and missmatched (unpaired, 2-tailed Student t test). (B-F) Flow cytometry analysis of TNF-α expression in panfungal CD4+ T cells with common HLA types (DRB1 01:01, 04:01, 11:01, 13:01, or 15:01) cultured for 6 hours with allelic-mismatched nonpulsed or fungal lysate–pulsed DCs; DCs express (B) HLA-DRB1 01:02; (C) HLA-DRB1 04:03, 04:04, 04:05; (D) HLA-DRB1 11:04; (E) HLA-DRB1 13:02; and (F) HLA-DRB1 15:02. Results are means of 2 to 6 experiments (±SEM) and shown as percentage of CD4+ T cells (**P ≤ .01, *P ≤ .05 DC control vs DC pulsed; paired, 2-tailed Student t test).
Ability of common HLA-DRB1 subtypes to present fungal antigens to antigen- and allelically mismatched panfungal T cells. (A) Flow cytometry analysis of TNF-α expression in panfungal T cells cultured for 6 hours with nonpulsed or fungal lysate–pulsed MoDCs when the DCs presenting fungi antigens share 2 HLA-DRB1 antigens, only 1 HLA-DRB1 antigen, and only 1 HLA-DRB1 antigen but with different allele subtype and neither of the HLA-DRB1 antigens (mismatched) with the panfungal T cells. Results are means of 2 to 4 experiments (±SEM) and shown as percentage of CD4+ T cells. (A) *P ≤ .05 partially matched vs mismatched and allele subtype missmatched vs mismatched; ΦP ≤ .001 matched vs partially matched, partially matched with allele subtype missmatched and missmatched (unpaired, 2-tailed Student t test). (B-F) Flow cytometry analysis of TNF-α expression in panfungal CD4+ T cells with common HLA types (DRB1 01:01, 04:01, 11:01, 13:01, or 15:01) cultured for 6 hours with allelic-mismatched nonpulsed or fungal lysate–pulsed DCs; DCs express (B) HLA-DRB1 01:02; (C) HLA-DRB1 04:03, 04:04, 04:05; (D) HLA-DRB1 11:04; (E) HLA-DRB1 13:02; and (F) HLA-DRB1 15:02. Results are means of 2 to 6 experiments (±SEM) and shown as percentage of CD4+ T cells (**P ≤ .01, *P ≤ .05 DC control vs DC pulsed; paired, 2-tailed Student t test).
Expanded panfungal T cells impair fungal growth in a murine model of Aspergillus infection
We used Hu-PBL-SCID mice (NOD.Cg-Prkdcscid/Il2rgtm1Wjl/SzJ [NSG])44 to assess the efficacy of in vitro–generated panfungal T cells in experimental aspergillosis. Recipient mice were injected with a combination of autologous and unrelated partially HLA DR–matched PBMCs 1 day before intranasal infection with A fumigatus conidia followed the day after by the IV infusion of panfungal T cells. Compared with C57BL/6 mice, NSG mice showed an increased susceptibility to the infection, as indicated by the increased fungal burden, inflammatory cell recruitment, lung pathology, and expression of proinflammatory TNF-α and IL-1β (supplemental Figure 2). Resistance to infection was significantly increased upon transfer of panfungal T cells, as revealed by impaired fungal growth in the lung and brain, reduced neutrophil influx and lung inflammation (Figure 7A-B), and reduced inflammatory cytokine production (Figure 7C-D). Humanizing cells alone or panfungal T cells alone failed to provide significant protection (Figure 7E). Similar results were observed using panfungal T cells from 2 additional different donors even in the presence of higher fungal burdens (Figure 7F-G). The effect persisted at later time points, as revealed by the reduced inflammation at day 14 following infection (Figure 7H-I) associated with the presence of a prevalent monocyte infiltration (Figure 7I).
Panfungal T cells protect from infection in NSG mice upon adoptive transfer. (A-I) Recipient mice were humanized with autologous and unrelated HLA DR–matched PBMCs 1 day before intranasal A fumigatus infection (resulting in low [A-D] or high [E-I] fungal burden) followed by the intravenous infusion of 106 panfungal T cells the day after the infection. (A) Colony-forming units (log10 CFU) in lungs and brain, (B) lung histology (Periodic acid–Schiff [PAS]–stained sections; scale bars, 500 and 100 μm [upper insets]; and percentage of polymorphonuclear neutrophils [PMNs] in bronchoalveolar lavage [lower insets]), (C) gene expression, and (D) cytokine and chemokine production at 6 days after infection. (E) Colony-forming units (log10 CFU) in lungs of mice treated with PBMCs alone, panfungal T cells alone, or combination at 6 days after infection. (F) Colony-forming units (log10 CFU) in lungs and (G) lung histology (PAS-stained sections; scale bars, 100 μm; and percentage of PMNs in bronchoalveolar lavage [upper insets)] at 6 days after infection. (H) Colony-forming units (log10 CFU) in lungs, (I) lung histology (PAS-stained sections; scale bars, 200 μm [left]; and percentage of PMNs in bronchoalveolar lavage [upper insets]) and CD11c+ and CD11b+ cell infiltration, evaluated by immunofluorescence at 14 days after infection (scale bars, 100 μm). Results are the mean ± SD from 3 to 5 mice per group (*P < .05, **P < .01, T cells vs none; 2-way analysis of variance, Bonferroni post-test and Student t test). None, mice that received neither humanizing cells nor T cells.
Panfungal T cells protect from infection in NSG mice upon adoptive transfer. (A-I) Recipient mice were humanized with autologous and unrelated HLA DR–matched PBMCs 1 day before intranasal A fumigatus infection (resulting in low [A-D] or high [E-I] fungal burden) followed by the intravenous infusion of 106 panfungal T cells the day after the infection. (A) Colony-forming units (log10 CFU) in lungs and brain, (B) lung histology (Periodic acid–Schiff [PAS]–stained sections; scale bars, 500 and 100 μm [upper insets]; and percentage of polymorphonuclear neutrophils [PMNs] in bronchoalveolar lavage [lower insets]), (C) gene expression, and (D) cytokine and chemokine production at 6 days after infection. (E) Colony-forming units (log10 CFU) in lungs of mice treated with PBMCs alone, panfungal T cells alone, or combination at 6 days after infection. (F) Colony-forming units (log10 CFU) in lungs and (G) lung histology (PAS-stained sections; scale bars, 100 μm; and percentage of PMNs in bronchoalveolar lavage [upper insets)] at 6 days after infection. (H) Colony-forming units (log10 CFU) in lungs, (I) lung histology (PAS-stained sections; scale bars, 200 μm [left]; and percentage of PMNs in bronchoalveolar lavage [upper insets]) and CD11c+ and CD11b+ cell infiltration, evaluated by immunofluorescence at 14 days after infection (scale bars, 100 μm). Results are the mean ± SD from 3 to 5 mice per group (*P < .05, **P < .01, T cells vs none; 2-way analysis of variance, Bonferroni post-test and Student t test). None, mice that received neither humanizing cells nor T cells.
Discussion
We used CD137 activation molecule selection to isolate and rapidly expand fungus-specific T cells from normal donors and tested their ability to respond to fungal antigens presented on HLA-matched and mismatched molecules. Our goal was to determine whether there was a basis for testing third-party donor derived partially HLA-matched panfungal T cells as a therapy in HSCT patients with IFD. The manufacturing method generated cells within 11 days and produced cell numbers easily exceeding those that were effective in the only published clinical trial evaluating the adoptive transfer of Aspergillus-specific T cells after HSCT.24 Panfungal CD4+ T cells showed cross-reactivity against 7 clinically relevant fungal species, including Aspergillus and Candida, and against highly pathogenic but less common fungi, including Fusarium, Scedosporium, and Lomentospora species.
The T-cell product contained mainly CD4+ T cells that produced TH1 and TH17-type cytokines (TNF-α, IFN-γ, and IL-17A) on re-exposure to fungal antigens. TNF-α, GM-CSF, IFN-, IL-2, IL-4, IL-10, IL-5, IL-6, IL-1β, and TNF-β and other cytokines that induce T-cell, neutrophil, and monocyte/macrophage recruitment and enhance their functional activity were secreted by cocultures of panfungal T cells and DCs.45 Culture supernatant induced directed chemotaxis in monocytes and granulocytes using an in vitro chemotaxis assay (Boyden chamber) (data not shown). Expression of some cytokines such as TNF-α, GM-CSF, and IL-17A was highly restricted to cells responding to antigen restimulation. Boolean gating identified populations of lymphocytes secreting cytokines unique to cells responding to fungal restimulation (data not shown). Despite being predominantly CD4+, panfungal T cells expressed granzyme A, directly mediated hyphal damage,46,47 and potentiated hyphal killing by other leukocytes. Using t-SNE, we identified 3 fungus-specific CD4+ T-cell populations with different characteristics, including a population of CCR4-expressing central memory T cells and 2 populations of effector memory cells with TH1 and TH17 properties, both of which correlate with protective immunity against fungi.48
Fungal recognition was mediated mainly via HLA-DR and was maintained in the setting of partial HLA DR matching. Even when the single matched HLA DR antigen differed at the allelic level, panfungal T-cell responses were preserved. The ability of panfungal T cells to respond to antigens presented by partially HLA DR–matched cells reduces the number of T-cell products that would be required for a bank of third-party donor fungus-specific T cells with wide patient coverage as we recently showed for cytomegalovirus-specific T cells.49,50 Assuming a requirement for HLA matching at only 1 HLA DR antigen, a bank of fungus-specific T-cell products made from only 6 to 10 donors with common HLA DR types may be sufficient to offer treatment to >90% of patients with an IFD after HSCT. Most importantly, we tested the capacity of CD137 expanded panfungal T cells to exert therapeutic effects in vivo. In a humanized mouse model of Aspergillus infection, panfungal T cells reduced fungal colony formation in lung and brain, diminished pulmonary congestion, and lessened production of proinflammatory cytokines. Our findings support the notion that panfungal T cells may be useful therapeutic products in some immunocompromised patients with IFD, especially those with IFD after HSCT. Since IFDs occur in a variety of immunosuppressive states of differing etiologies, we cannot be confident that panfungal T cells will be equally effective in all clinical scenarios. However our data set the scene for a clinical trial testing third-party donor derived partially HLA DR–matched fungus-specific T cells from a cryopreserved bank in HSCT recipients with invasive fungal infection.
Data will be shared via e-mail to the corresponding author, David J. Gottlieb (e-mail: david.gottlieb@sydney.edu.au).
Acknowledgments
The authors thank Catriona Halliday for her assistance. Flow cytometry was performed in the Flow Cytometry Core Facility, which is supported by the Westmead Research Hub, Cancer Institute of New South Wales, and National Health and Medical Research Council. The visual abstract was created with BioRender.
This work was supported by project grants from Cancer Council NSW, the National Health and Medical Research Council of Australia, and the Leukaemia Foundation of Australia, as well as funding from the European Union’s Horizon 2020 research and innovation program under grant agreement 847507-HDM-FUN (L.R.). G.C.-G. was provided conference support from Sydney West Translational Cancer Research Centre.
Authorship
Contribution: D.J.G. conceived and coordinated the project; and supervised data analysis and writing of the manuscript; G.C.-G. wrote the manuscript, designed and performed the experiments and analyzed the data; L.E.C. supervised the running of the clean room facilities, manufacture of the T-cell products for therapeutic use, and performance of assays for product release; F.L., B.H., and M.S. performed and analyzed TCR sequencing experiments; H.M.M. and B.F.d.S.G. performed CyTOF experiments and gave support and valuable advice on data analysis; Z.L. and S.A. performed the assays required to address some of the reviewers’ comments; M.M.B., M.P., and G.R. performed and analyzed all the mice model experiments; L.R. designed the mice model experiments, supervised its data analysis, and gave valuable advice for the study; and all authors reviewed and approved the manuscript.
Conflict-of-interest disclosure: The authors declare no competing financial interests.
Correspondence: David J. Gottlieb, Department of Medicine, Level 2, Westmead Hospital, Hawkesbury Rd, Sydney, NSW 2145, Australia; e-mail: david.gottlieb@sydney.edu.au.
References
Author notes
The full-text version of this article contains a data supplement.

![Panfungal T cells protect from infection in NSG mice upon adoptive transfer. (A-I) Recipient mice were humanized with autologous and unrelated HLA DR–matched PBMCs 1 day before intranasal A fumigatus infection (resulting in low [A-D] or high [E-I] fungal burden) followed by the intravenous infusion of 106 panfungal T cells the day after the infection. (A) Colony-forming units (log10 CFU) in lungs and brain, (B) lung histology (Periodic acid–Schiff [PAS]–stained sections; scale bars, 500 and 100 μm [upper insets]; and percentage of polymorphonuclear neutrophils [PMNs] in bronchoalveolar lavage [lower insets]), (C) gene expression, and (D) cytokine and chemokine production at 6 days after infection. (E) Colony-forming units (log10 CFU) in lungs of mice treated with PBMCs alone, panfungal T cells alone, or combination at 6 days after infection. (F) Colony-forming units (log10 CFU) in lungs and (G) lung histology (PAS-stained sections; scale bars, 100 μm; and percentage of PMNs in bronchoalveolar lavage [upper insets)] at 6 days after infection. (H) Colony-forming units (log10 CFU) in lungs, (I) lung histology (PAS-stained sections; scale bars, 200 μm [left]; and percentage of PMNs in bronchoalveolar lavage [upper insets]) and CD11c+ and CD11b+ cell infiltration, evaluated by immunofluorescence at 14 days after infection (scale bars, 100 μm). Results are the mean ± SD from 3 to 5 mice per group (*P < .05, **P < .01, T cells vs none; 2-way analysis of variance, Bonferroni post-test and Student t test). None, mice that received neither humanizing cells nor T cells.](https://ash.silverchair-cdn.com/ash/content_public/journal/bloodadvances/4/14/10.1182_bloodadvances.2020001565/2/m_advancesadv2020001565f7.png?Expires=1764994465&Signature=utOGgi5biKbE8tSl13TDnQBnURUD7qS1q7MQ6XurVZgCCLtDalIqZMw93BPLSp-EMm~5HzwL2HRmPzeimgJoau-SWY130fKYFcaP6hleP4nSnw-V5gnbTA4W4bctLxJHoZQ2TkOQsOCMJE0YL6~71xgQroXCbh4wH108unJttYPKJ3b0tXYa3US5ks~buya2AAU0gq4SboO03j8clUp3R~SCRkVe1zYk6qexxsbhJBbVbJcp2Mt0IPAeNWuxTjeDpvad6mccuH3wQU~vJLs~8eVpBA48zuj6G6tcQvqqhsN0-y0qK9CsHLgktafB~G9rbgfTDG7130rAgj8qAxrt6w__&Key-Pair-Id=APKAIE5G5CRDK6RD3PGA)



![Panfungal T cells protect from infection in NSG mice upon adoptive transfer. (A-I) Recipient mice were humanized with autologous and unrelated HLA DR–matched PBMCs 1 day before intranasal A fumigatus infection (resulting in low [A-D] or high [E-I] fungal burden) followed by the intravenous infusion of 106 panfungal T cells the day after the infection. (A) Colony-forming units (log10 CFU) in lungs and brain, (B) lung histology (Periodic acid–Schiff [PAS]–stained sections; scale bars, 500 and 100 μm [upper insets]; and percentage of polymorphonuclear neutrophils [PMNs] in bronchoalveolar lavage [lower insets]), (C) gene expression, and (D) cytokine and chemokine production at 6 days after infection. (E) Colony-forming units (log10 CFU) in lungs of mice treated with PBMCs alone, panfungal T cells alone, or combination at 6 days after infection. (F) Colony-forming units (log10 CFU) in lungs and (G) lung histology (PAS-stained sections; scale bars, 100 μm; and percentage of PMNs in bronchoalveolar lavage [upper insets)] at 6 days after infection. (H) Colony-forming units (log10 CFU) in lungs, (I) lung histology (PAS-stained sections; scale bars, 200 μm [left]; and percentage of PMNs in bronchoalveolar lavage [upper insets]) and CD11c+ and CD11b+ cell infiltration, evaluated by immunofluorescence at 14 days after infection (scale bars, 100 μm). Results are the mean ± SD from 3 to 5 mice per group (*P < .05, **P < .01, T cells vs none; 2-way analysis of variance, Bonferroni post-test and Student t test). None, mice that received neither humanizing cells nor T cells.](https://ash.silverchair-cdn.com/ash/content_public/journal/bloodadvances/4/14/10.1182_bloodadvances.2020001565/2/m_advancesadv2020001565f7.png?Expires=1765101972&Signature=Tb1MSBPQEeWSTdYVuCvjeA~SCS-zolJ5pIgaXUsDhvA6NinrSu0~UShNY~3Yy-sjcbquxYtnbxHAXu8qFbB2aFJ1ZMOBiRlXc-WWdUa9lLGvzPlmZN0JTa5aF0ZLyT9nUi1Gy~-uTRKGUwDZ-K3k7eNASxOlLy1guERzCPougSzYn-WyNzDxQQNhlOubKZY1iscR5rmHPSg0UWpmoGNP5OLvZO1MmpO3cNEvLl4pd5ufA-9xiuX2RssNJTTQvVM2rd05K28pgKNrZ-pTdl-EvuyZWCiz4-5fOT06HyfV4CLQaF4G0ZnQCgpcdGSmDvZj9QkGTniIGvTWTeKhDmDEVw__&Key-Pair-Id=APKAIE5G5CRDK6RD3PGA)