Key Points
MDS is characterized by mutations in >40 genes, a complex structure of gene-gene interactions and extensive subclonal diversification.
The total number of oncogenic mutations and early detection of subclonal mutations are significant prognostic variables in MDS.
Abstract
Myelodysplastic syndromes (MDS) are a heterogeneous group of chronic hematological malignancies characterized by dysplasia, ineffective hematopoiesis and a variable risk of progression to acute myeloid leukemia. Sequencing of MDS genomes has identified mutations in genes implicated in RNA splicing, DNA modification, chromatin regulation, and cell signaling. We sequenced 111 genes across 738 patients with MDS or closely related neoplasms (including chronic myelomonocytic leukemia and MDS–myeloproliferative neoplasms) to explore the role of acquired mutations in MDS biology and clinical phenotype. Seventy-eight percent of patients had 1 or more oncogenic mutations. We identify complex patterns of pairwise association between genes, indicative of epistatic interactions involving components of the spliceosome machinery and epigenetic modifiers. Coupled with inferences on subclonal mutations, these data suggest a hypothesis of genetic “predestination,” in which early driver mutations, typically affecting genes involved in RNA splicing, dictate future trajectories of disease evolution with distinct clinical phenotypes. Driver mutations had equivalent prognostic significance, whether clonal or subclonal, and leukemia-free survival deteriorated steadily as numbers of driver mutations increased. Thus, analysis of oncogenic mutations in large, well-characterized cohorts of patients illustrates the interconnections between the cancer genome and disease biology, with considerable potential for clinical application.
Continuing Medical Education online
This activity has been planned and implemented in accordance with the Essential Areas and policies of the Accreditation Council for Continuing Medical Education through the joint sponsorship of Medscape, LLC and the American Society of Hematology.
Medscape, LLC is accredited by the ACCME to provide continuing medical education for physicians.
Medscape, LLC designates this Journal-based CME activity for a maximum of 1.0 AMA PRA Category 1 Credit(s)™. Physicians should claim only the credit commensurate with the extent of their participation in the activity.
All other clinicians completing this activity will be issued a certificate of participation. To participate in this journal CME activity: (1) review the learning objectives and author disclosures; (2) study the education content; (3) take the post-test with a 70% minimum passing score and complete the evaluation at http://www.medscape.org/journal/blood; and (4) view/print certificate. For CME questions, see page 3699.
Disclosures
The authors, Bob Löwenberg, Editor, and CME questions author Laurie Barclay, freelance writer and reviewer, Medscape, LLC, declare no competing financial interests.
Learning objectives
Describe mutations in myelodysplastic syndromes (MDS), including gene-gene interactions and subclonal diversification, based on a genetic study.
Explain the association of mutations in MDS with prognosis and other clinical outcomes.
Release date: November 21, 2013; Expiration date: November 21, 2014
Introduction
Large-scale sequencing of cancer genomes has now been completed for thousands of cancer samples. This initial discovery phase has uncovered many novel genes, pathways, and mutational processes implicated in cancer development.1 Now, attention is increasingly turning to understanding how these cancer genes knit together, how they influence disease evolution, how they dictate clinical phenotype, and whether they can be used in a diagnostic setting to personalize clinical care.2 The considerable complexity observed in cancer genomes suggests that such aspirations will only be achieved through comprehensive analysis of large cohorts of well-characterized patients. Although initiation of prospective sample ascertainment is underway, there is considerable potential to address at least in part some of these questions with established cohorts.
Myelodysplastic syndromes (MDS) are hematological malignancies that present with abnormal blood counts and a risk of progression to acute myeloid leukemia (AML).3 Diagnosis depends on findings in peripheral blood and bone marrow examination, which can show poor interobserver reliability.4 An increasing number of cancer genes have been found to carry recurrent somatic mutations in MDS, including genes involved in signal transduction (JAK2, KRAS, CBL); DNA methylation (DNMT3A, TET2, IDH1/2); transcriptional regulation (EVI1, RUNX1, GATA2); chromatin modification (EZH2, ASXL1); and most recently, RNA splicing (SF3B1, U2AF1, SRSF2 and ZRSR2).5-16 Among these mutations, many are shared across the spectrum of myeloid neoplasms (myeloproliferative neoplasms [MPN], MDS/MPN, chronic myelomonocytic leukemia [CMML], and AML) and are likely to dictate morphological and clinical phenotypes.
To explore the interlocking genomic, biological, and clinical features of MDS, we performed a focused screen of 111 cancer genes in a large cohort of MDS patients and closely related neoplasms. Contrary to gene discovery studies that routinely screen matched tumor and constitutional DNA, large-scale gene resequencing is applied to tumor samples only. We developed new computational approaches for analysis, variant detection, determination of clonal phylogenies from limited number of mutations, and evaluation of combined prognostic accuracy of mutations in >100 genes. This unravels a network of complex genetic interactions that define critical steps in disease progression and identify potential diagnostic and prognostic biomarkers.
Methods
Patient samples and targeted DNA sequencing
Samples were obtained with written informed consent in accordance with the Declaration of Helsinki and appropriate Ethics Committee approvals from 738 patients (Table 1). Of these, 603 had MDS as subclassified by the World Health Organization in 200817 (with the exception of refractory cytopenia with multilineage dysplasia and ringed sideroblasts [RCMD-RS], which we maintain from the World Health Organization, 2002,18 as a separate category), 70 had CMML, 35 had progressive disease (MDS-AML), and 13 were of undefined MDS category or classified as MDS-MPN (including refractory anemia with ringed sideroblasts associated with marked thrombocytosis [RARS-T]). Where disease-modifying treatment was administered, duration of follow-up was considered complete without reaching the end-point (“censored”) at the time of starting disease-modifying treatment (specifically, allogeneic stem cell transplantation, aggressive chemotherapy, or hypomethylating agents). Genomic DNA was obtained from peripheral blood granulocytes (n = 431) or bone marrow mononuclear cells (n = 307). Germline DNA was not generally available.
Genomic DNA samples underwent wholegenome amplification. RNA baits were designed to capture a panel of 111 genes (supplemental Table 1, found on the Blood Web site) selected on the basis of prior implication in the pathogenesis of myeloid disease by recurrent somatic mutation19 ; recurrent mutation or aberrations in common cancers20 ; candidates genes from in-house data; or candidate genes mapping within regions of common copy number alterations.19 Sequencing libraries were generated 96-well format, each carrying a unique DNA barcode (supplemental Figure 1) and sequenced on 2 lanes of an Illumina HiSeq.
To identify base substitutions and small insertions or deletions, we analyzed each sample using in-house algorithms11,21 but against an unrelated reference sample. In the absence of a matched control sample, it is challenging to distinguish with perfect accuracy between somatic and germline variants. However, the landscape of truly somatic mutations in these cancer genes has been well established from large-scale genomics studies,10,22,23 allowing confident predictions to be made. To account for the absence of matched control, we developed a bespoke variant selection pipeline applying stringent criteria (see supplemental Methods).
Potential caveats of our protocol could be (1) that whole genome amplification may result in nonuniform representation of the mutations in the diagnostic sample; (2) that artifacts may be introduced during the amplification; or (3) that the proportion of DNA molecules representing a variant may not be reflective of the true allele burden in the diagnostic sample. To test these caveats, we used 6 control datasets: (1) exome sequencing of genomic and constitutional DNA for 10 samples that underwent whole genome amplification (WGA) and targeted resequencing; (2) 18 technical replicates using genomic and WGA DNA; (3) comparison of targeted resequencing results for SF3B1 and TET2 with those obtained previously11 ; (4) WGA and targeted gene screen of 22 normal DNA samples; (5) analysis of the 111 genes from 56 normal blood exomes using the identical bioinformatics pipeline; and (6) exome or whole-genome sequencing data from 317 constitutional DNA samples.
Statistical analysis
Pairwise associations between genes were evaluated by Fisher tests corrected for multiple hypothesis testing. For the 595 patients with available outcome data, leukemia-free survival was the end-point, and log-rank tests were used for univariate hypothesis tests. For multivariate survival analyses, missing data were estimated by multiple imputation,24 and Cox proportional hazards models were built from 3 sets of predictor variables using stability selection.2 Accuracy of outcome predictions was averaged across 5 cross-validation samples from models built on the remaining 4 out of 5 patients. We use the least absolute shrinkage and selection operator27 variable selection in Cox’s proportional hazards method27 and receiver operating characteristic curves to illustrate predictive accuracy.
Variant allele fraction estimates were used to evaluate clonal and subclonal variant relationships within each sample. To adjust for the lower mapping qualities associated with indels, we constructed reference genome alignments for each variant to retrieve all reads supporting the variant and produce accurate estimates. We constructed 95% confidence intervals (CI) intervals, taking into account total depth and local copy number state at the variant position. Clonal relationships were tested using Pearson goodness-of-fit tests.
Results
Targeted gene sequencing in MDS
We sequenced 111 genes across 738 patients, resulting in 2260 high-confidence variants (supplemental Table 2). Coverage across the targeted regions was excellent (supplemental Figure 2).
The aim was to define for each patient the potential driver mutations implicated in their disease. In keeping with widely accepted conventions in the genomics literature, we used a pragmatic, purely genetic definition of driver mutations,1,28,29 defined on the basis of published studies describing a statistically significant excess of somatic mutations in a given cancer gene. The expected pattern of somatic mutations in the given gene was defined from the literature, typically inactivating mutations for tumor suppressor genes and hot-spot mutations for oncogenes. Every variant identified in this study was then compared against these expected patterns and triaged into “driver mutations,” “possible oncogenic variants,” or “unknown significance” (see supplemental Methods for further details). This definition of driver mutation is not dependent on whether there is functional evidence of oncogenic potential.
Study controls
To assess whether absence of germline DNA would annotate rare germline polymorphisms as driver mutations, we evaluated calls identified by gene resequencing to those identified by exome analysis from matched tumor and constitutional samples in 10 patients. Of 21 somatic variants found in the 111 genes in the current panel, all were identified, and 20 out of 21 (supplemental Table 3) passed the stringent filtering criteria applied (95.2% sensitivity). We analyzed the exomes through our unmatched pipeline; all mutations annotated as drivers were indeed somatic in the exome data. No oncogenic variants were called in any of the 78 (22 + 56) constitutional samples.
We tested sensitivity and specificity of the protocol in comparison with orthogonal sequencing approaches. Of 147 known SF3B1 mutations in the cohort, all were identified, and we called an additional 11 missed originally because of poor coverage. Similarly, for the cohort of 184 patients with known TET2 status, we recaptured 20 out of 21 mutations (95%) and called an additional 3.
To test whether WGA biased allele representation, we analyzed sequencing data from a subset of patients in whom native and amplified DNA had been studied. Variant allele fractions from WGA samples were not significantly different from those from the same patients’ genomic DNA (supplemental Tables 3-4), consistent with published findings.30 The overall distribution of variant allele fractions for variants classified as oncogenic or possible oncogenic had the same distribution as reported for validated mutations identified by exome sequencing11,23 (supplemental Figure 3A-B) and was clearly distinct from that for variants known to be germline polymorphisms (supplemental Figure 3C).
These control data show that our design does not lead to significant over- or undercalling of driver mutations, systematic biases in allele fraction estimates, or excessive numbers of germline variants miscalled as driver mutations.
Gene mutations in MDS and related neoplasms
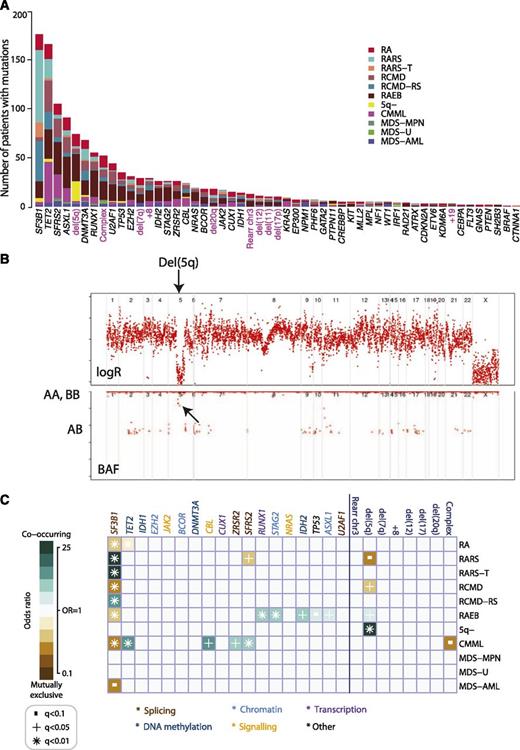
Oncogenic mutations were identified in 43 genes (Figure 1A). The splicing factor SF3B1 was the most frequently mutated in the cohort (24%), followed by TET2 (22%) and SRSF2 (14%). Only 4 genes were mutated in more than 10% of patients, with a further 3 genes carrying driver mutations in 5% to 10% patients. Notably, 36 genes were mutated in <5% of the patients, and in aggregate, mutations in these genes contribute 33.5% of all mutations identified. Among these, we found oncogenic mutations in IRF1, which we previously identified in 1 patient with RARS11 as well as the recently reported gene in AML, CUX1.31 Mutations in well-known cancer genes not previously implicated in MDS (EP300, CREBBP, and PTEN) were also observed. These variants are rare (<2%) but follow the same distribution of nonsense, splice, and frameshift mutations as seen in other cancers.
Genomic architecture of MDS. (A) Frequency of driver mutations identified in the sequencing screen or by cytogenetics in the cohort of 738 patients, broken down by MDS subtype. (B) Example of a copy number plot from a patient with a cytogenetically proven deletion on chromosome 5q. The upper panel depicts the normalized sequencing yields per exon; the lower panel depicts the variant allele fraction for germline SNPs. “AB” indicates the expected B-allele fractions for heterozygous SNPs; “AA” and “BB” indicate the position of the expected B-allele fractions for the homozygous SNPs AA and BB. (C) Associations among genes and cytogenetic abnormalities with disease subtypes in the study. Only associations with a q value (P value corrected for multiple hypothesis testing) <.1 are shown. Associations are colored by odds ratio. Blue-green colors depict gene-subtype associations that are observed together more than expected by chance, with brown colors depicting gene-subtype associations observed together less frequently than expected by chance.
Genomic architecture of MDS. (A) Frequency of driver mutations identified in the sequencing screen or by cytogenetics in the cohort of 738 patients, broken down by MDS subtype. (B) Example of a copy number plot from a patient with a cytogenetically proven deletion on chromosome 5q. The upper panel depicts the normalized sequencing yields per exon; the lower panel depicts the variant allele fraction for germline SNPs. “AB” indicates the expected B-allele fractions for heterozygous SNPs; “AA” and “BB” indicate the position of the expected B-allele fractions for the homozygous SNPs AA and BB. (C) Associations among genes and cytogenetic abnormalities with disease subtypes in the study. Only associations with a q value (P value corrected for multiple hypothesis testing) <.1 are shown. Associations are colored by odds ratio. Blue-green colors depict gene-subtype associations that are observed together more than expected by chance, with brown colors depicting gene-subtype associations observed together less frequently than expected by chance.
The overall distribution of gene mutations observed in the entire study set was mirrored within the disease categories (Figure 1A, supplemental Figure 4). To account for effects associated with each subtype, classification is considered as an independent variable in all analyses.
Detection of copy number changes from sequencing data
With cytogenetic abnormalities found in up to 40% of MDS patients, we assessed whether counts of sequencing reads could distinguish copy number aberrations (Figure 1B). Of 738 patients sequenced, credible copy number profiles were generated from 629 (85%). Abnormalities were seen in 101 (13%) patients, including deletions of 5q, 11q, 20q, and 17p; monosomy 7; trisomies of 8 and 21; and isochromosome X (supplemental Figure 5, supplemental Table 5). Importantly, in addition to common copy number alterations, lesions invisible to cytogenetics, such as uniparental disomy, were identified (supplemental Figure 5). Our findings suggest that with further optimization of this preliminary design, potentially by targeting germline single nucleotide polymorphism (SNPs), the sensitivity to detect clinically relevant copy number alterations32,33 could be increased. This would enable the simultaneous detection of both gene mutations and cytogenetic abnormalities in a single assay but requires further evaluation.
Oncogenic mutations identified in 78% patients with MDS
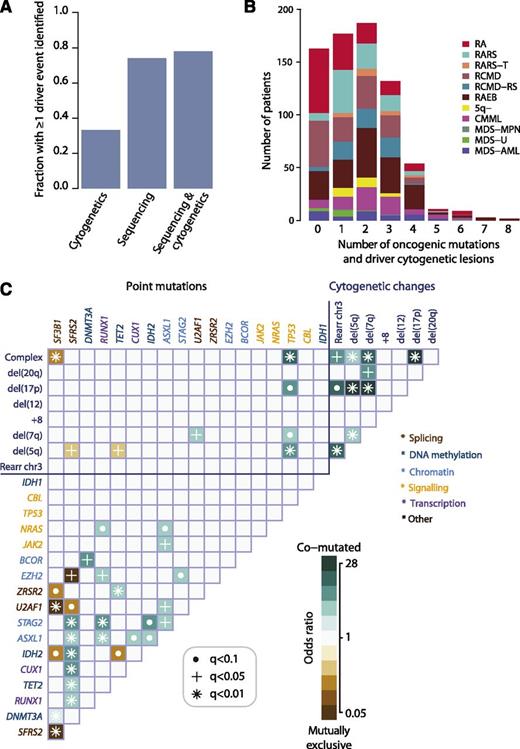
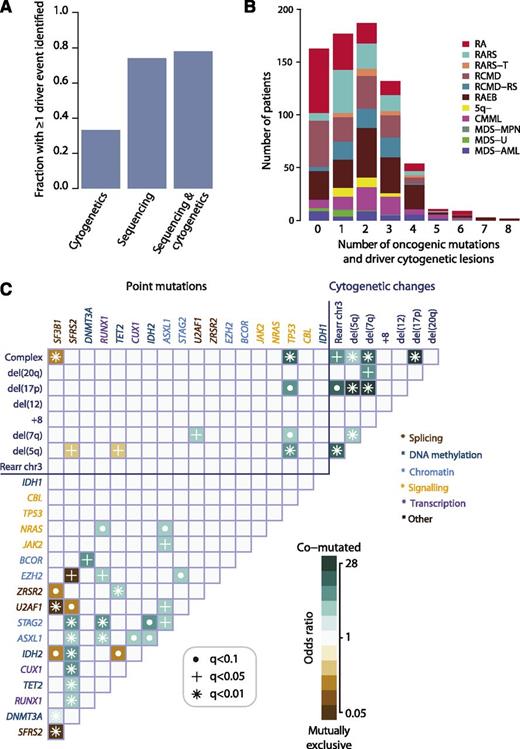
In total, 549 of 738 (74%; 95% CI, 71% to 77%) patients had at least 1 oncogenic point mutation or MDS-related copy number change detectable by sequencing (Figure 2A), whereas cytogenetic studies identified abnormalities in 33%. When sequencing and cytogenetics were combined, the fraction of patients with MDS-related oncogenic lesions increased to 78%. Indeed, 43% patients had 2 or 3 oncogenic point mutations or cytogenetic abnormalities, and 10% had 4 to 8 (Figure 2B).
Oncogenic mutations identified in MDS. (A) Fraction of patients with at least 1 driver mutation, identified by cytogenetics, targeted gene sequencing, or sequencing combined with bone marrow cytogenetics. The fraction reported for targeted gene sequencing includes both oncogenic point mutations and copy number changes identified from the sequencing data alone. (B) Distribution of number of driver mutations (including point mutations, indels, and cytogenetic lesions) per patient broken down by MDS subtype. (C) Pairwise associations among genes and cytogenetic abnormalities found in at least 10 patients. Only associations with a q value (false discovery rate adjusted P value) <.1 are shown. Associations are colored by odds ratio. Brown colors depict mutually exclusive gene pairs (one or the other mutated, but rarely both together), and blue-green colors depict gene pairs that are comutated more than expected by chance. Gene names are color coded as per index on right side panel of the figure.
Oncogenic mutations identified in MDS. (A) Fraction of patients with at least 1 driver mutation, identified by cytogenetics, targeted gene sequencing, or sequencing combined with bone marrow cytogenetics. The fraction reported for targeted gene sequencing includes both oncogenic point mutations and copy number changes identified from the sequencing data alone. (B) Distribution of number of driver mutations (including point mutations, indels, and cytogenetic lesions) per patient broken down by MDS subtype. (C) Pairwise associations among genes and cytogenetic abnormalities found in at least 10 patients. Only associations with a q value (false discovery rate adjusted P value) <.1 are shown. Associations are colored by odds ratio. Brown colors depict mutually exclusive gene pairs (one or the other mutated, but rarely both together), and blue-green colors depict gene pairs that are comutated more than expected by chance. Gene names are color coded as per index on right side panel of the figure.
We searched for pairwise gene associations, recognizing that pairs of genes could show a tendency to either cooccurrence or mutually exclusivity. Forty-six pairs were significant with false discovery rate <10% (Figure 2C; supplemental Table 6). Several of these have been reported previously.5,10,34-36 Mutually exclusive gene pairs often imply functional redundancy, especially if such genes are in the same biological pathway. Indeed, mutations in genes involved in the RNA splicing machinery were mutually exclusive, as in other studies.10,35 This implies that any one of these mutations is sufficient by itself, with no additional advantage accruing from more than 1 mutation in this pathway. Similarly, we confirm previous studies showing mutual exclusivity between mutations in TET2 and IDH2, both linked to disordered DNA hydroxymethylation.34
Functional redundancy, however, does not explain all the observed mutually exclusive associations. For example, EZH2 and SRSF2 mutations were never found together (q = 0.04), although they seemingly operate in different pathways. Similarly, we observe mutually exclusive associations between some genes and cytogenetic lesions as well as between IDH2 and SF3B1 (Figure 2C). In the latter case, it is striking that IDH2 shows a clear proclivity for comutation with SRSF2 (odds ratio, 6.7; 95% CI, 4.9–9.3; q = 0.0004), whereas SRSF2 is mutually exclusive with SF3B1. Thus, apart from functional redundancy, another explanation for mutually exclusivity is that some genes may only be transforming in specific genomic contexts.
In fact, SF3B1 and SRSF2 show striking differences in their sets of comutated genes. Thus, despite both genes being involved in the same pathway, the sets of comutated genes are different, implying that the functional consequences on RNA splicing cannot be identical. Furthermore, the fact that SF3B1 is linked to myelodysplasia with ring sideroblasts,10,11,37 whereas SRSF2 is particularly enriched in CMML10 (Figure 1C), indicates that major differences in disease phenotype can be driven by different combinations of comutated genes. Such relationships appear to underlie patterns of comutation in the study (supplemental Figure 6). These networks of interacting genes provide important clues to the biology of MDS. For example, a mouse model combining Asxl1 loss and Nras, which are comutated, showed a more aggressive, penetrant disease than did either lesion alone,38 confirming a biologically relevant interaction.
Clonal architecture in MDS describes preferred trajectories of disease evolution
During cancer development, functional mutations drive sequential waves of clonal expansion, and parallel sequencing has enabled this process to be characterized in some detail.39-41 Clonal evolution has been documented as MDS transforms to AML,42 and when de novo AML relapses after chemotherapy.43 Variant allele fractions can be used to estimate the proportion of tumor cells carrying a given mutation and identify clonal mutations (in all cells) or subclonal (in a fraction of cells).44 We applied this approach in patients with 2 or more oncogenic mutations (Figure 3A).
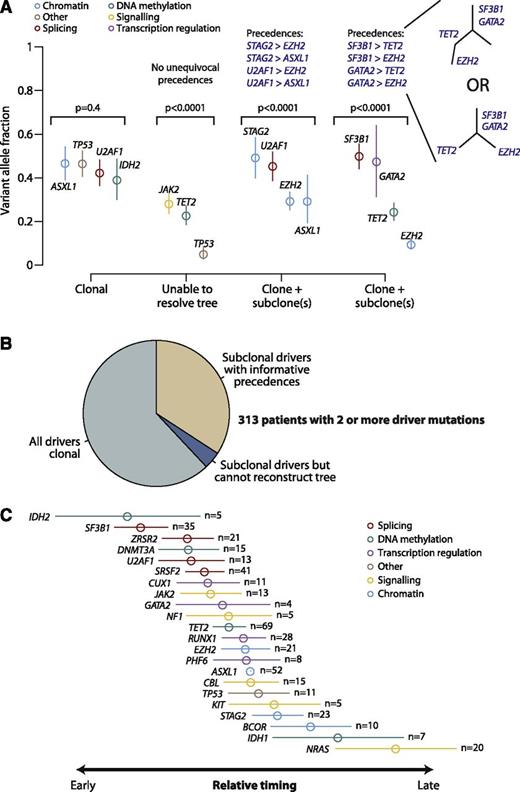
Clonal and subclonal driver mutations in MDS. (A) Variant allele fractions (y-axis) for driver mutations identified in 4 illustrative patients. The points show the observed allele fraction, with the vertical bars denoting 95% CIs in this fraction. The leftmost patient shows 4 driver mutations all at the same allele fraction. The second patient from the left shows statistical evidence for clonal heterogeneity, but the variant allele fractions are too low to establish phylogenetic relationships among mutations unambiguously. The rightmost 2 patients have statistically significant differences in observed allele fractions among driver mutations with some definitive phylogenetic structure. The phylogenetic tree cannot always be fully resolved (see possible trees for the 4th patient), but even with this uncertainty, 4 informative pairwise precedences can be unambiguously stated. (B) Pie chart showing the distribution of clonality and subclonality among 313 patients with 2 or more driver mutations. (C) Results of a Bradley-Terry model showing the relative temporal order of genes involved in at least 5 pairwise precedences. The estimates are calculated in relation to ASXL1 as the reference point, and standard errors are shown as horizontal bars. Genes are colored by their general biological function. A total of 107 patients contributed informative precedences.
Clonal and subclonal driver mutations in MDS. (A) Variant allele fractions (y-axis) for driver mutations identified in 4 illustrative patients. The points show the observed allele fraction, with the vertical bars denoting 95% CIs in this fraction. The leftmost patient shows 4 driver mutations all at the same allele fraction. The second patient from the left shows statistical evidence for clonal heterogeneity, but the variant allele fractions are too low to establish phylogenetic relationships among mutations unambiguously. The rightmost 2 patients have statistically significant differences in observed allele fractions among driver mutations with some definitive phylogenetic structure. The phylogenetic tree cannot always be fully resolved (see possible trees for the 4th patient), but even with this uncertainty, 4 informative pairwise precedences can be unambiguously stated. (B) Pie chart showing the distribution of clonality and subclonality among 313 patients with 2 or more driver mutations. (C) Results of a Bradley-Terry model showing the relative temporal order of genes involved in at least 5 pairwise precedences. The estimates are calculated in relation to ASXL1 as the reference point, and standard errors are shown as horizontal bars. Genes are colored by their general biological function. A total of 107 patients contributed informative precedences.
Applying this logic across 313 patients with 2 or more driver mutations, 62% showed only clonal driver mutations, and in a further 4% the subclonal fractions were too low to reconstruct phylogenetic relationships (Figure 3B). The remaining 34% of patients had strong statistical evidence for the existence of clonal as well as subclonal driver mutations in which we could robustly define a set of pairwise precedences reflecting the temporal order of acquisition. With the large sample size of patients available, there were clear trends across the set of mutated genes, with some occurring consistently earlier than others (supplemental Figure 7).
Using these pairwise precedences, we calculated a global ranking of MDS genes reflecting how early in disease evolution they are mutated (Figure 3C). Strikingly, mutations in genes involved in RNA splicing and DNA methylation occur early, whereas driver mutations in genes involved in chromatin modification and signaling often occur later. These are not absolute rules (supplemental Figure 7) but establish robust trends for the observed temporal acquisition.
Our data suggest a hypothesis of genetic “predestination,” that early mutations shape the future trajectories of clonal evolution of a cancer through constraints on the repertoire of cooperating genetic lesions. Here, we find that splicing factors such as SF3B1 and SRSF2 are typically mutated early. However, the 2 genes exhibit pronounced and contrasting preferences for which genes are most likely to provide selective advantage subsequently, driving considerable morphologic differences (Figure 1B). We note that this hypothesis is based on inferences from a cross-sectional study. Confirmation would require longitudinal analyses of serial samples drawn from large cohorts.
Clonal and subclonal mutations affect prognosis equally
Follow-up data were available for 595 patients (Table 1). Of 24 genes mutated in >5 patients, 8 genes were associated with significantly worse leukemia-free survival if mutated and 1 gene (SF3B1) with a better leukemia-free survival (supplemental Figure 8). These findings replicate previous studies.5,9,11,35-37,45,46
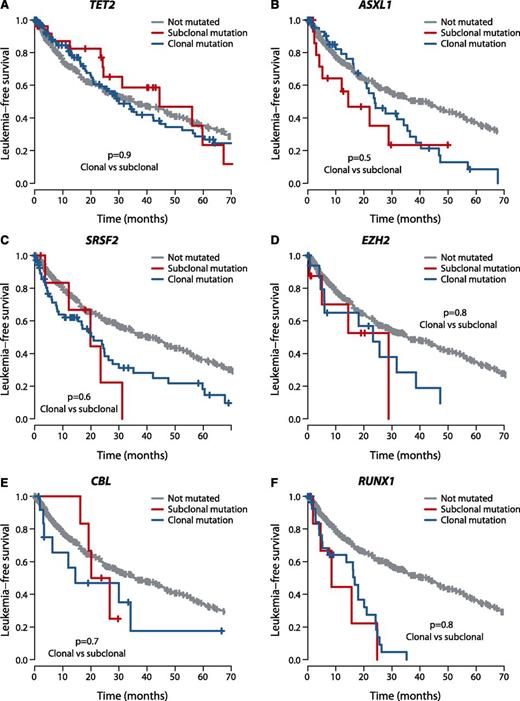
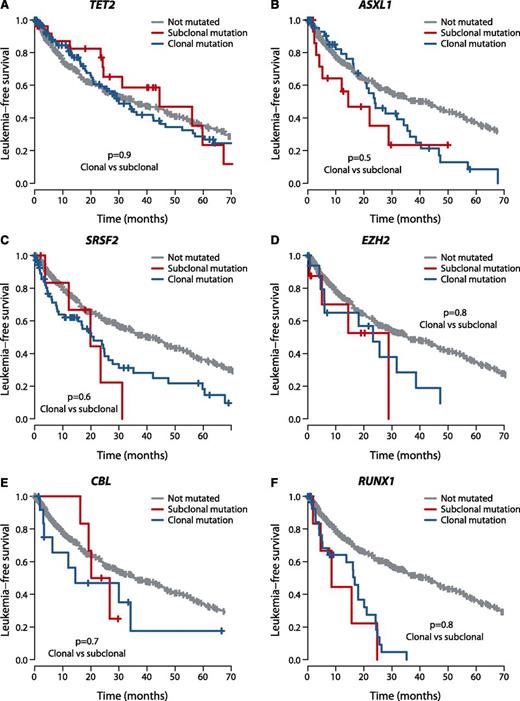
We assessed whether the effects on clinical outcome of a given gene differed by whether mutations were clonal or subclonal. To explore this, we compared leukemia-free survival of patients with mutations in the dominant clone to that of patients with mutations in the same gene present in a minor subclone. Strikingly, we found no significant difference in leukemia-free survival between clonal and subclonal mutations for the 6 genes with published survival effects11,35,46 in which we observed at least 5 patients with subclonal driver mutations (Figure 4), highlighting the importance of detecting these subclonal mutations. With a challenging classification and a chronic clinical course, this information could enable early identification of high-risk patients as well as the detection of new emerging subclones of prognostic significance.
Outcome by whether driver mutations are clonal or subclonal. Leukemia-free survival for patients showing no mutation (gray), clonal driver mutations (blue), or subclonal driver mutations (red) for (A) TET2, (B) ASXL1, (C) SRSF2, (D) EZH2, (E) CBL, and (F) RUNX1. The P values denote the hypothesis test of whether splitting driver mutations into clonal or subclonal categories improves fit in a Cox proportional hazards model.
Outcome by whether driver mutations are clonal or subclonal. Leukemia-free survival for patients showing no mutation (gray), clonal driver mutations (blue), or subclonal driver mutations (red) for (A) TET2, (B) ASXL1, (C) SRSF2, (D) EZH2, (E) CBL, and (F) RUNX1. The P values denote the hypothesis test of whether splitting driver mutations into clonal or subclonal categories improves fit in a Cox proportional hazards model.
Outcome correlates with number of driver mutations
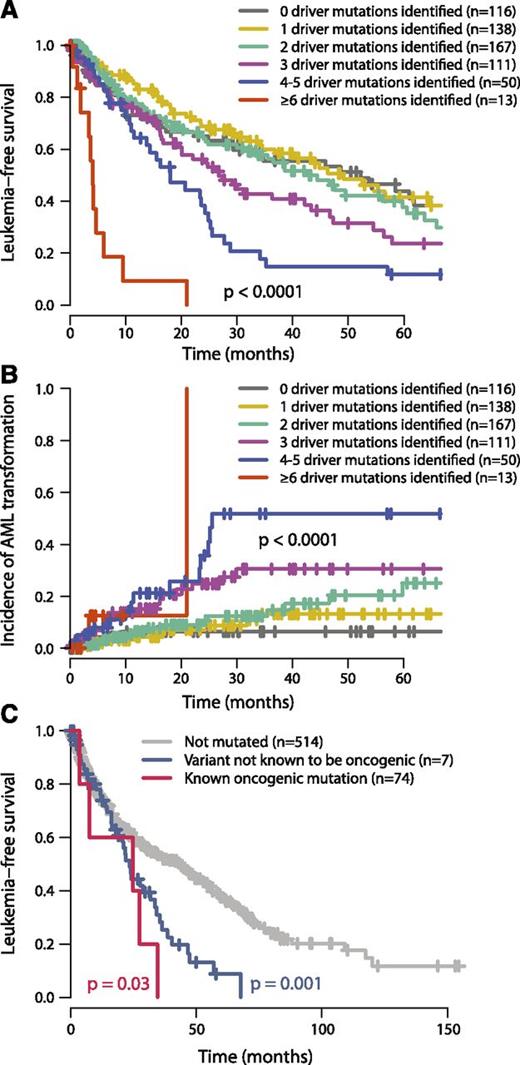
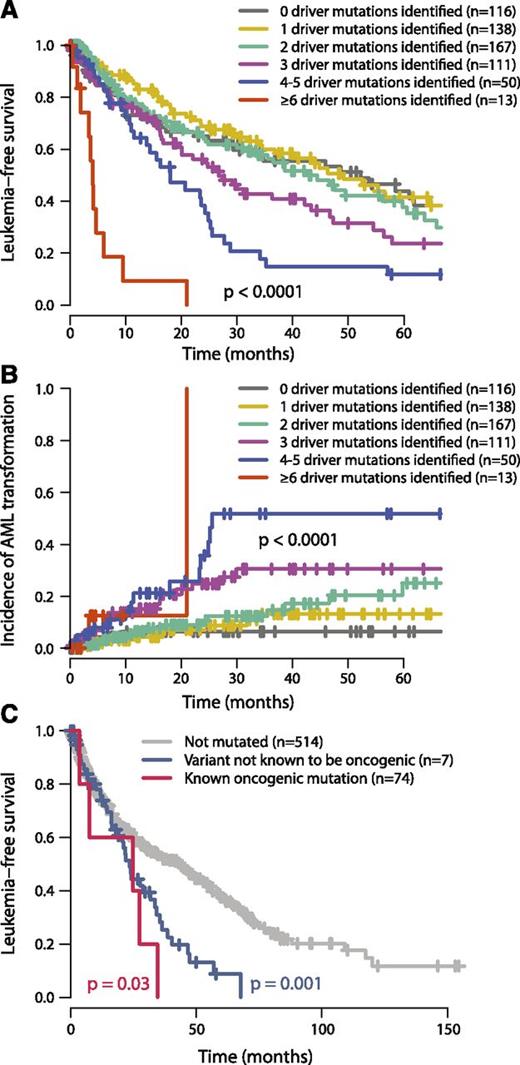
In our study, leukemia-free survival negatively correlates with the combined number of oncogenic mutations and cytogenetic lesions (P < .0001; Figure 5A). This remains true if only oncogenic gene mutations (excluding cytogenetic aberrations) are considered (P = .002, supplemental Figure 9) and remains significant independent of TP53 or SF3B1 mutation status. The estimated median leukemia-free survival for patients with 1 oncogenic mutation or cytogenetic lesion was 49 months, dropping to 42, 27, 18, and 4 months for patients with 2, 3, 4 to 5, and ≥6 mutations, respectively. This was mirrored by a monotonic increase in rates of transformation to acute leukemia as the number of driver variants increased (P < .0001; Figure 5B). These data chime with observations that transformation from MDS to AML or relapse of de novo AML is driven by clonal evolution associated with acquisition of new driver mutations.42,43
Relationship between number of oncogenic mutations and outcome. (A) Leukemia-free survival for patients broken down by how many oncogenic mutations were identified (including both point mutations and cytogenetic lesions). The mean number of cytogenetic lesions per patient was 0.2, 0.4, 0.5, 0.8, and 2.3 for patients with 1, 2, 3, 4 to 5, and 6 or more oncgenic mutations, respectively. The P value denotes the log-rank test of the null hypothesis that all groups had the same leukemia-free survival. (B) Incidence of transformation to acute leukemia broken down by how many oncogenic mutations were identified. (C) Leukemia-free survival for patients with no ASXL1 mutations (gray), “known oncogenic” mutations (blue), and “possible oncogenic” mutations or variants “of unknown significance” (red). The P values refer to log-rank tests comparing the class of mutation to those patients without ASXL1 mutations.
Relationship between number of oncogenic mutations and outcome. (A) Leukemia-free survival for patients broken down by how many oncogenic mutations were identified (including both point mutations and cytogenetic lesions). The mean number of cytogenetic lesions per patient was 0.2, 0.4, 0.5, 0.8, and 2.3 for patients with 1, 2, 3, 4 to 5, and 6 or more oncgenic mutations, respectively. The P value denotes the log-rank test of the null hypothesis that all groups had the same leukemia-free survival. (B) Incidence of transformation to acute leukemia broken down by how many oncogenic mutations were identified. (C) Leukemia-free survival for patients with no ASXL1 mutations (gray), “known oncogenic” mutations (blue), and “possible oncogenic” mutations or variants “of unknown significance” (red). The P values refer to log-rank tests comparing the class of mutation to those patients without ASXL1 mutations.
The International Prognostic Scoring System (IPSS), revised in 2012,33 is the most widely used prognostication scheme in MDS. Gene mutations are currently not included, although there are data to show that prognostic prediction can be improved by their inclusion.45 We find that the number of oncogenic mutations continues to provide independent prognostic information after stratification by the IPSS classification (P = .0004; supplemental Figure 9).
Twenty-two percent of MDS patients showed no evidence of known oncogenic point mutations or cytogenetic aberrations. Patients with no identified oncogenic events show leukemia-free survival and rates of transformation to acute leukemia similar to those with 1 to 2 driver mutations (Figure 5A-B). This suggests that they have a disease course typical of MDS. Several possible explanations may underlie why we did not identify any mutations in this group. Because we identified no systematic differences in the overall distribution of driver mutations between samples derived from bone marrow and those from peripheral blood, source of DNA is not a major factor. There are several new genes that are targets for recurrent mutation in myeloid malignancies—such as SETBP1, SMC1A, and SMC347,48 —that were published after this study was performed and could account for a proportion of the unaccounted patients.
Furthermore, even in well-characterized genes, there could be rare driver mutations. For example, we found 10 variants in ASXL1 at residues not previously characterized and consequently annotated as variants of unknown significance. The prognosis for the 10 patients with these mutations was significantly worse than for patients without ASXL1 variants (P = .03, log-rank test) and tracked the survival curve for patients with known oncogenic mutations (Figure 5C). This suggests that at least some of these variants may be of functional importance, although definitive proof would require establishing that they are somatically acquired, recurrent in a larger cohort, and had prognostic effects independent of other variables. Albeit exploratory, this analysis suggests that larger sample sizes with matched-to-clinical data will support identification of rare driver mutations.
Making prognostic predictions from sequencing data
The refinement of the composite genetic architecture that underpins MDS has led to a growing anticipation of how these findings can be translated into clinical practice. We therefore explored what proportion of the variance in clinical outcomes could be accounted for by clinical and genomic features. These include morphological variables, demographic data, peripheral blood counts at diagnosis, cytogenetics, and gene mutations.
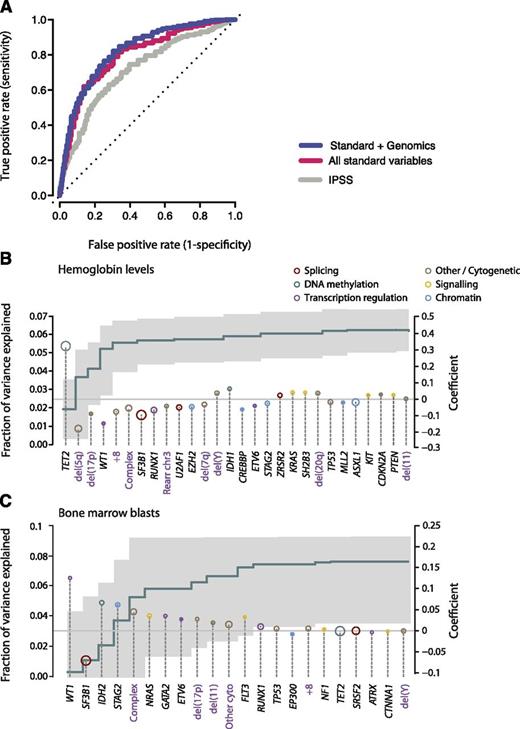
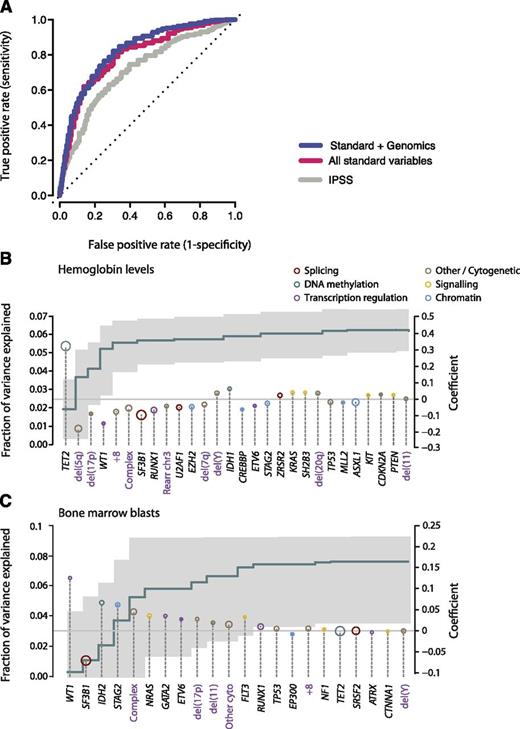
We considered 3 potential datasets: the IPSS; a dataset derived from all standard clinical variables (including peripheral blood counts, bone marrow morphology, cytogenetics, and demographic data); and a dataset that combines standard and genetic variables together. Owing to missing data, we were not able to calculate IPSS—Revised (IPSS-R) status. For each dataset, the variables that had sufficient independent predictive power to enter these models are detailed in supplemental Table 7. When compared with the IPSS (area under the curve [AUC] = 0.76 at 90 months), standard variable sets show an increase in the prognostic potential (AUC = 0.80 at 90 months) in relation to that obtained by the IPSS alone (Figure 6A). This is in accordance with recent observations from the IPSS-R, which has refined the incorporation of further cytogenetic abnormalities as well as the degree of cytopenias and bone marrow blast percentage.33 Incorporation of the point mutation data achieves a marginal nonsignificant increase (AUC = 0.82 at 90 months), but the 2 curves are broadly overlapping. This indicates that the amount of prognostic information contained in each of the 2 datasets is similar and implies that there is some redundancy in the prognostic information between these 2 sets.
Predicting leukemia-free survival. (A) Receiver operating characteristic curves on cross-validation subsets for leukemia-free survival using 3 variable datasets: IPSS (gray); standard variable predictions made using all variables available from peripheral blood counts bone marrow evaluation, cytogenetics, and demographics (red); and sequencing in combination with all standard variables (blue). The further the curve deviates from the diagonal, the more informative the prognostic model is. (B) Multivariate model to predict hemoglobin levels from driver mutations. The green step curve shows the cumulative proportion of variance (left y-axis) in hemoglobin levels explained by each of the genetic variables as one proceeds from left to right along the x-axis. The gray shaded area represents the 95% CI for this curve. Coefficient estimates for each gene in the model including all variables (right y-axis) are shown as circles, colored by biological pathway and sized by the number of patients with the given lesion. Coefficients above 0 indicate positive correlation with hemoglobin levels. (C) Multivariate model to predict bone marrow blast count from driver mutations, as for panel B.
Predicting leukemia-free survival. (A) Receiver operating characteristic curves on cross-validation subsets for leukemia-free survival using 3 variable datasets: IPSS (gray); standard variable predictions made using all variables available from peripheral blood counts bone marrow evaluation, cytogenetics, and demographics (red); and sequencing in combination with all standard variables (blue). The further the curve deviates from the diagonal, the more informative the prognostic model is. (B) Multivariate model to predict hemoglobin levels from driver mutations. The green step curve shows the cumulative proportion of variance (left y-axis) in hemoglobin levels explained by each of the genetic variables as one proceeds from left to right along the x-axis. The gray shaded area represents the 95% CI for this curve. Coefficient estimates for each gene in the model including all variables (right y-axis) are shown as circles, colored by biological pathway and sized by the number of patients with the given lesion. Coefficients above 0 indicate positive correlation with hemoglobin levels. (C) Multivariate model to predict bone marrow blast count from driver mutations, as for panel B.
We have previously shown that the SF3B1 mutation status is a significant predictor for the presence of ringed sideroblasts in the bone marrow.37 To evaluate other such genotype-phenotype correlations, we used multivariate models to predict clinical variables of prognostic significance (such as ringed sideroblasts, hemoglobin count, bone marrow blasts) using driver mutations (point mutations and cytogenetic alterations) as the predictors (Figure 6B-C). TET2 mutations and del(5q) were the most important genetic predictors of hemoglobin levels, the former being positively correlated and the latter negatively correlated (Figure 6B). In combination, genetic variables can explain 0.063% of the variance observed in hemoglobin levels. Similarly, mutations in WT1, IDH2, STAG2, and NRAS, as well as a complex karyotype, correlated strongly with percentage of bone marrow blasts, whereas SF3B1 mutations predicted a low fraction of blasts (Figure 6C).
Taken together, these data demonstrate that inclusion of genomic data should improve prognostic algorithms for MDS. Given that many genes are rarely mutated and show the complex patterns of comutation, much larger sample sizes will be required to realize this potential. The IPSS-R used 7012 patients33 ; a similar sample set analyzed with the protocol outlined here may be necessary for robust prognostic schemes that incorporate genomic variables.
Discussion
The large sample size and extent of gene sequencing reported here provides an unprecedented glimpse into the genomic landscape of MDS and how this impacts on clinical phenotype. For the first time, we have performed targeted gene resequencing of a clinical cohort in the absence of constitutional matched DNA. We have developed several computational approaches to deal with data sets on this scale, especially in measuring combined prognostic information and inferring temporal evolution of gene mutations. We observe the same frequencies of mutations in specific genes as reported in the literature, confirm known gene-gene interactions, and validate published correlations with patient outcome.
We identified at least 1 genomic alteration in 78% of the patients studied. In the time since our bait set was synthesized, several new myeloid genes have been described, including SMC1A, SMC3, and SETBP1,47,48 meaning that this figure could be improved in the future. A conservative variant annotation was used, with many variants classified as of “unknown significance”; larger sample sizes may enable some of these to be reclassified in the future.
In MDS, several key observations emerge. Many genes are targets for mutation in MDS, but the vast majority are rare (<5%). One of the strongest predictors of outcome is the number of driver mutations identified in a patient. Twenty percent of mutations in patients with 1 driver mutation map to genes mutated in <2% of cases. This is also true for 30% to 40% of additional acquired mutations (3rd, 4th, etc). Thus, for use in diagnostic screening, sequencing a comprehensive set of well-characterized genes is critical.
RNA splicing is the most commonly mutated pathway in MDS, and we find strong evidence that mutations in splicing factors occur early in disease evolution. These mutations play a major role in determining the clinical features of the disease, with differences in morphological features seen on bone marrow biopsy and in leukemia-free survival. Intriguingly, not only do these mutations occur early, but they may also influence the subsequent genomic evolution of the disease, because the patterns of cooperating mutations are strikingly different between, for example, SF3B1 and SRSF2. Confirmation of this hypothesis would require analysis of serial samples.
It will be increasingly feasible to undertake sequencing of DNA from sequential blood samples on, say, an annual basis in MDS patients. Our data suggest that the emergence of new driver mutations, even if they are still subclonal, can have significant implications for the future disease course. It should therefore be possible to identify patients whose disease is progressing before symptoms associated with higher-risk disease are manifested.
There has been considerable excitement about the opportunity that massively parallel sequencing offers as a cost-effective, front-line diagnostic tool for cancer. Our study is a harbinger of future comprehensive genomic analyses of large cohorts of patients with clinical data across different tumor types. Many of the themes seen here will emerge repeatedly, providing important insights into the genomic architecture of cancer and how this drives the phenotypic and clinical heterogeneity we see in patients.
The online version of this article contains a data supplement.
There is an Inside Blood commentary on this article in this issue.
The publication costs of this article were defrayed in part by page charge payment. Therefore, and solely to indicate this fact, this article is hereby marked “advertisement” in accordance with 18 USC section 1734.
Acknowledgments
We thank Tayside Tissue Bank, Ninewells Hospital, Dundee, for providing specimens for analysis and Ann Hyslop and Norene Keenan (both of the University of Dundee) for data curation. We are grateful to the Core Pipelines team at the Wellcome Trust Sanger Institute for library production and sequencing. Genome sequence data have been deposited at the European Genome-Phenome Archive (http://www.ebi.ac.uk/ega/).
This work was supported by a Specialized Center of Research grant from the Leukemia Lymphoma Society, the Kay Kendall Leukaemia Fund, and the Wellcome Trust (grant reference 077012/Z/05/Z). P.J.C. is personally funded through a Wellcome Trust Senior Clinical Research Fellowship (grant reference WT088340MA). P.V.L. is a postdoctoral researcher of the Research Foundation Flanders. Studies performed at the Department of Hematology Oncology, Fondazione Istituto Di Ricovero e Cura a Carattere Scientifico, Policlinico San Matteo, and the Department of Molecular Medicine, University of Pavia, were supported by grants from Associazione Italiana per la Ricerca sul Cancro, Fondazione Cariplo, MIUR (PRIN 2010-2011), FIRB (project RBAP11CZLK), and Fondazione Berlucchi. In particular, M.C. acknowledges funding from the Associazione Italiana per la Ricerca sul Cancro Special Program “Molecular Clinical Oncology 5 per mille” (project 1005). L.Q. and P.V. acknowledge support from the Medical Research Council funding through the Molecular Haematology Unit and Disease Team Award. P.V. also acknowledges support from the Leukemia Lymphoma Research (LLR) Project Grant (12019). J.B. and N.C.P.C. are supported by LLR programme grants. P.V. and J.B. are supported by the Blood Theme in the National Institute for Health Research Oxford Biomedical Research Centre based at Oxford University Hospitals Trust, Oxford. E.H.L. has been supported by the Swedish Cancer Society. A.R.G. is supported by grants from LLR, Leukemia Lymphoma Society, Cancer Research United Kingdom, and the National Institute for Health Research Cambridge Bioresource.
Authorship
Contribution: E.P. and P.J.C. designed the study, reviewed data analysis, and wrote the manuscript; E.P. analyzed the sequencing data, curated clinical datasets, and performed overall bioinformatic analysis; M.G. performed statistical analysis and computational modeling; D.C.W. performed statistical analysis; P.V.L. generated copy number profiles; G.G., K.R., J.W.T., J.H., D.R.J., A.P.B., L.M., S.H., A.P., and S.F. supported variant calling algorithms and sequence data processing pipelines; P.E., L.M., S.O., C.H., C.L., I.A., A.G., and G.W. performed sample preparation and experiments; M.G., A.P., L.Q., A.S., G.W., C.G.-P., N.C.P.C., A.R.G., J.B., P.V., E.H.-L., D.B., M.G.D.P., M.R.S., and M.C. diagnosed patients and prepared samples. All authors reviewed the manuscript during its preparation.
Conflict-of-interest disclosure: The authors declare no competing financial interests.
Correspondence: Peter Campbell, Wellcome Trust Sanger Institute, Hinxton, CB10 1SA, United Kingdom; e-mail: pc8@sanger.ac.uk.

