Key Points
Risk assessment is crucial in patients with CMML because survival may range from a few months to several years.
Integrating clinical features, morphology, and genetic lesions significantly improves risk stratification in CMML.
Abstract
Chronic myelomonocytic leukemia (CMML) is a myelodysplastic/myeloproliferative neoplasm with variable clinical course. To predict the clinical outcome, we previously developed a CMML-specific prognostic scoring system (CPSS) based on clinical parameters and cytogenetics. In this work, we tested the hypothesis that accounting for gene mutations would further improve risk stratification of CMML patients. We therefore sequenced 38 genes to explore the role of somatic mutations in disease phenotype and clinical outcome. Overall, 199 of 214 (93%) CMML patients carried at least 1 somatic mutation. Stepwise linear regression models showed that these mutations accounted for 15% to 24% of variability of clinical phenotype. Based on multivariable Cox regression analyses, cytogenetic abnormalities and mutations in RUNX1, NRAS, SETBP1, and ASXL1 were independently associated with overall survival (OS). Using these parameters, we defined a genetic score that identified 4 categories with significantly different OS and cumulative incidence of leukemic evolution. In multivariable analyses, genetic score, red blood cell transfusion dependency, white blood cell count, and marrow blasts retained independent prognostic value. These parameters were included into a clinical/molecular CPSS (CPSS-Mol) model that identified 4 risk groups with markedly different median OS (from >144 to 18 months, hazard ratio [HR] = 2.69) and cumulative incidence of leukemic evolution (from 0% to 48% at 4 years, HR = 3.84) (P < .001). The CPSS-Mol fully retained its ability to risk stratify in an independent validation cohort of 260 CMML patients. In conclusion, integrating conventional parameters and gene mutations significantly improves risk stratification of CMML patients, providing a robust basis for clinical decision-making and a reliable tool for clinical trials.
Introduction
Chronic myelomonocytic leukemia (CMML) is a myeloid neoplasm that shares both dysplastic and proliferative features.1,2 The French-American-British (FAB) classification distinguished 2 subtypes of CMML, a myelodysplastic and a myeloproliferative variant, based on a leukocyte count less than or equal or >13 × 109/L, respectively.3 The World Health Organization (WHO) in its classification of myeloid neoplasms included CMML in the category of myelodysplastic/myeloproliferative neoplasms (MDS/MPN),4 and in the 2016 revision recognized the dysplastic and proliferative types, and differentiated 3 groups of CMML according to the percentage of blasts in bone marrow (BM).5
The hematologic and morphologic features of CMML are highly heterogeneous, varying from predominantly myelodysplastic to mainly proliferative features, and the clinical course is extremely variable, with wide differences in survival and risk of evolution into acute myeloid leukemia (AML).6 Different prognostic scoring systems were developed in the attempt to stratify individual patient risk.7-12 We recently developed and validated a CMML-specific Prognostic Scoring System (CPSS),13 which combined cytogenetic abnormalities,14 disease subtype according to FAB and WHO classifications, and red blood cell (RBC) transfusion dependency, and stratified patients into 4 different risk groups with significantly different survival and risk of AML evolution.
Recurrent somatic mutations have been identified in a high proportion of patients with CMML. Mutant genes encode signaling molecules (NRAS, KRAS, CBL, and JAK2), epigenetic regulators (TET2, IDH1, IDH2, DNMT3A, ASXL1, and EZH2), splicing factors (SRSF2, SF3B1, ZRSR2, and U2AF1), and transcription factors (RUNX1).15-20 More recently, mutations in SETBP1, ETNK1, and CSF3R have been identified in patients with MDS/MPN, including CMML.18,19,21 TET2 and SRSF2 mutations are the most prevalent in CMML,16,22 and the co-occurrence of mutations in these 2 genes has been found to be highly specific for myeloid neoplasms with monocytosis.23 Associations between somatic mutations and disease phenotype have been suggested, with mutations in signaling pathways and the DNA methylation pathway being predominant in myeloproliferative and myelodysplastic CMML subtypes, respectively.24
In addition, selected mutated genes have been recognized to provide useful prognostic information.20,22,25,26 In particular, mutations in ASXL1 were consistently reported to have an independent prognostic value,16,26,27 and have been recently demonstrated to be of additive value to a clinically-based risk assessment.20,26 Conversely, conflicting results have been provided by the studies published so far on the prognostic relevance of other gene mutations.22,26,28
In this study, we performed a comprehensive mutation analysis of genes implicated in myeloid malignancies in 2 independent cohorts of well-annotated patients with CMML from different institutions, with the aim to dissect the relationship between genotype and disease phenotype and to integrate mutation analysis into a clinical/molecular prognostic scoring system that may improve individual patient risk assessment.
Patients and methods
Patients’ characteristics and clinical procedures
This study included 2 cohorts of CMML patients diagnosed according to the criteria of the 2008 WHO classification of myeloid neoplasms4 and its 2016 revision5 : a learning cohort, in which we conducted investigations aimed at defining the variables to be included in the prognostic model, and a validation cohort, in which we evaluated whether the prognostic value of the scoring system was confirmed. The learning cohort consisted of 214 CMML patients diagnosed at different institutions: Istituto di Ricovero e Cura a Carattere Scientifico (IRCCS) Fondazione Policlinico San Matteo, Pavia, Italy; Hospital Universitario y Politecnico La Fe, Valencia, Spain; University Hospital Düsseldorf, Düsseldorf, Germany; Hospital Arnau de Vilanova, Valencia, Spain; and the Hospital de La Ribera, Alzira, Spain. The validation cohort consisted of 260 CMML patients diagnosed at the MLL Munich Leukemia Laboratory, Munich, Germany, and at the Fondazione IRCCS Policlinico San Matteo, Pavia, Italy.
This study was approved by the Ethics Committee of the Fondazione IRCCS Policlinico San Matteo and other local Institutional Review Boards. The procedures followed were in accordance with the Declaration of Helsinki of 1975, as revised in 2000, and samples were obtained after patients provided written informed consent.
Clinical and hematologic features of patients included in the learning and validation cohorts at the time of biological sampling are reported in Table 1. CMML-MD and CMML-MP were defined according to FAB criteria,3 whereas subclassification into CMML-0, CMML-1, and CMML-2, and evolution into AML were defined according to the 2016 WHO criteria.5 Quantitative enumeration of myeloblasts, monocytes, and their precursors was performed using established consensus criteria.29,30
RBC-transfusion dependency and sex-specific hemoglobin thresholds were defined as previously reported.13,31,32 Cytogenetic risk category was defined according to the Spanish cytogenetic risk stratification,13,14 and CPSS risk was estimated according to Such et al (see supplemental Table 1, available on the Blood Web site).13
Sample collection and cell separation
Mononuclear cells were separated from BM samples by standard density gradient centrifugation, and granulocytes were isolated from peripheral blood, as previously described.33 Peripheral T lymphocytes were purified by immunomagnetic separation (Miltenyi Biotec, Bergisch Gladbach, Germany) according to the manufacturer’s recommendations in 65 patients, and used as control tissue. Genomic DNA was obtained from tumor and control cells by following standard protocols for human tissue.
Mutation analysis
Mutation analysis was performed on DNA from peripheral blood granulocytes or BM mononuclear cells. A TruSeq Custom Amplicon panel (TSCA; Illumina, San Diego, CA) targeting complete coding exons and their adjacent splice junctions from 38 genes was designed using Illumina Design Studio software. The genes included in the panel were selected based on the available evidence in myeloid neoplasms (supplemental Table 2). The TSCA panel consisted of 886 amplicons, 425 bp in length, for a total of 205 kb targeted DNA. Dual-barcoded TSCA libraries were created from 250 ng of high quality DNA according to the manufacturer’s protocol. Libraries were multiplexed and underwent 2 × 250-bp paired-end sequencing on a MiSeq sequencing system using the MiSeq Reagent Kit version 3 (Illumina). Mutational analysis of low performer regions (ie, regions with inadequate coverage, <100 reads) was carried out using Nextera XT Samples Preparation Kit (Illumina), and sequencing reactions were performed using the MiSeq version 2 (2 × 150 bp) chemistry. The resulting average depth of coverage for the 886 amplicons was 739.
Sequence reads were initially aligned to the human genome (GRCh37/hg19) using the Burrows-Wheeler Aligner.34 The Genome Analysis Toolkit was then used to cleanup reads and make alignment data more reliable for the variant calling (Genome Analysis Toolkit data cleanup best practice).35 Single nucleotide variants and small insertions and deletions were identified by UnifiedGenotyper.35 Functionally annotated variants were then filtered based on the information retrieved from public databases (dbSNP, 1000genome, and ESP6500), the expected germ line allele frequency, as previously reported.17 The information obtained from patient-specific control tissue was used to confirm filtering strategy when available. The remaining variants were considered as candidate somatic mutations, and were finally tagged as oncogenic, based on the information derived from the literature and on in silico prediction effect, as previously described.17 Variant allele frequency was calculated as the number of variant reads divided by the total reads.
Statistical analysis
Survival analyses were performed with the Kaplan-Meier method. Multivariable survival analyses were performed by means of Cox proportional hazards regression. The cumulative incidence of progression to AML was estimated with a competing risk approach, considering death for any cause as a competing event, and the effect of quantitative covariates was estimated by Fine-Gray regression model.36 All analyses accounted for left censoring of the observations at the time of mutation assessment. Any observation was censored before starting any disease-modifying therapy. The comparison of models with different types of covariates was carried out using Akaike’s information criterion and Harrell’s C concordance index.
The R2 coefficient was calculated in order to evaluate the goodness of fit of linear regression models. This coefficient is the ratio between the explained variation and the total variation of the model: the better the linear regression fits the data, the closer the value of R2 is to 1. Statistical analyses were performed using Stata 12.1 (StataCorp LP) software.
Results
Mutation spectrum and correlations between genotype and disease phenotype in CMML
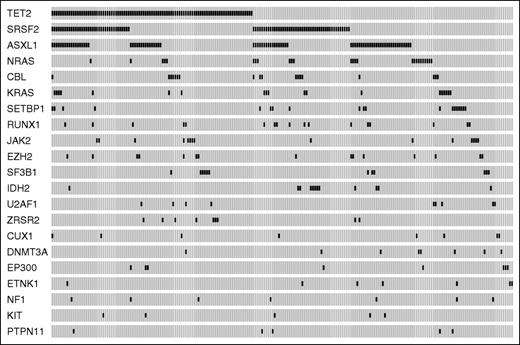
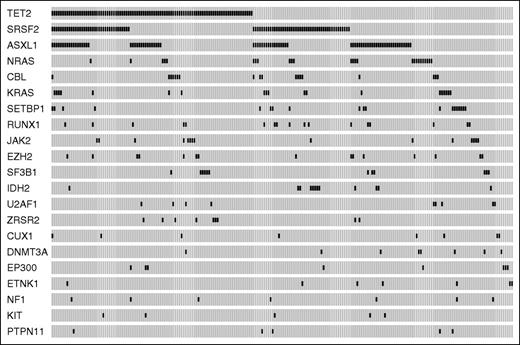
Ninety-three percent of patients (199/214) showed at least 1 somatic mutation (median number per patient = 2, range, 0-7). The most frequently mutated genes were TET2 (44.4% of patients), SRSF2 (38.8%), ASXL1 (37.0%), NRAS (11.7%), KRAS (8.9%), SETBP1 (8.9%), CBL (8.4%), RUNX1 (7.9%), JAK2 (7.0%), EZH2 (7.0%), SF3B1 (5.6%), IDH2 (5.6%), U2AF1 (4.2%), and ZRSR2 (4.2%) (Figure 1). A significant association was found between mutations in TET2 and RNA splicing factors (P = .039), 41 of 214 CMML patients (19%) showing co-occurrence of TET2 and SRSF2 mutations.
Mutation patterns observed in patients with CMML in the learning cohort. The plot represents the distribution of somatic lesions in genes mutated in ≥1% of patients. Each column represents an individual patient sample.
Mutation patterns observed in patients with CMML in the learning cohort. The plot represents the distribution of somatic lesions in genes mutated in ≥1% of patients. Each column represents an individual patient sample.
We analyzed the distribution of somatic mutations according to dysplastic or proliferative subtypes and WHO blast categories, and found that mutations in JAK2, NRAS, and SETBP1 were significantly associated with CMML-MP (P values from .03 to < .001), whereas TET2 and SF3B1 mutations were associated with CMML-MD (P = .007 and P = .03, respectively) (supplemental Table 3; supplemental Figure 1A-B). Conversely, no significant association was found between mutation pattern and WHO category.
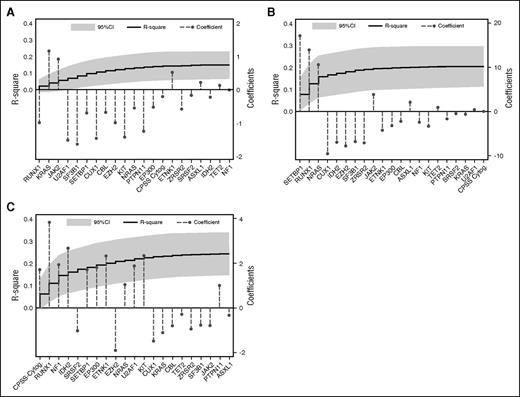
In order to estimate what fraction of the variability of clinical phenotype can be explained by genotype, we applied stepwise linear regression models using the clinical variables of interest (BM blasts, WBC count, and hemoglobin level) as the dependent variables and genetic lesions (point mutations and cytogenetic alterations) as predictors. To this aim, the R2 coefficient, that is, the ratio between the explained variation and the total variation of the model, was calculated. BM blasts were independently predicted by the high CPSS cytogenetic risk group (P = .002) and RUNX1 mutations (P = .004). Mutations in SETBP1 (P < .001), NRAS (P = .01), and RUNX1 (P = .011) were independently associated with WBC count, whereas SF3B1 mutations were the only independent genetic predictor of hemoglobin level (P = .032). Genetic lesions accounted for 0.15, 0.20, and 0.24 of the variability of hemoglobin, WBC count, and BM blasts, respectively (Figure 2A-C). Comparable results were obtained for categorical variables, ie, FAB category (Pseudo R2 0.20) and WHO subtype (Pseudo R2 0.17) (supplemental Figure 2A-B).
Multivariable models to predict hematologic variables from driver mutations. (A) Multivariable model to predict hemoglobin value from driver mutations. The step curve shows the cumulative proportion of variance (y-axis, left) in hemoglobin levels explained by each of the genetic variables. The gray shaded area represents the 95% confidence interval (CI) for this curve. Coefficient estimates for each gene in the model including all variables (y-axis, right) are shown as circles (coefficients >0 indicate positive correlation with hemoglobin levels, ie, the covariate is associated with higher hemoglobin levels; coefficients <0 indicate negative correlation with hemoglobin levels, ie, the covariate is associated with lower hemoglobin levels). (B) Multivariable model to predict WBC from driver mutations, as for (A). (C) Multivariable model to predict BM blast count from driver mutations, as for panels A-B.
Multivariable models to predict hematologic variables from driver mutations. (A) Multivariable model to predict hemoglobin value from driver mutations. The step curve shows the cumulative proportion of variance (y-axis, left) in hemoglobin levels explained by each of the genetic variables. The gray shaded area represents the 95% confidence interval (CI) for this curve. Coefficient estimates for each gene in the model including all variables (y-axis, right) are shown as circles (coefficients >0 indicate positive correlation with hemoglobin levels, ie, the covariate is associated with higher hemoglobin levels; coefficients <0 indicate negative correlation with hemoglobin levels, ie, the covariate is associated with lower hemoglobin levels). (B) Multivariable model to predict WBC from driver mutations, as for (A). (C) Multivariable model to predict BM blast count from driver mutations, as for panels A-B.
Prognostic value of genetic lesions in CMML
The number of mutations per patient inversely correlated with overall survival (OS) (hazard ratio [HR] = 1.23, P = .001) (supplemental Figure 3). In univariable analysis, ASXL1 nonsense/frameshift mutations (HR = 1.74, P = .013), and mutations in EZH2 (HR = 2.07, P = .023), NRAS (HR = 2.44, P = .001), RUNX1 (HR = 3.24, P < .001), and SETBP1 (HR = 2.49, P = .002) significantly affected OS (supplemental Table 4). No significant effect of variant allele frequency on the prognostic value of mutated genes was noticed (P values ranging from .75 to .16).
In order to investigate the additive value of somatic mutations, we first performed multivariable Cox regression including genetic variables. The variables that retained independent prognostic value on OS were CPSS cytogenetic risk groups (HR = 1.54, P = .001), and mutations in RUNX1 (HR = 2.32, P = .016), NRAS (HR = 2.19, P = .009), SETBP1 (HR = 2.00, P = .04), and ASXL1 (HR = 1.77, P = .022) (supplemental Figure 4A-D). Based on regression coefficients, we defined a CMML-specific genetic score that was able to identify 4 groups with significantly different OS and cumulative incidence of AML evolution (HR = 1.87 and HR = 2.62 respectively, P < .001) (Table 2; supplemental Figure 5A-B). The Akaike information criterion (AIC) showed that this genetic score performed better than the original CPSS cytogenetic risk classification (AIC 664 vs 684, and 137 vs 151 for OS and cumulative incidence of AML evolution, respectively). According to the genetic score, 41% of patients had a shift toward a higher risk category compared with the cytogenetic classification.
Identification of hematologic prognostic variables and selection of cutoff values
Based on the observation that genetic parameters could not completely explain phenotypic variability, we then performed univariable and multivariable regression analyses including new genetic risk categories, clinical, and hematologic variables. In univariable analysis, the following phenotypic variables significantly influenced OS: hemoglobin value (HR = 0.8, P < .001), RBC transfusion dependency (HR = 2.8, P < .001), WBC count (HR = 1.02, P < .001), and BM blasts (HR = 1.11, P < .001). We also tested the value of sex-specific hemoglobin thresholds (ie, hemoglobin levels <9 g/dL in males and <8 g/dL in females) as an indicator of RBC transfusion dependency, as previously demonstrated in myelodysplastic syndromes (MDS).32 A high concordance was observed between sex-specific hemoglobin thresholds and RBC transfusion dependency (κ coefficient of concordance = .94, P < .001), and a comparable effect of the 2 parameters was found in univariable analysis (sex-specific hemoglobin thresholds: HR = 2.6, P < .001).
In order to identify the optimal cutoff values for the continuous variable to be integrated in the prognostic model, we calculated AIC of discrete values of BM blasts and WBC. The threshold of BM blast that was associated with the lowest AIC value was 7% (supplemental Figure 6A). Based on this observation and in order to have an easily clinically applicable discrete value, we adopted a threshold of 5% BM blasts (HR = 2.18, P < .001). The value of WBC count associated with the lowest AIC was 11 × 109/L (supplemental Figure 6B). However, after pondering the trade-off between goodness of fit, expected impact on the model (10 out of 214 patients or 4.7%, had a WBC count between 11 and 13 × 109/L), as well as the unaccountable analytical sources of variance in WBC count, we decided to maintain the threshold of 13 × 109/L (HR = 2.46, P < .001).
Development of a clinical/molecular prognostic scoring system in CMML
In multivariable analysis, the following variables retained independent prognostic value: genetic risk groups (HR = 1.7, P < .001), RBC transfusion dependency (HR = 2.5, P < .001), WBC count (HR = 2.3, P = .001), and BM blasts (less than or equal to or >5%) (HR = 1.6, P = .04) (supplemental Table 5). Comparable results were obtained when sex-specific hemoglobin thresholds were used instead of RBC transfusion dependency in multivariable analysis (sex-specific hemoglobin thresholds, HR = 2.6, P < .001; genetic risk groups, HR = 1.7, P < .001; WBC count, HR = 2.1, P = .002; and BM blasts, HR = 1.6, P = .038).
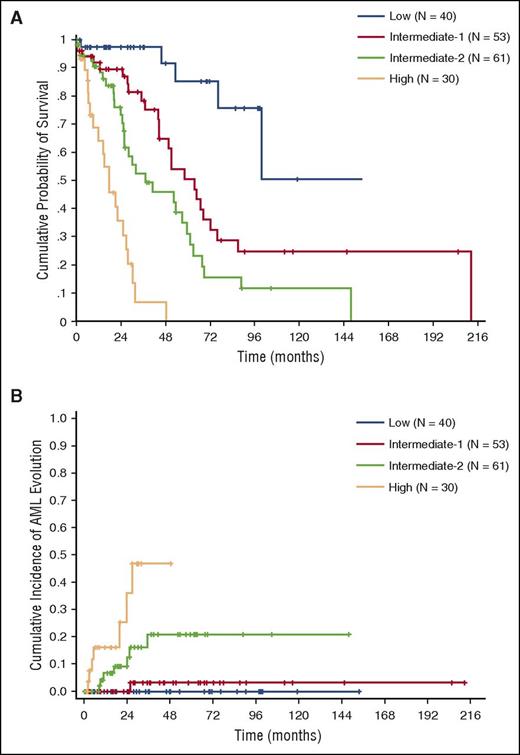
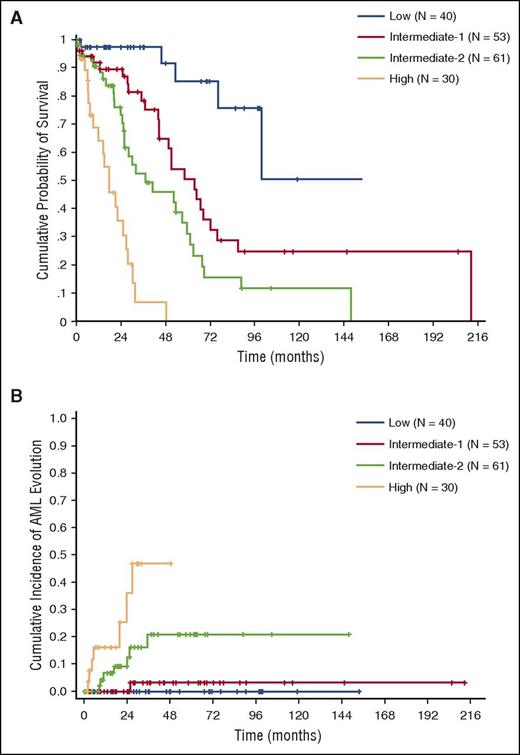
Based on regression coefficients, we developed a clinical/molecular CPSS (CPSS-Mol), and the following scores were assigned to each variable: 1 point to intermediate-1 genetic score risk category, WBC ≥13 × 109/L, BM blasts ≥5%, and RBC transfusion dependency; 2 points to intermediate-2 genetic score; and 3 points to high genetic score (Table 3). This model was able to identify 4 risk groups with significantly different OS (HR = 2.69, P < .001) and cumulative incidence of leukemic evolution (HR = 3.84, P < .001) (median survival not reached, 64, 37, and 18 months; 48-month cumulative incidence of AML evolution of 0%, 3%, 21%, and 48% for the low, intermediate-1, intermediate-2, and high-risk group, respectively) (Figure 3A-B; supplemental Table 6).
OS and cumulative incidence of leukemic evolution according to the CPSS-Mol in the learning cohort. (A) OS and (B) cumulative incidence of evolution into AML of patients classified into CPSS-Mol risk groups. The number of patients (N) in each category is reported: low risk group accounted for 22% of patients, intermediate-1 for 29%, and intermediate-2 and high-risk groups for 33% and 16% of patients, respectively.
OS and cumulative incidence of leukemic evolution according to the CPSS-Mol in the learning cohort. (A) OS and (B) cumulative incidence of evolution into AML of patients classified into CPSS-Mol risk groups. The number of patients (N) in each category is reported: low risk group accounted for 22% of patients, intermediate-1 for 29%, and intermediate-2 and high-risk groups for 33% and 16% of patients, respectively.
We also calculated the scoring system using sex-specific hemoglobin thresholds instead of RBC transfusion dependency (κ coefficient of concordance = .95, P < .001), and comparable probability of OS and cumulative incidence of leukemic evolution were found (median survival of 100, 58, 37, and 18 months; 48-month cumulative incidence of AML evolution 0%, 9%, 16%, and 51% for the low, intermediate-1, intermediate-2, and high-risk group, respectively).
The AIC showed that the CPSS-Mol performed better than the original CPSS (AIC 630 vs 659, and 127 vs 145 for OS and cumulative incidence of AML evolution, respectively). According to CPSS-Mol, 48% of patients shifted to a higher risk group compared with the original CPSS.
Validation of the CPSS-Mol and comparison with previously defined prognostic scoring systems
Then, the prognostic value of the CPSS-Mol was tested in an independent validation cohort consisting of 260 CMML patients. When comparing clinical and hematologic features of the learning and validation cohorts, a significant difference was found in the frequency of WHO categories, with CMML-2 being more frequent in the validation cohort (38/214 vs 74/260 in the learning and validation cohort, respectively, P = .007), and accordingly of CPSS categories (P = .012). No significant difference was noticed between learning and validation cohorts in the prevalence of ASXL1 (37% vs 40%, P = ns), NRAS (11.7% vs 13.4%, P = ns), and SETBP1 mutations (8.9% vs 9.2%, P = ns), whereas a significantly higher prevalence of RUNX1 mutations was observed in the validation cohort (20.7% vs 7.9%, P < .001).
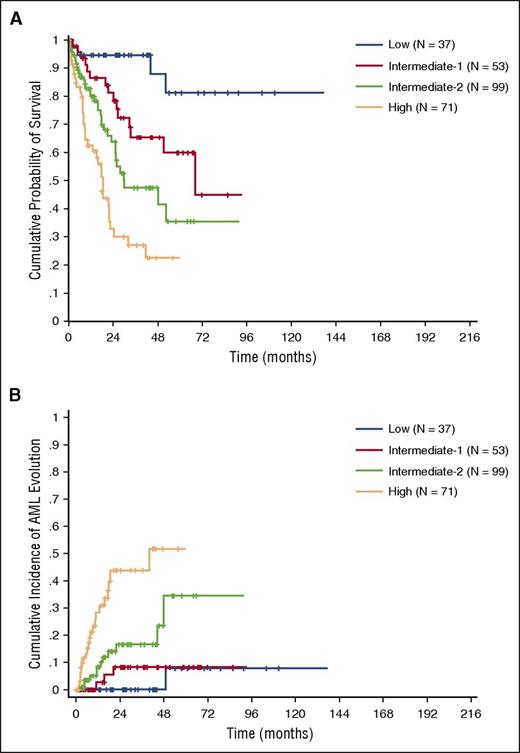
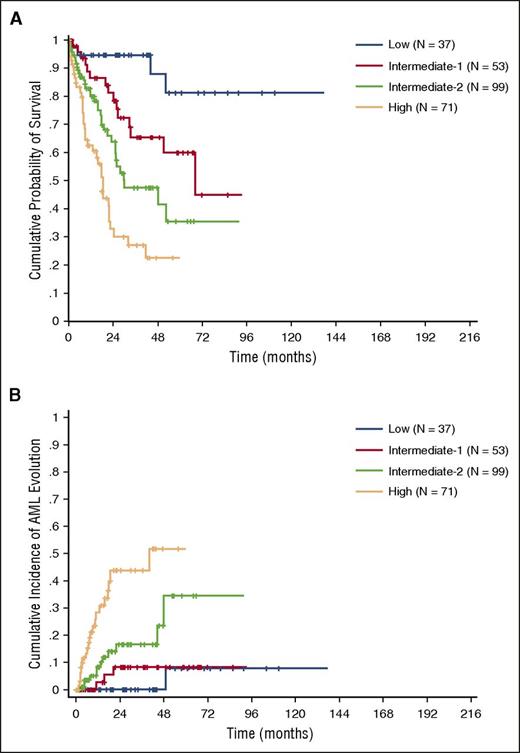
Because the information of RBC transfusion-dependency was incomplete in the validation cohort, we adopted sex-specific hemoglobin thresholds to calculate the CPSS-Mol. The CPSS-Mol was able to identify 4 risk groups having a significantly different OS, with median survival time not reached, and 68, 30, and 17 months in the low, intermediate-1, intermediate-2, and high-risk group, respectively (P < .001). The 4 risk groups also showed a significantly different cumulative incidence of leukemic evolution, with a 48-month cumulative incidence of AML evolution of 0%, 8%, 24%, and 52% for the low, intermediate-1, intermediate-2, and high-risk group, respectively (P < .001) (Figure 4A-B; supplemental Table 6).
OS and cumulative incidence of leukemic evolution according to the CPSS-Mol in the validation cohort. (A) OS and (B) cumulative incidence of evolution into AML of patients classified into CPSS-Mol risk groups. The number of patients (N) in each category is reported: low risk group accounted for 14% of patients, intermediate-1 for 20%, and intermediate-2 and high-risk groups for 38% and 27% of patients, respectively.
OS and cumulative incidence of leukemic evolution according to the CPSS-Mol in the validation cohort. (A) OS and (B) cumulative incidence of evolution into AML of patients classified into CPSS-Mol risk groups. The number of patients (N) in each category is reported: low risk group accounted for 14% of patients, intermediate-1 for 20%, and intermediate-2 and high-risk groups for 38% and 27% of patients, respectively.
No significant difference was noticed in OS and cumulative incidence of AML evolution of CPSS-Mol risk groups between the learning and validation cohort, either when the CPSS-Mol was calculated in the learning cohort using RBC transfusion-dependency (P values ranging from .13 to .77, and from .22 to .99 for OS and cumulative incidence of AML evolution, respectively) or sex-specific hemoglobin thresholds (P values ranging from .37 to .78, and from .22 to .89 for OS and cumulative incidence of AML evolution, respectively).
We then calculated previously defined prognostic scoring systems including mutation status, according to Itzykson et al20 and Patnaik et al,26 and compared them with the CPSS-Mol in the learning cohort. The Groupe Francophone des Myelodysplasies (GFM) scoring system was based on the combination of age, hemoglobin, WBC and platelet values, and ASXL1 mutation,20 and was able to identify 3 risk groups with significantly different OS (HR = 2.16, P < .001) (median survival 64, 37, and 15 months, in the low, intermediate, and high-risk group, respectively) (supplemental Figure 7A). The Mayo Molecular model (MMM) was based on the combination of hemoglobin, absolute monocyte, circulating immature myeloid cells and platelet values, and ASXL1 mutation,26 and identified 4 risk groups with a median survival of 68, 50, 51, and 12 months, respectively (HR = 1.61, P < .001) (supplemental Figure 7B). The AIC and the Harrell’s C concordance index showed that the CPSS-Mol performed better than either the GFM or the MMM (AIC: 630 vs 880 and 832; C-index: 0.73 vs 0.62 and 0.66 for the GFM and the MMM, respectively).
Discussion
In this study, we performed a comprehensive screening of somatic mutation on a large cohort of well-annotated patients with CMML to identify mutation patterns that may affect disease phenotype and clinical outcome. We observed significant correlations between genotype and disease phenotype. However, regression models showed that driver mutations are able to explain a limited fraction of the total variation of the most relevant clinical variables. Then, we refined cutoff values of the clinical parameters with significant prognostic value, and developed a clinical/molecular prognostic scoring system that was able to identify 4 risk groups with significantly different survival and risk of leukemic progression. The prognostic value of the scoring system was confirmed in an independent validation cohort.
CMML is characterized by an extremely heterogeneous disease phenotype, ranging from entities with predominant myelodysplastic features to forms with prevailing myeloproliferation.37 Previous studies reported associations between somatic mutations and disease phenotype.20,24,38 We recognized mutation patterns significantly associated with dysplastic or proliferative features, suggesting that these 2 disease subtypes may have at least partly different genetic background. However, we also found that recurrent somatic mutations were able to explain only a fraction of the total variation of the most relevant clinical variables, including hemoglobin, WBC count, and BM blasts. These data suggest that as-yet-unknown mutations or additional factors, including genetic background, clonal hierarchy, or distinct hematopoietic stem/progenitor cells primarily involved by mutation, may account for this unexplained tumor heterogeneity. These results also suggest that, at the current stage, the integration of genetic and clinical variables is expected to provide the maximal information for clinical decision-making.
Several prognostic factors have been identified in CMML and combined into scoring systems, including clinical and hematologic variables.8-11 Recently, we developed a CPSS,13 based on a comprehensive assessment of the prognostic value of cytogenetic abnormalities.14 Although the integration of cytogenetic abnormalities resulted in a better risk stratification, only a minority of CMML patients carry recurrent karyotypic abnormalities. Several genes were reported to have prognostic value in CMML.20,22,26,28,38,39 In 2 recent studies, the integration of ASXL1 mutation status with clinical parameters allowed to develop prognostic scoring systems that appeared to be more discriminative than those based solely on clinical parameters.20,26
We first explored the prognostic impact of genetic lesions, and confirmed the prognostic value of ASXL1 mutations. In addition, we also found that somatic mutations in RUNX1, NRAS, and SETBP1, previously reported to have a prognostic value in MDS or MDS/MPN,28,40,41 had an additive independent prognostic value to CPSS cytogenetic risk groups. Based on multivariable regression coefficients, we defined a genetic score that was able to identify 4 risk groups, and was shown to perform better than the original CPSS cytogenetic risk classification. It must be acknowledged that our sample size did not allow to assess possible interactions between co-occurring mutations, which may potentially influence the resulting compounded prognostic effect.
We then investigated which clinical parameters were of additive value to this genetic classifier, and found that RBC transfusion-dependency, and WBC and BM blast counts retained an independent prognostic value. We also tested the value of sex-specific hemoglobin thresholds as an indicator of RBC transfusion-dependency, as previously defined in MDS,32 and obtained highly concordant results. Recent reports suggested that a threshold of 5% BM blasts was associated with a higher prognostic discrimination than the value of 10% introduced by the 2001 WHO classification.42,43 In order to identify the optimal cutoff value for continuous variable to be integrated in the prognostic model, we calculated the AIC of discrete values of BM blasts and WBC. We found that the value of 7% BM blasts was associated with highest goodness of fit. Therefore, consistent with the above-mentioned recent findings,42,43 we adopted a cutoff of 5% BM blasts. The WBC values associated with the best goodness of fit were between 11 and 12 × 109/L. However, it must be acknowledged that the identification of a clear WBC count value may be affected by several factors, including unaccountable analytical variation resulting in different upper normal values across laboratories.44 In addition, a change in WBC threshold from 13 to 11 × 109/L would affect risk assessment of <5% of patients included in this study. Therefore, although the criterion of 13 × 109/L introduced by the FAB classification and confirmed by the recently updated WHO classification was associated with a slightly higher AIC value, in the development of the prognostic model we decided to maintain this definition, and devote to larger international initiatives the identification of the most appropriate WBC cutoff.
Based on the coefficients of the multivariable regression model, we defined a CPSS-Mol, which integrated the genetic score with RBC transfusion requirement, WBC and BM blast counts, and was able to identify 4 risk groups with significantly different survival and risk of leukemic evolution. As previously observed for the original CPSS, comparable results were obtained when the scoring system was calculated using hemoglobin thresholds instead of RBC transfusion dependency.13 This alternative model could be useful, especially in those patients who deserve urgent therapy and in whom RBC transfusion dependency is still not established.
The prognostic value of the CPSS-Mol was then tested in an independent cohort of patients with CMML. Because the information of RBC transfusion dependency was incomplete in the validation cohort, we adopted sex-specific hemoglobin thresholds. Although this validation cohort differed from the learning cohort in terms of morphologic subtypes and mutation pattern, no significant difference was noticed in OS and risk of AML evolution of CPSS-Mol risk groups between the learning and validation cohorts.
This prognostic score may be potentially useful for clinical decision-making in CMML. First, the CPSS-Mol was able to identify 2 categories with no or very low risk of disease progression, whose outcome was mainly affected by nonleukemic death related to BM failure. In addition, according to the CPSS-Mol, about half of patients had an estimate of their individual risk higher than that obtained with the original CPSS, and about one-third of patients with low or intermediate-1 CPSS risk were classified as intermediate-2 or high risk according to CPSS-Mol. In particular, CPSS-Mol was able to capture about 40% of patients with CMML-0 or -1 and a similar proportion of cases with normal karyotype as having an intermediate-2 or high risk based on their mutation profile. In addition, the CPSS-Mol performed better than previously defined ASXL1 mutation-inclusive prognostic models,20,26 albeit it must be acknowledged that a comparison of goodness of fit within the data set on which the new model was developed is intrinsically biased.
In conclusion, although current understanding of the pathophysiology of CMML does not allow to move toward an entirely molecular-based classification and risk assessment, the results of this study suggest that the integration of somatic mutations significantly improve prognostic stratification of patients with this neoplasm, and may provide a basis for improving clinical decision making.
The online version of this article contains a data supplement.
The publication costs of this article were defrayed in part by page charge payment. Therefore, and solely to indicate this fact, this article is hereby marked “advertisement” in accordance with 18 USC section 1734.
Acknowledgments
This study was supported by grants from the Associazione Italiana per la Ricerca sul Cancro, Fondo per gli investimenti della ricerca di base (project no. RBAP11CZLK), and Ministero dell’Istruzione, dell’Università e della Ricerca (PRIN 2010-2011) (M.C.); the Associazione Italiana per la Ricerca sul Cancro (IG 15356) (L.M.); the Instituto de Salud Carlos III (grants PI12/01047, PIE13/00046, PT13/0010/0026 [Biobanco La Fe], and PI14/01649, and the “Consellería de Educación, Cultura y Deporte” of the Valencian Community (PROMETEOII/2015/008) (G.F.S.).
Authorship
Contribution: C.E., L.M., and M.C. designed the study, performed statistical analysis, and wrote the manuscript; A.G., M.M., E.R., E.M., A.F., S.Z., and S.C. analyzed sequencing data and performed bioinformatic analysis; E.S., U.G., J.C., E.S., I.A., M.L.-P., A.K., E.T., R.S.-T., A.I.V., G.F.S., T.H., and C.H. collected clinical data.
Conflict-of-interest disclosure: The authors declare no competing financial interests.
Correspondence: Luca Malcovati, Department of Hematology Oncology, Fondazione IRCCS Policlinico San Matteo, Viale Golgi 19, 27100 Pavia, Italy; e-mail: luca.malcovati@unipv.it; and Mario Cazzola, Department of Hematology Oncology, Fondazione IRCCS Policlinico San Matteo, Viale Golgi 19, 27100 Pavia, Italy; e-mail: mario.cazzola@unipv.it.
References
Author notes
L.M. and M.C. contributed equally to this study.

