Programmed cell death protein 1 (PD-1) blockade targeting the PD-1 immune checkpoint has demonstrated unprecedented clinical efficacy in the treatment of advanced cancers including hematologic malignancies. This article reviews the landscape of PD-1/programmed death-ligand 1 (PD-L1) expression and current PD-1 blockade immunotherapy trials in B-cell lymphomas. Most notably, in relapsed/refractory classical Hodgkin lymphoma, which frequently has increased PD-1+ tumor-infiltrating T cells, 9p24.1 genetic alteration, and high PD-L1 expression, anti-PD-1 monotherapy has demonstrated remarkable objective response rates (ORRs) of 65% to 87% and durable disease control in phase 1/2 clinical trials. The median duration of response was 16 months in a phase 2 trial. PD-1 blockade has also shown promise in a phase 1 trial of nivolumab in relapsed/refractory B-cell non-Hodgkin lymphomas, including follicular lymphoma, which often displays abundant PD-1 expression on intratumoral T cells, and diffuse large B-cell lymphoma, which variably expresses PD-1 and PD-L1. In primary mediastinal large B-cell lymphoma, which frequently has 9p24.1 alterations, the ORR was 35% in a phase 2 trial of pembrolizumab. In contrast, the ORR with pembrolizumab was 0% in relapsed chronic lymphocytic leukemia (CLL) and 44% in CLL with Richter transformation in a phase 2 trial. T cells from CLL patients have elevated PD-1 expression; CLL PD-1+ T cells can exhibit a pseudo-exhaustion or a replicative senescence phenotype. PD-1 expression was also found in marginal zone lymphoma but not in mantle cell lymphoma, although currently anti-PD-1 clinical trial data are not available. Mechanisms and predictive biomarkers for PD-1 blockade immunotherapy, treatment-related adverse events, hyperprogression, and combination therapies are discussed in the context of B-cell lymphomas.
Introduction
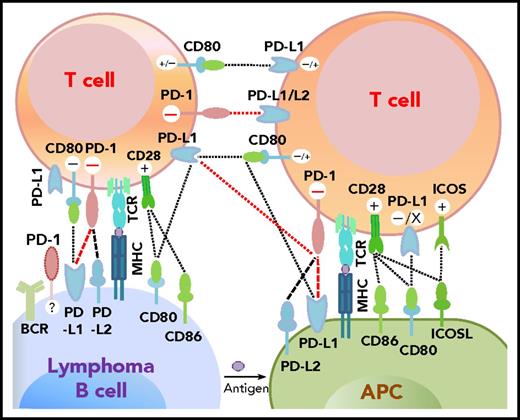
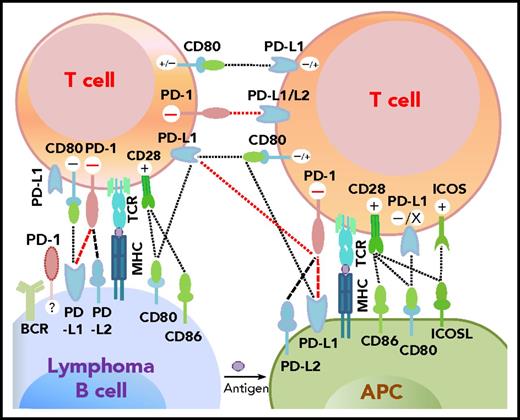
Programmed cell death protein 1 (PD-1),1 predominantly expressed on activated T cells, is an important immune checkpoint receptor. PD-1 transmits inhibitory signals into T cells after ligation with PD-1 ligands (PD-Ls), PD-L12,3 or PD-L2,4 on neoplastic cells and in the tumor microenvironment. In addition to binding to PD-1, PD-L1 can bind to CD80/B7-15,6 and PD-L2 can bind to RGMb,7 promoting tolerance. However, PD-L1 function through T-T interaction can be context-dependent,8,,-11 and other costimulatory receptors for PD-L1/PD-L2 may exist.12,,-15 The interactions between PD-1 and PD-L expression on T cells, lymphoma cells, and antigen-presenting cells as described in the literature are summarized in Figure 1.2,4,-6,9,16,,-19
Potential interaction involving PD-1/PD-L1 between receptors and ligands on lymphoma cells, professional antigen-presenting cells (APCs), and T cells. PD-1–PD-L1 interactions are highlighted in red. Functional consequences of the interaction are denoted by “+” (stimulatory) and “–” (inhibitory) signs. The “+/–“ signs indicate context-dependent effects of PD-L1–CD80 interaction on T cells. For PD-1 expression on malignant B cells in some non-Hodgkin B-cell lymphomas, PD-1 ligands and functions are currently unclear (indicated by “?”). TCR, T-cell receptor.
Potential interaction involving PD-1/PD-L1 between receptors and ligands on lymphoma cells, professional antigen-presenting cells (APCs), and T cells. PD-1–PD-L1 interactions are highlighted in red. Functional consequences of the interaction are denoted by “+” (stimulatory) and “–” (inhibitory) signs. The “+/–“ signs indicate context-dependent effects of PD-L1–CD80 interaction on T cells. For PD-1 expression on malignant B cells in some non-Hodgkin B-cell lymphomas, PD-1 ligands and functions are currently unclear (indicated by “?”). TCR, T-cell receptor.
In recent years, we have witnessed the great success of immunotherapies with PD-1 or PD-L1 blockade in many types of cancers, supporting the essential role of PD-1 and PD-L1 in immune suppression. PD-L1 expression, but not PD-1 expression, has been associated with clinical response to PD-1 blockade in many clinical trials. The highest response rate to PD-1 blockade was achieved in classical Hodgkin lymphoma (cHL),20,,-23 which does not have a high mutational burden compared with other cancers24 but has a higher frequency of PDL1/PDL2/JAK2 genetic alterations in Reed-Sternberg cells25 derived from germinal-center B cells.26,27 PD-1 blockade has also shown clinical activity in several types of B-cell non-Hodgkin lymphoma (B-NHL) with variable PD-L1 expression. However, the reasons for differential efficacy in lymphoma patients are not well understood. Because PD-1–blocking antibodies bind only to PD-1+ cells and not to PD-1– cells,28 PD-1 expression and its clinical role in lymphoma need to be better understood. This review provides a summary of current studies on PD-1/PD-L1 expression and PD-1 blockade in B-cell lymphomas.
PD-1 expression and clinical roles in B-cell lymphomas
Unlike solid tumors, B-cell lymphoma cells express major histocompatibility complex (MHC) class II and costimulatory CD80/CD86 molecules that are functionally active,29 allowing these lymphoma cells to act as antigen-presenting cells by themselves (Figure 1).29,,,,,-35 However, high rates of decreased or absent expression of β2M/MHC class I (79% to 83.2%) and MHC class II (46.8% to 67%) have been observed in cHL.36,37 Decreased MHC expression occurs less frequently in NHL.38,39 However, 41% to 61% of patients with diffuse large B-cell lymphoma (DLBCL), the most common aggressive B-NHL, have loss or aberrant expression of MHC class I37,39,40 associated with B2M mutations and deletions (frequency, 29%).40 Eighty percent of patients with primary testicular lymphoma (PTL) and 50% of patients with primary central nervous system lymphoma (PCNSL) have lost both class I and class II MHC expression.37 Moreover, PD-1 expression is frequently increased on tumor-infiltrating T cells in B-cell lymphomas.
The clinical role of PD-1 expression is most notable in Hodgkin lymphoma (HL). One study showed that PD-1 levels were markedly elevated in tumor-infiltrating T cells (53% to 76%) in three patients with HL compared with healthy volunteers41 ; PD-1 expression in peripheral blood was also significantly higher in patients with HL (nodular sclerosis, n = 5; mixed cellularity, n = 5) than in patients with B-NHL.41 In a study of 189 patients with cHL, the median amount of PD-1+ tumor-infiltrating lymphocytes (TILs) was 27 cells per mm2, and the mean was 269 cells per mm2.42 Lymphocyte-rich cHL had the highest PD-1 expression (median, 203 cells per mm2; mean, 1044 cells per mm2), whereas nodular sclerosis cHL had the lowest (median, 16 cells per mm2; mean, 275 cells per mm2). PD-1 rimming around tumor cells was observed only in a small subset of cHL (lymphocyte-rich cHL and mixed cellularity cHL),42 in contrast with the characteristic PD-1+ rosettes in nodular lymphocyte–predominant HL.42,-44 However, in another cHL study (nodular sclerosis, n = 93; mixed cellularity, n = 25; lymphocyte-depleted, n = 2), intratumoral PD-1 expression was undetectable in 42% of patients and present at low levels in another 42% of patients.45 Despite the difference in the prevalence of PD-1 expression in these studies, increased PD-1+ TILs were consistently associated with poor prognosis (overall survival [OS]42 and disease-specific survival45 ) in cHL patients treated with conventional therapies (Table 1).
PD-1 is also abundantly expressed in follicular lymphoma (FL) but with complicated expression patterns. T cells that infiltrate FL tumors, which are skewed toward the CD4+CD45RO+ population, have higher PD-1 expression (mean amount, 287 cells per mm2 in grade 1-2 FL46 ; mean proportion, 6.21% to 21.8% of all cells46,47 ; mean level, ∼70% to 82% of CD4+ T cells) than peripheral T cells.48 PD-1+ T cells are more frequently observed in intrafollicular or perifollicular regions and less frequently observed in interfollicular regions.47,49,-51 A study identified 2 different subpopulations of intratumoral PD-1+ T cells in FL biopsy specimens: those residing in the lymph node follicles with bright PD-1+ intensity (PD-1high) and those residing in interfollicular regions with dim PD-1+ intensity (PD-1low). The former had a follicular helper T cell (TFH) phenotype (CXCR-5+BCL-6+CD4+, secreting interleukin-21 [IL-21] and supporting B-cell growth in vitro), whereas the latter had exhausted phenotypes (TIM-3+2B4+OX40−)50 and function (reduced cytokine production and phosphorylation of STAT1/3/4 in response to cytokine stimulation).52 However, another study showed that FL-infiltrating PD-1high CD4+ T cells included TFH and CXCR5–ICOS+ non-TFH cells, and both cell types were unresponsive to cytokines (Table 2).48 In line with these complex PD-1 expression patterns and T-cell functions, the prognostic impact of PD-1 expression in FL is inconsistent in the literature (Table 1).46,47,49,,,,,-55
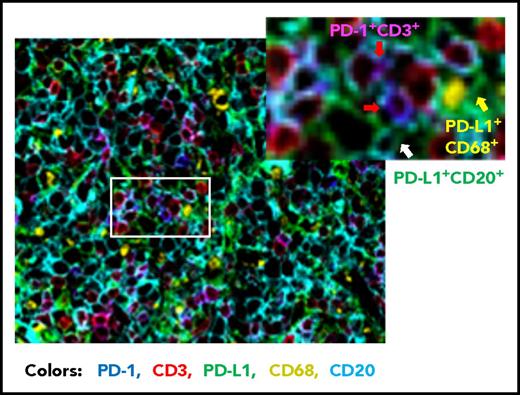
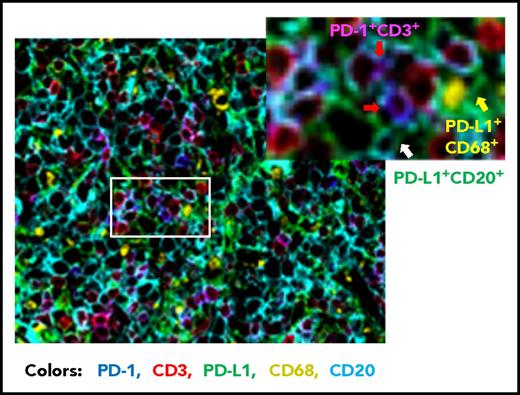
Compared with FL, the prevalence of PD-1+ expression is lower in DLBCL (39.5% to 68.6%).56,,-59 Studies of PD-1 expression in DLBCL are more recent than those in HL and FL. Our group has analyzed PD-1 expression in a large cohort of patients with DLBCL by using state-of-the-art fluorescent multiplex immunohistochemistry techniques (unpublished data); Figure 2 shows the spatial expression of PD-1 on T cells and PD-L1 on lymphoma cells and antigen-presenting cells in a DLBCL sample. Several studies have quantified the number of PD-1+ TILs in DLBCL samples. Muenst et al46 found mean values of 27 PD-1+ cells per mm2 and 1.1% of all cells in 184 DLBCL samples. Kiyasu et al57 observed a range of 0 to 1288 PD-1+ cells per mm2 in 236 patients with DLBCL, and the number was lower in activated B-cell–like (ABC) DLBCL and DLBCL with PD-L1high expression (membranous and/or cytoplasmic staining in ≥30% of lymphoma cells). However, in other studies, PD-1+ cell numbers were positively associated with PD-L1 expression (but not with the ABC subtype58,60 ). The amount of PD-1+ TILs positively correlated with PD-L1 expression in tumor cells and/or macrophages in a study of 126 DLBCL patients58 and in ABC-DLBCL in a study of 253 DLBCL patients,61 as well as in histiocytes (but not PD-L1 on tumor cells) in a study of 20 de novo and 11 transformed (from FL) DLBCL patients (Table 2).62 The presence of or a high amount of PD-1+ TILs in DLBCL samples has been associated with favorable, unfavorable, or no prognostic effect in different studies (Table 1)56,,-59,63 ; increased PD-1 levels (percentage expression) in the peripheral blood of DLBCL patients have been associated with poorer prognosis.64,65
Representative overlaid image of PD-1 and PD-L1 expression in a de novo DLBCL sample by fluorescent multiplex immunohistochemistry. Fluorescent colors show the following: blue for PD-1+, green for PD-L1+, red for CD3+, yellow for CD68+, and cyan for CD20+. Examples of PD-1+ T cells are indicated by the red arrows (co-localization of PD-1+ and CD3+ signals are shown in magenta), a PD-L1+ CD68+ cell (macrophage/dendritic cell) is indicated by the yellow arrow, and a PD-L1+ lymphoma cell (CD20+) is indicated by the white arrow. Original magnification ×20.
Representative overlaid image of PD-1 and PD-L1 expression in a de novo DLBCL sample by fluorescent multiplex immunohistochemistry. Fluorescent colors show the following: blue for PD-1+, green for PD-L1+, red for CD3+, yellow for CD68+, and cyan for CD20+. Examples of PD-1+ T cells are indicated by the red arrows (co-localization of PD-1+ and CD3+ signals are shown in magenta), a PD-L1+ CD68+ cell (macrophage/dendritic cell) is indicated by the yellow arrow, and a PD-L1+ lymphoma cell (CD20+) is indicated by the white arrow. Original magnification ×20.
In contrast to FL and DLBCL, chronic lymphocytic leukemia (CLL) and small lymphocytic lymphoma (SLL) tissues have low numbers of PD-1+ TILs (mean, 13 cells per mm2)46 ; however, the mean expression intensity of PD-1 was higher in CLL/SLL than in reactive lymph node samples.53 Circulating T cells from CLL patients have been shown to have elevated PD-1 expression levels compared with those from healthy donors (mean, ∼45% of CD4+ T cells and ∼30% of CD8+ T cells, respectively),66,,-69 especially effector (CCR7–CD45RA–) memory CD8+ T cells in cytomegalovirus (CMV)-seronegative patients with early-stage CLL.67 CD8+ T cells from these patients had reduced proliferation capacity and cytotoxicity activity but increased cytokine production (pseudo-exhaustion).67 However, in CMV-seropositive CLL patients, the expanded CMV-specific CD8+ T cells had decreased PD-1 levels and were functionally intact compared with T cells from healthy controls70,71 ; PD-1 levels inversely correlated with the absolute number of effector T cells and malignant B cells.71 In contrast, another study of patients with early-stage CLL found that CMV-serostatus was not associated with PD-1 levels on CD8+ T cells but inverted CD4:CD8 ratios were. Inverted CD4:CD8 ratios were also associated with reduced progression-free survival (PFS), preferential expansion of CD8+ T cells skewed toward terminally differentiated effector CD8+ T cells (CD8+CCR7–CD45RO–), and a T-cell replicative senescence phenotype (CD57+CD28–CD27–).69 These disparate data may suggest that PD-1 expression on T cells has a context-dependent role in CLL. PD-1 expression seemed to have limited prognostic significance in CLL/SLL.46,53
Studies in other types of B-cell lymphomas found numerous PD-1+ T cells in marginal zone lymphoma (MZL) but almost no PD-1+ cells in mantle cell lymphoma (MCL).46,72,73
Furthermore, in addition to the PD-1 expression in reactive T cells, weak PD-1 expression on neoplastic B cells was also reported in 92% of patients with CLL/SLL and 7% to 22% of patients with DLBCL or high-grade FL.60,74 PD-1 was also weakly expressed on circulating CLL cells (levels, ∼47%) in 91% of patients and increased after CD40/CD40L/IL-4 stimulation in vitro.74,75 However, other studies using different PD-1 antibodies showed that PD-1 was expressed only in rare cases of CLL/SLL, DLBCL, and extranodal MZL.43,46,73 One recent small-scale study using dual-color immunofluorescent staining for PD-1 and CD3 showed that PD-1 was mainly expressed on tumor B cells in CLL-involved tissues,76 in contrast with the CD2+/CD4+ T-cell predominance of PD-1 expression in CLL tissues shown in a previous study.66 Although in vitro studies have shown that PD-1 inhibits B-cell receptor signaling77 and B-cell activation,78 it seemed that the PD-1 expression on CLL cells did not affect B-cell receptor signaling significantly and was not associated with prognosis,68,75 although it may modulate ZAP-70 function.68
Together, these data suggest that PD-1 expression and clinical roles vary across and within B-cell lymphoma entities. However, differences may also result from methodologic (eg, assessed by PD-1+ cell numbers, percentage expression, or staining intensities; by numbers of PD-1+ TILs or numbers of PD-1+ T cells; by percentage of all cells or T cells; by tissue expression or peripheral expression; or by immunohistochemistry or flow cytometry) and technical (use of different antibodies and positivity cutoffs) disparities among studies,79 illustrating the challenge in assessing the dynamic tumor microenvironment and T-cell responses. Similar issues may exist in clinical studies of PD-1 expression as a biomarker for PD-1 blockade therapy.
PD-L1 expression and clinical roles in B-cell lymphomas
A functional study demonstrated that only after PD-1 ligation can PD-1 block T-cell activation.80 Therefore, we briefly reviewed the expression and clinical significance of PD-L1, the primary PD-1 ligand, on malignant B cells and in the tumor microenvironment in B-cell lymphoma entities. PD-L2 has lower expression except in HL and primary mediastinal large B-cell lymphoma (PMBCL).21,81,82
Most patients with cHL have strong tumor PD-L1/PD-L2 expression (rate, 70% to 87% in those receiving conventional treatment61,83 and 94% to 100% in patients with relapsed or refractory [R/R] cHL in anti-PD-1 clinical trials21,23 ) because of high frequencies of 9p24.1 (locus harboring PDL1/PDL2/JAK2) copy number alterations (97% by fluorescent in situ hybridization,84 compared with ∼40% by array comprehensive genome hybridization85 ) and Epstein-Barr virus (EBV) infection (23% to 32%).83,86 Interestingly, 9p24.1 gains were associated with fewer PD-1+ cells in cHL (Table 2).42 Both PDL1/PDL2 gene amplification and PD-L1 expression have been associated with poorer prognosis (PFS84 and event-free survival61 ) in cHL. PD-L1 expression was also found on nonmalignant cells (predominantly tissue macrophages83 ) in cHL but seemed to have a less significant role than tumor PD-L1 expression.22,23
In contrast to HL and PMBCL cell lines with high PD-L1 expression, most DLBCL cell lines do not express PD-L1 in vitro but do express PD-L1 in vivo.25,41,87 PD-L1 was shown to be expressed in 26% to 75% of DLBCL samples with PD-L1+ cutoff ≥5%61,87,-89 and more frequently in ABC-DLBCL,57,60,87,88 and tumor PD-L1 expression has been associated with either poor prognosis or no significant prognostic effect.57,58,61,90 PDL1/PDL2 amplifications are rare in DLBCL, and 9p24.1 copy gain was identified in only 6% to 19% of patients with DLBCL.57,88,91 Another form of genetic alteration, disruption of the PDL1 3′ untranslated region, was identified in 8% of DLBCL samples.92 PD-L1 was also shown to be expressed in the tumor microenvironment of DLBCL (mainly on macrophages), either concurrently with tumor PD-L1 expression or alone (prevalence, 30% to 38%), but this has not been correlated with significant prognostic effect.57,58,83,87,90 EBV+ (frequency, 3% to 4% in western countries93,94 ) DLBCL has high PD-L1 expression on malignant B cells (mediated by latent membrane protein 1, an EBV-encoded antigen86 ) and infiltrating macrophages,83 but the clinical role of PD-L1 expression in EBV+ DLBCL is currently unknown. Moreover, a soluble form of PD-L1 was detected in the plasma but not in the serum of peripheral blood from DLBCL patients, and its expression levels had no correlation with PD-L1 expression on tumors. Elevated soluble PD-L1 expression was found to be either associated89,90 or not associated95 with poorer prognosis.
Remarkably, PMBCL, PCNSL, and PTL have >50% rates of 9p24.1 copy gains.82,91 PMBCL also has a high rate of 9p24.1 rearrangement (20%) associated with PD-L1/PD-L2 overexpression.96 Half of these rearranged PDL1/PDL2 genes in PMBCL were fused to the CIIA gene, leading to downregulation of MHC class II expression,97 which has been linked to incremental decreases in patient survival.98
In CLL/SLL lymph node samples compared with reactive lymph node samples, PD-L1 expression was increased on neoplastic B cells53,66 ; however, other studies showed that PD-L1 expression was mainly in the tumor microenvironment (likely histiocytes)76 but not on tumor cells (very low).61,74,76 In circulating CLL cells, PD-L1 levels were increased compared with normal controls in 1 study66 but were not increased in 2 studies.74,75 Whether the low tumor PD-L1 expression contributes to the pseudo-exhaustion of T cells in CLL is unknown.70,71 However, studies showed that the PD-1/PD-L1 axis is functionally active in CLL, as evidenced by the close interaction between PD-1+CD4+ T cells and PD-L1+ CLL cells in the CLL proliferation center, the spike in PD-1 expression on proliferating T cells and in PD-L1 expression on CLL cells after stimulation in vitro, and impaired interferon-γ (IFN-γ) production by CD8+ T cells after treatment with soluble PD-L1, which was reversed by anti-PD-L1 and/or anti-PD-1 antibodies in vitro.66 Like PD-1, PD-L1 expression in CLL/SLL had no prognostic significance in most studies,61,66 but increased expression intensity was associated with poor prognosis in a small-scale analysis.53
In other B-NHL entities, the rates of PD-L1 expression on neoplastic B cells are low: ∼5% in FL, ∼10% in high-grade MZL, and 0% in MCL.47,61,74,87 PD-L1 expression levels were shown to be low in FL47,61 but the mean expression intensities were higher in FL than in reactive lymph nodes.53 PD-1+ TILs in FL may receive inhibitory signals from PD-L1 expressed by a small fraction of histiocytes48 and regulatory T cells (Tregs).47 In a small number of patients with B-NHL, intratumoral CD4+CD25– T cells, but not Tregs, expressed PD-1, which interacted with PD-L1 on Tregs and inhibited proliferation of CD4+CD25– T cells.17 Alternative expression of PD-1 and FOXP3 was also observed in studies of FL and HL (Table 2).41,42,47 However, in another study, the number of PD-1+ TILs and FOXP3+ Tregs in 91 samples of FL showed a positive correlation.51 The prognostic significance of PD-L1 expression on T cells and histiocytes in FL is unclear.
Collectively, tumor PD-L1 expression has been better characterized than PD-1 expression in B-cell lymphomas, but PD-L1 expression in the tumor microenvironment has not been well defined and probably not separated from tumor PD-L1 expression in some studies. PD-1 and PD-L1 data have consistently demonstrated the clinical importance of PD-1 signaling in HL; accordingly, anti-PD-L antibodies restored the IFN-γ production function of HL-infiltrating T cells in vitro.41 PD-1/PD-L1 expression is heterogeneous in B-NHL and has been inconsistently associated with prognosis. PD-L1 blockade in DLBCL resulted in either enhanced IFN-γ secretion by T cells87 or no effect on the low production of IFN-γ in vitro.41 PD-1 blockade restored proliferation and cytokine production of T cells cocultured with EBV+ DLBCL cell lines in vitro.99 For FL, disruption of the tumor microenvironment by in vitro culture over time could restore the cytokine signaling in PD-1high TILs, and an anti-PD-1 monoclonal antibody (mAb) had no effect beyond isotype control.48 In a CLL mouse model, PD-1 blockade only modestly improved T-cell function and was insufficient to restore the antitumor activity of T cells,100 likely because increased CD200, CD270 (herpesvirus entry mediator; receptor for B- and T-lymphocyte attenuator), PD-L1, and CD276 (B7-H3) expression on CLL cells was also relevant for impaired T-cell metabolism, actin synapse formation, and T-cell dysfunction.53,100 In contrast, early PD-L1 blockade restored CD8+ T-cell function and prevented the development of CLL in vivo.101 PD-L1 blockade with an anti-PD-L1 antibody or PD-1 fusion protein in vitro partly restored the proliferation of CD4+CD25– T cells from the tumor sites of B-NHL (FL, DLBCL, and MCL).17 These preclinical studies provide a rationale for targeting the PD-1 immune checkpoint in B-cell lymphomas.
Therapeutic targeting of PD-1 with PD-1 blockade in B-cell lymphomas
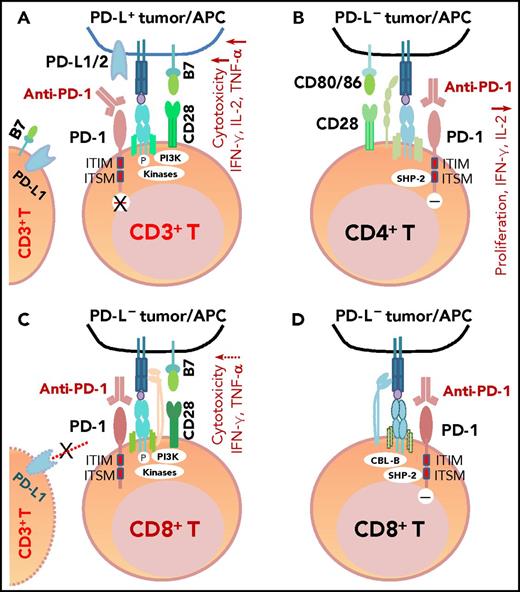
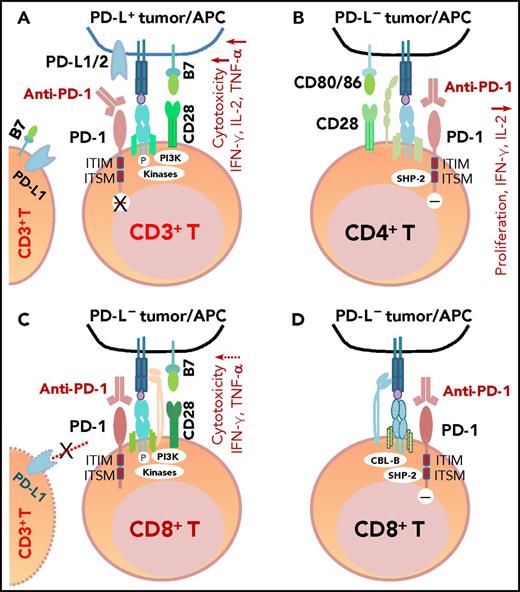
PD-1 antibodies currently approved by the US Food and Drug Administration (FDA) include nivolumab and pembrolizumab. These fully human or humanized immunoglobulin G4 mAbs block the binding of PD-L1/PD-L2 to PD-1 because of their high affinity and specificity (Figure 3A). One structure study suggested that the mechanisms of antagonism are highly similar among these mAbs,102 but another study showed that nivolumab and pembrolizumab bind to completely different areas of PD-1.103 Functional assays demonstrated that treatment with nivolumab enhanced antigen-specific T-cell responses, including proliferation and cytokine production of effector T cells28 ; no adverse immune-related events were observed in cynomolgus macaques, although nivolumab showed immunoreactivity to endocrine cells in normal human tissues.28
The mechanism of action of PD-1 blockade in PD-L+tumors and models of potential functional effects of anti-PD-1 therapy on PD-1+T cells (CD4+/CD8+) in patients without PD-L expression (PD-L–), according to the literature. (A) In PD-L+ tumors, the antigen-specific T-cell response is inhibited because PD-1 is engaged by PD-L1/2. PD-1 blockade with anti-PD-1 antibodies prevents PD-L1/PD-L2 from interacting with PD-1 and restores T-cell function (anti-PD-1 mAb acting as an antagonist). (B) In PD-L– tumors with PD-1+CD4+ T-cell infiltrate, according to Chemnitz et al80 and Bennett et al,122 PD-1 ligation with PD-1 antibodies inhibits CD4+ T-cell proliferation and cytokine production under suboptimal CD3 and CD28 costimulation conditions (anti-PD-1 mAb acting as a PD-1 agonist), which are caused by inhibition of TCR downstream signaling mediated by SHP-2 associated with immunoreceptor tyrosine-based switch motif (ITSM) of PD-1. It is unknown whether this scenario is relevant for some hyperprogressive diseases after PD-1 blockade therapy. (C) The effect of anti-PD-1 antibodies on PD-1+CD8+ T cells in PD-L– tumors is unknown. If the TCR signaling is strong with optimal CD28 costimulation and/or TCR engagement (in which case, PD-L– is likely caused by mutations or lack of IFN-γ receptor on PD-L– tumors, but not because of lack of IFN-γ release), PD-1 ligation with anti-PD-1 antibodies may have no significant effect on the high CD8+ T cell function.2,122 Furthermore, if circulating activated T cells express PD-L1 and the PD-1−PD-L1 axis suppresses PD-1+ or PD-L1+ T-cell function, PD-1 blockade could enhance CD4+/CD8+ T-cell function, thereby manifesting clinical activity in these PD-L– patients. (D) As another possibility for anti-PD-1 therapy in PD-L– tumors, engagement of PD-1 on CD8+ T cells by PD-1 antibodies could inhibit TCR signaling (acting as a PD-1 agonist) similar to ligation with the natural ligand PD-L1, mediated by SHP-2 phosphatase activity and TCR internalization/degradation as a result of increased CBL-b ubiquitin ligase activity.123 ITIM, immunoreceptor tyrosine-inhibitory motif.
The mechanism of action of PD-1 blockade in PD-L+tumors and models of potential functional effects of anti-PD-1 therapy on PD-1+T cells (CD4+/CD8+) in patients without PD-L expression (PD-L–), according to the literature. (A) In PD-L+ tumors, the antigen-specific T-cell response is inhibited because PD-1 is engaged by PD-L1/2. PD-1 blockade with anti-PD-1 antibodies prevents PD-L1/PD-L2 from interacting with PD-1 and restores T-cell function (anti-PD-1 mAb acting as an antagonist). (B) In PD-L– tumors with PD-1+CD4+ T-cell infiltrate, according to Chemnitz et al80 and Bennett et al,122 PD-1 ligation with PD-1 antibodies inhibits CD4+ T-cell proliferation and cytokine production under suboptimal CD3 and CD28 costimulation conditions (anti-PD-1 mAb acting as a PD-1 agonist), which are caused by inhibition of TCR downstream signaling mediated by SHP-2 associated with immunoreceptor tyrosine-based switch motif (ITSM) of PD-1. It is unknown whether this scenario is relevant for some hyperprogressive diseases after PD-1 blockade therapy. (C) The effect of anti-PD-1 antibodies on PD-1+CD8+ T cells in PD-L– tumors is unknown. If the TCR signaling is strong with optimal CD28 costimulation and/or TCR engagement (in which case, PD-L– is likely caused by mutations or lack of IFN-γ receptor on PD-L– tumors, but not because of lack of IFN-γ release), PD-1 ligation with anti-PD-1 antibodies may have no significant effect on the high CD8+ T cell function.2,122 Furthermore, if circulating activated T cells express PD-L1 and the PD-1−PD-L1 axis suppresses PD-1+ or PD-L1+ T-cell function, PD-1 blockade could enhance CD4+/CD8+ T-cell function, thereby manifesting clinical activity in these PD-L– patients. (D) As another possibility for anti-PD-1 therapy in PD-L– tumors, engagement of PD-1 on CD8+ T cells by PD-1 antibodies could inhibit TCR signaling (acting as a PD-1 agonist) similar to ligation with the natural ligand PD-L1, mediated by SHP-2 phosphatase activity and TCR internalization/degradation as a result of increased CBL-b ubiquitin ligase activity.123 ITIM, immunoreceptor tyrosine-inhibitory motif.
In multiple clinical trials in B-cell lymphomas, nivolumab, pembrolizumab, and another mAb, pidilizumab (CureTech), have shown clinical activity (Table 3). However, pidilizumab is no longer recognized as an anti-PD-1 mAb; therefore, pidilizumab trials104,-106 are not discussed in this review. Across lymphoma entities, anti-PD-1 monotherapy showed the greatest efficacy in R/R cHL.20,,-23,76,107,,,,,,,-115 In a phase 1 trial of nivolumab, the objective response rate (ORR) was remarkable (87%).20 In phase 2 trials, nivolumab and pembrolizumab had similar ORRs (68% and 69%) and OS rates (99%) at 6 months,22,23 leading to accelerated FDA approval in 2016 for nivolumab and in 2017 for pembrolizumab.
In R/R FL, the ORR was 40% with nivolumab in a phase 1b trial107 and 80% with combined pembrolizumab and rituximab in a phase 2 trial (interim results).112 In R/R DLBCL, the ORR with nivolumab was 36% in a phase Ib trial.107 In R/R PMBCL, the ORR with pembrolizumab was 41% in a phase 1b trial109 and 35% in a phase 2 trial (interim results).115 Notably, a retrospective study showed that all 4 patients (100%) with PCNSL/PTL (R/R PCNSL or PTL with central nervous system relapse) treated with nivolumab had clinical and radiographic responses, and 3 patients remained free of progression at 13+ to 17+ months.110 Phase 2 trials for nivolumab or pembrolizumab monotherapy in FL, DLBCL, PMBCL, and PCNSL/PTL are ongoing (CheckMate 140, CheckMate 139, NCT02362997, KEYNOTE-170,115 NCT02779101, NCT03255018, and CheckMate 647), and results informing ORRs, OS, and PFS are awaited. In CLL with Richter transformation (RT; DLBCL), the ORR with pembrolizumab was 44% in a phase 2 trial, and the median OS was 10.7 months with a median follow-up of 11 months. In contrast, the ORR was 0% in relapsed CLL.76 These clinical trials were all single-arm trials for nivolumab or pembrolizumab monotherapy in R/R settings. Two-arm trials for anti-PD-1 monotherapy in R/R settings and 2-arm and/or single-arm trials for combination therapies in first-line or R/R settings are ongoing, and results are currently not available.
Preclinical studies suggested that combining PD-1 blockade with costimulatory agonists, immune checkpoint blockade (such as blockade of CTLA-4,116 B7-H3,53,117 CD270,53 CD200R,53,100 LAG-3,60 or TIM-350,52,118 ), or other therapeutic agents (such as lenalidomide53 ) may have synergistic effects in B-cell lymphomas. Numerous combination therapies with nivolumab or pembrolizumab are being tested in B-cell lymphomas, including combinations with chemotherapy, radiotherapy, rituximab, MEDI-551 (anti-CD19), ipilimumab (anti-CTLA-4), brentuximab vedotin (anti-CD30 antibody-drug conjugate), blinatumomab (bispecific anti-CD19/CD3 T engager), AFM13 (bispecific anti-CD30/CD16A), lenalidomide, PI3K inhibitors (idelalisib, TGR-1202), Bruton tyrosine kinase inhibitors (ibrutinib, acalabrutinib), varlilumab (anti-CD27), urelumab (anti-CD137), G100 (TLR4 agonist), SEA-CD40 (anti-CD40), MK-1454 (STING agonist), BMS-986016 (anti-LAG-3), epacadostat (indoleamine 2,3-dioxygenase 1 inhibitor), L-NMMA (nitric oxide synthase inhibitor), veliparib (PARP inhibitor), histone deacetylase inhibitors (entinostat, vorinostat), RRx-001 (epigenetic agent), dendritic cell therapy, LTX-315 (oncolytic peptide), CD19/CD22 chimeric antigen receptor T cells (AUTO3), EBV-specific T cells (EB-VST cells), mogamulizumab (anti-CCR4), IFNγ-1b, DPX-Survivac (immunotherapeutic survivin vaccine), and personalized synthetic long peptide vaccines with polyinosinic:polycytidylic acid (TLR3 agonist). In addition, other PD-1 antibodies (AMP-514, SHR-1210, PDR001, BJB-A317, JS001, REGN2810, and IBI308), PD-L1 antibodies (atezolizumab, durvalumab, avelumab, and CK-301), and oral small-molecule CA-170 (PD-L1, PD-L2, and VISTA antagonist) as monotherapy and in combinations are also being tested in clinical trials for patients with HL or B-NHL.
Some combination trials have interim results available. Nivolumab and ipilimumab combination therapy had ORRs of 74% in HL and 20% in B-NHL in a phase 1 trial.108 Nivolumab combined with ibrutinib showed clinical activity in a small number of patients with R/R CLL or RT.111 The combination of pembrolizumab and rituximab showed a high ORR of 80% in relapsed FL.112 High complete response rates (50% to 65%) have been reported for the combination of nivolumab and brentuximab vedotin in patients with R/R HL in 2 phase 1/2 trials.113,114
Nivolumab and pembrolizumab showed acceptable safety profiles with low rates of discontinuation resulting from adverse events, although close monitoring is warranted, especially for patients with a history of acute graft-versus-host-disease.119 Serious immune-mediated adverse events included pneumonitis, neutropenia, thrombocytopenia, hepatitis, rash, dyspnea, anemia, colitis, and others. The rates of grade 3 to 4 adverse events were lower for pembrolizumab (6.4% to 16% in cHL and 12% in PMBCL) than for nivolumab (22% to 41% in cHL and 26% in NHL) with indicated doses, except for the high 60% rate for pembrolizumab in R/R CLL with RT with prior ibrutinib therapy (Table 3).
Recently, a novel aggressive pattern of hyperprogression was identified in ∼9% of patients receiving anti-PD-1/anti-PD-L1 monotherapy, including 1 (14%) of the 7 lymphoma patients who were studied.120,121 Hyperprogression was associated with elderly age but not baseline tumor burden or specific tumor type.120 In solid tumors, MDM2/MDM4 amplification and EGFR aberrations were associated with increased risk of hyperprogression.121 Among patients whose PD-L1+ status was known, 1 (33%) in 3 hyperprogressors had PD-L1– disease, which was higher than the PD-L1– rate (6% [2 of 32]) observed in non-hyperprogressors (P = .24).120 Although the relevance of PD-L1– PD-1+ expression to disease hyperprogression is unknown, it has been shown in vitro that under suboptimal conditions, engagement of PD-1 with anti-PD-1 mAbs inhibited rather than enhanced CD4+ T-cell activation, just like PD-1 ligation by PD-L1 (Figure 3B).80,122 However, engagement of PD-1 on CD8+ T cells123 by anti-PD-1 mAbs in the PD-L1– setting (Figure 3C-D) was not shown. It is also unclear whether clinical use of nivolumab and pembrolizumab can act as PD-1 agonists instead of antagonists28 in PD-L1– patients. Also unknown is whether PD-L1 interacts more with CD80 or other receptors during blockade of PD-1,124 whether PD-L1 and PD-L2 have positive roles,3,8,10,12,,-15,125,,,,-130 and whether some PD-1 polymorphisms affect the action of PD-1 blockade in patients (nonblocking PD-L1 mAbs enhance the binding of PD-L1 to PD-1131 ), which could be relevant for hyperprogression after PD-1/PD-L1 blockade.
Biomarker studies and immune monitoring in B-cell lymphomas
Predictive biomarkers for response to PD-1 blockade are being eagerly pursued. PD-L1 expression is a widely used biomarker in solid tumors, because effective blocking action requires preexisting PD-L1−PD-1 interaction in tumors (Figure 3A), and PD-L1 positivity may indicate ongoing immune response.132 However, the predictive value of PD-L1 is inconsistent in clinical trials, which may be attributable to the complexity of the immune signaling network, dynamic and clustered PD-L1 expression patterns, and variable PD-L1 resources (tumor, tumor microenvironment, peripheral blood), as well as the use of different detecting antibodies, staining procedures, and PD-L1+ cutoffs. Microsatellite instability (MSI) arising from deficient mismatch-repair (dMMR), has emerged as another predictive biomarker for PD-1 blockade.133 Pembrolizumab has received FDA first tissue/site-agnostic approval for the treatment of adult and pediatric patients with MSI-high or dMMR metastatic solid tumors.134 Nivolumab has been approved for the treatment of patients (age 12 years or older) with R/R MSI-high or dMMR metastatic colorectal cancer.
Efforts have also been undertaken to identify predictive biomarkers in PD-1 blockade trials in B-cell lymphomas (Table 4). The first nivolumab phase 1 trial in cHL suggested that PDL1/PDL2 copy number alterations and high PD-L1/PD-L2 expression were relevant for the high ORR in cHL. In contrast, tumor-infiltrating T cells largely expressed low levels of PD-1.20 Three subsequent trials of pembrolizumab or nivolumab in cHL examined PD-L1 expression. High prevalence of PD-L1 expression (94% to 100%) was found in 2 pembrolizumab trials, but PD-L1 expression defined as either ≥1% membrane staining with moderate or strong intensity or detailed stratification by staining intensity, membrane staining, and histiocyte scores seemed not to be predictive.21,23 In the nivolumab phase 2 trial, PD-L1 expression levels were calculated as H scores, multiplying the percentage of PD-L1+ malignant cells by the average intensity of positive staining; PD-L1 expression on malignant Reed-Sternberg cells, but not PD-L1 on infiltrating normal cells, was associated with treatment response.22 Moreover, the magnitude of 9p24.1 gains correlated with H scores, and amplification showed association with treatment response. However, 50% of patients with low PD-L1 H scores in the first quartile and 83% of patients with 9p24.1 polysomy also achieved partial remission.22 The predictive values of PD-L2 expression and JAK2/STAT1 signaling, which are increased because of PDL1/PDL2/JAK2 co-amplification, and other signaling pathways (such as AP-183 and MEK/ERK/MAPK signaling135 which upregulate PD-L1 expression) in cHL are unknown.
In B-NHL (except for PMBCL), PDL1/PDL2 genetic alterations seemed not to be associated with PD-L1 expression or ORR to nivolumab.107 In CLL with RT, baseline PD-L1 expression (mainly on histiocytes) was associated with response to pembrolizumab in a phase 2 study. PD-1 expression, which was found mainly on CLL B cells, was not statistically associated with treatment response76 ; whether PD-1 expression on CLL cells and PD-1 expression on T cells have differential associations with treatment response was not determined. T-cell infiltration, 9p24.1 alterations, EBV positivity, and MSI status were not associated with clinical response in CLL with RT.76 In FL, baseline PD-L1 expression in T cells and monocytes in peripheral blood samples correlated with response to pidilizumab (the antibody specificity has been questioned) and rituximab combination therapy.106
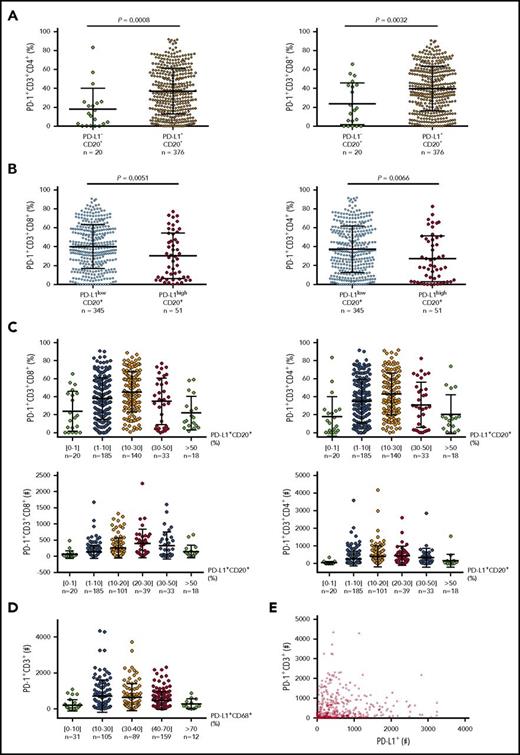
Data on predictive biomarkers in DLBCL are currently unavailable. Because knowledge of PD-128 and PD-L1 (Figure 380,122,123 ) expression in a large number of pretreatment samples may be helpful for understanding responses, we examined PD-L1 and PD-1 expression in EBV− DLBCL samples and performed correlative studies (preliminary data). We found that tumor PD-L1 expression compared with PD-1 expression had a much stronger correlation with CD8+ T-cell infiltration, whereas the correlation of PD-L1 with PD-1 expression showed oscillation-like patterns (Figure 4), explaining the contradictory observations in previous studies.57,58,61 The mechanisms underlying these correlations may include that activated T cells express PD-1 and produce IFN-γ, which induces PD-L1, whereas high levels of PD-1 expression in the presence of PD-L1 in turn inhibit T-cell function, including IFN-γ production.136 Low PD-L1 expression could also result from low IFN-γ production by PD-1high CD8+ T cells under suboptimal costiumulation conditions or a fixed dysfunctional state.137 The implication of these unpublished data for PD-1 blockade biomarkers is unknown.
Correlation between PD-1 and PD-L1 expression in DLBCL. (A) At a low cutoff for PD-L1 positivity on CD20+ lymphoma cells, the PD-L1+ group (95% of the cohort) had a significantly higher mean level of PD-1 expression than the PD-L1– group. (B) At a 30% cutoff for PD-L1high on CD20+ lymphoma cells (according to Kiyasu et al57 ), the PD-L1high group (12.9% of the cohort) had a significantly lower mean level of PD-1 expression than the PD-L1low group. (C) PD-L1 levels on lymphoma cells were further stratified and correlated to PD-1+ levels (%) and absolute PD-1+ T cell numbers in the tumor microenvironment. (D) PD-L1 levels (%) on CD68+ cells were stratified and correlated to absolute PD-1+ T-cell numbers in the same tissues. (E) Dot plot for total PD-L1+ and PD-1+ cell counts in DLBCL tissues. Each dot represents the data for 1 patient.
Correlation between PD-1 and PD-L1 expression in DLBCL. (A) At a low cutoff for PD-L1 positivity on CD20+ lymphoma cells, the PD-L1+ group (95% of the cohort) had a significantly higher mean level of PD-1 expression than the PD-L1– group. (B) At a 30% cutoff for PD-L1high on CD20+ lymphoma cells (according to Kiyasu et al57 ), the PD-L1high group (12.9% of the cohort) had a significantly lower mean level of PD-1 expression than the PD-L1low group. (C) PD-L1 levels on lymphoma cells were further stratified and correlated to PD-1+ levels (%) and absolute PD-1+ T cell numbers in the tumor microenvironment. (D) PD-L1 levels (%) on CD68+ cells were stratified and correlated to absolute PD-1+ T-cell numbers in the same tissues. (E) Dot plot for total PD-L1+ and PD-1+ cell counts in DLBCL tissues. Each dot represents the data for 1 patient.
Concluding remarks
In this article, we reviewed the studies on PD-1/PD-L1 expression and therapeutic targeting in B-cell lymphomas and discussed variable roles of PD-1/PD-L1 signaling in different lymphoma entities. In phase 2 trials, the efficacy of anti-PD-1 monotherapy was remarkable in cHL, moderate in PMBCL (comparable to that in melanoma) and CLL with RT, and lacking in CLL without RT; combination therapies have shown encouraging results in FL and cHL. Anti-PD-1 monotherapy also showed promise in DLBCL in a phase 1 study. PCNSL and PTL, which frequently have 9p24.1 genetic alterations, may also be suitable for anti-PD-1 immunotherapy according to a retrospective analysis.
In cHL, 9p24.1 amplification and tumor PD-L1 H scores showed significant but not absolute correlation with ORR. In CLL with RT, PD-L1 expression in histiocytes correlated with ORR in a small-scale analysis. However, PD-L1 expression may not be the sole efficacy determinant. cHL also has an inflammatory microenvironment, strong CD80/CD86 and PD-L2 expression, and increased JAK/STAT signaling in Reed-Sternberg cells.29 CD28 is strongly or moderately expressed on HL-infiltrating T cells but only weakly expressed on DLBCL-infiltrating T cells.30,138,139 CLL cells express multiple inhibitory ligands53 but have no or low CD80/CD86 expression.29,32,34 In addition, immunologic synapse formation and T-cell metabolism are impaired in CLL,53,100 and subsets of CD8+ T cells are associated with a replicative senescence phenotype.69 Improved understanding of these mechanisms will lead to the development of novel predictive markers and combination strategies. Vigorous biomarker and immune monitoring studies are underway, and we can envision that further benefit will be brought to more patients with B-cell lymphoma.
Acknowledgments
This work was supported by National Institutes of Health, National Cancer Institute grants R01CA138688, R01CA187415, and 1RC1CA146299 (K.H.Y.). This work was also partially funded by National Cancer Institute and National Institutes of Health grants P50CA136411 and P50CA142509, and by MD Anderson Cancer Center Support Grant CA016672. Z.Y.X.-M. and K.H.Y. are supported by The University of Texas MD Anderson Cancer Center Institutional Research and Development Fund, Gundersen Lutheran Medical Foundation Award, Hagemeister Lymphoma Foundation Award, and the University Cancer Foundation via the Sister Institution Network Fund at The University of Texas MD Anderson Cancer Center. J.Z. is supported in part by the Key Program of National Natural Science Funds of China (81230052 and 81630006). K.H.Y. also receives research support from Roche Molecular System, Gilead Sciences, Seattle Genetics, Dai Sanyo, Adaptive Biotechnology, Incyte Pharmaceutical, HTG Molecular Diagnostics and Perfectgen Diagnostics.
Authorship
Contribution: All authors conceived of and designed the study and wrote and approved the article.
Conflict-of-interest disclosure: The authors declare no competing financial interests.
Correspondence: Ken H. Young, The University of Texas MD Anderson Cancer Center, Department of Hematopathology, 1515 Holcombe Blvd, Houston, TX 77030-4009; e-mail: khyoung@mdanderson.org.

