Key Points
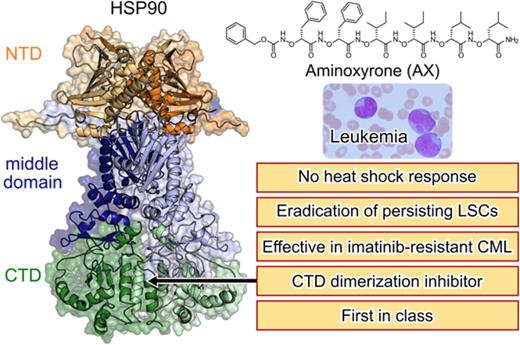
We have developed a first-in-class C-terminal HSP90 inhibitor (AX) that is effective against TKI-resistant CML and leukemic stem cells.
Unlike the majority of HSP90 inhibitors, AX does not induce the HSR as a resistance mechanism.
Abstract
Heat shock protein 90 (HSP90) stabilizes many client proteins, including the BCR-ABL1 oncoprotein. BCR-ABL1 is the hallmark of chronic myeloid leukemia (CML) in which treatment-free remission (TFR) is limited, with clinical and economic consequences. Thus, there is an urgent need for novel therapeutics that synergize with current treatment approaches. Several inhibitors targeting the N-terminal domain of HSP90 are under investigation, but side effects such as induction of the heat shock response (HSR) and toxicity have so far precluded their US Food and Drug Administration approval. We have developed a novel inhibitor (aminoxyrone [AX]) of HSP90 function by targeting HSP90 dimerization via the C-terminal domain. This was achieved by structure-based molecular design, chemical synthesis, and functional preclinical in vitro and in vivo validation using CML cell lines and patient-derived CML cells. AX is a promising potential candidate that induces apoptosis in the leukemic stem cell fraction (CD34+CD38−) as well as the leukemic bulk (CD34+CD38+) of primary CML and in tyrosine kinase inhibitor (TKI)–resistant cells. Furthermore, BCR-ABL1 oncoprotein and related pro-oncogenic cellular responses are downregulated, and targeting the HSP90 C terminus by AX does not induce the HSR in vitro and in vivo. We also probed the potential of AX in other therapy-refractory leukemias. Therefore, AX is the first peptidomimetic C-terminal HSP90 inhibitor with the potential to increase TFR in TKI-sensitive and refractory CML patients and also offers a novel therapeutic option for patients with other types of therapy-refractory leukemia because of its low toxicity profile and lack of HSR.
Introduction
Heat shock protein 90 (HSP90) acts as a molecular chaperone, thereby ensuring correct protein folding of several oncogenic proteins involved in leukemia such as BCR-ABL1 and its downstream signaling partners.1-5 HSP90 expression is also enriched in several leukemia subtypes, making HSP90 a promising therapeutic approach in the treatment of therapy-refractory leukemia, such as BCR-ABL1+ leukemia,1,6-8 FLT3-ITD+ acute myeloid leukemia (AML)9-11 and Philadelphia chromosome (Ph)-like B-cell precursor acute lymphoblastic leukemia (BCP-ALL).12,13 Several HSP90 inhibitors have been developed, but none have been clinically approved by the US Food and Drug Association (supplemental Table 1, available on the Blood Web site).8,14 The majority of the HSP90 inhibitors target the adenosine triphosphate binding pocket in the HSP90 N terminus,14,15 leading to dissociation of heat shock factor-1 (HSF-1), which gets subsequently phosphorylated, trimerized, and translocated to the nucleus.16 Here, HSF-1 induces the transcription of other HSPs, such as HSP70, HSP40, or HSP27, that act as antiapoptotic chaperones and protect proteins from degradation, thereby inducing a resistance mechanism called the heat shock response (HSR),17 which potentially weakens the cytotoxic effect of HSP90 inhibitors.14,15,18-22 C-terminal inhibitors of HSP90, such as novobiocin and its analogs, do not trigger an HSR.23,24 The reason for the induction of the HSR by classical HSP90 inhibitors is not well understood. It has been hypothesized that inhibition of HSP90 might trigger cellular effects through mechanisms that involve targets other than HSP90 (off-target effects).23,25 The off-target effects hypothesis is further supported by the significant difference (100-fold) between the efficiency of N-terminal inhibitors in killing cancer cells and their binding affinity to HSP90 in biochemical assays.23 For instance, the well-known N-terminal HSP90 inhibitor AUY922 induces cell death at low nanomolar concentrations but binds to HSP90 with micromolar affinity.23 In contrast, C-terminal HSP90 inhibitors are likely selective for HSP90 given that their cytotoxicity against cancer cells correlates with their binding affinity for HSP90.23,24 Thus, targeting the HSP90 C-terminal domain may ultimately be the most promising route to discover safe and efficacious HSP90 inhibitors.
In the present study, we evaluated a novel HSP90 inhibitor aminoxyrone (AX) in chronic myeloid leukemia (CML), a stem cell disease that can in most cases be controlled by tyrosine kinase inhibitor (TKI) treatment, but treatment-free remission (TFR) is still not satisfactory. Approximately 40% to 60% of patients who discontinue TKI treatment develop molecular relapse and need to restart them.26 TKIs target proliferating leukemic clones but are unable to eradicate persisting leukemia stem cells (LSCs).27,28 This implicates long-term dependence on them with consequences for patients’ quality-of-life and economic resources. Patients feel chronically ill, which is not related to their CML but due to the moderate to severe TKI side effects, which ∼30% of patients experience.29 For instance, acute side effects of imatinib (IM) are impaired physical and mental health status in patients <60 years of age,30 whereas dasatinib can cause pleural effusion and arterial hypertension,31 and nilotinib causes vascular events.32 The use of TKIs is especially controversially discussed in young adults and children, because none of the TKIs are recommended during pregnancy and/or lactation, and their effects on fertility and skeletal growth have not been systematically analyzed. Hence, the development and characterization of novel therapeutic agents that specifically target CML LSCs and are capable of inducing sustained TFR are of enormous clinical and economic value.
We show that AX targets LSCs in CML patients and is effective in TKI-resistant CML subtypes and therefore promising in adding value to sustained TFR. In addition, inhibition of the HSP90 C terminus is effective in high-risk BCR-ABL1+ BCP-ALL, FLT3-ITD+ AML, and Ph-like BCP-ALL, comprising a relevant proportion of therapy-resistant leukemia in adults and children.
Methods
Chemical synthesis and 2-dimensional nuclear magnetic resonance spectroscopy
See supplemental Note 1 for general methods, synthetic protocols, compound characterization, and spectral data.
Circular dichroism (CD) spectroscopy
CD spectra in trifluoroethanol (50 µM, 1 mm path length) and sodium phosphate buffer (10 µM, 5 mm path length) were recorded on a J-810 Spectropolarimeter (Jasco) at 20°C and background corrected by solvent subtraction.
Autodisplay dimerization assay
Surface display of HSP90 on Escherichia coli BL21 (DE3) cells was performed as described before.33 See supplemental Note 2 for further details.
Microscale thermophoresis (MST)
The HSP90 CTD was purified as described before34 and labeled with the Monolith NT Protein Labeling Kit RED-NHS (Amine-reactive; NanoTemper Technologies GmbH, Munich, Germany) according to the manufacturer’s protocol. See supplemental note 2 for further details.
Analytical ultracentrifugation
Sedimentation velocity experiments were carried out using a Beckman Proteome Laboratory XL-A ultracentrifuge (Beckman Coulter, Indianapolis, IN) equipped with an absorbance detection system and an 8-hole rotor. See supplemental Note 2 for further details.
Luciferase refolding assay
The luciferase assay was performed with K562 cells stably expressing luciferase transgene, as described previously,24 with some modifications. See supplemental Note 2 for further details.
Drug-affinity responsive target stability (DARTS)
The DARTS assay was carried to evaluate the protease protection of AX from thermolysin, as described previously.24 See supplemental Note 2 for further details.
Western blot (WB) and Blue-native gel
Cell lysates were generated after 48-hour treatment of leukemic cells with AX, IM, novobiocin (NB), or AUY922. Blue-native gels were performed following the manufacturer’s instructions (Invitrogen) and as described previously.24 See supplemental Note 2 for further details.
Molecular dynamics (MD) simulations and computation of effective binding energies
To provide a structural model of the binding mode of AX at the HSP90 CTD, we performed 60 MD simulations of at least 400 nanosecond length of free diffusion35 of AX in the presence of the CTD. During the MD simulations, AX was not biased by any guiding force. Resulting MD trajectories were analyzed with respect to potential binding sites of AX and its binding mode. Furthermore, effective binding energy calculations of AX binding to the CTD were performed.36 See supplemental Note 3 for further details.
Cell culture
K562, KCL22, HL60, Kasumi, 697, SEM, and Mutz-2 leukemic cell lines were cultured in RPMI 1640 supplemented with 10% fetal calf serum (FCS) and maintained at 37°C with 5% CO2, except for the Mutz-237 and SUP-B15 (BCR-ABL1) BCP-ALL cell lines, which were cultured in McCoy 5A supplemented with 20% FCS (DSMZ, Braunschweig, Germany). Normal Ba/F3 (murine pro-B cell line) or expressing BCR-ABL1T315I, M351T, and E255K mutants38 were cultured in RPMI 1640 (10% FCS) supplemented with or without interleukin-3 (IL-3) (10 ng/mL), respectively. The BA/F3T315I ponatinib-resistant cell line was generated as described previously39 and is referred to as BA/F3T315I (PNr). In addition, the IM-resistant K562 (1 µM), KCL22 (2.5 µM), and SUP-B15 (2 µM) lines were generated as described previously40 and are referred to as K562 IMr, KCL22 IMr, and SUP-B15 IMr, respectively. In IM-resistant cell line models, ABL1 kinase domain was sequenced for BCR-ABL1 point mutation using Sanger sequencing, including K562 and K562 IMr, KCL22 (T315I, F317L) and KCL22 IMr (T315I and F317L), SUP-B15 (T315I) and SUP-B15 IMr (T315I), BA/F3T315I (T315I and Y272H), and BA/F3T315I (PNr) (T315I and Y272H).
Primary cell culture
Fresh cord blood (CB) samples were obtained from the Institute for Transplantation Diagnostics and Cell Therapeutics (Heinrich Heine University, Duesseldorf) after informed consent approval of the local ethical committee. Mononuclear cells (MNCs) were isolated by Ficoll density gradient centrifugation using standard procedures and later cultured in Mononuclear Cell Medium (PromoCell, Heidelberg, Germany). CD34+ cells were later sorted from these MNCs using magnetic-activated cell sorting (MACS; Miltenyi Biotec, Bergisch Gladbach, Germany).37 Primary T (CD3+), natural killer (NK) (CD56+), and B (CD19+) cells were isolated from PB MNCs from healthy individuals after using MACS (Miltenyi Biotec). Cytokine profiling was performed on supernatant recovered from primary T, NK, and B cells after 48-hour treatment with respective compounds using Cytokine 25-Plex Human ProcartaPlex Panel 1B (Thermo Fisher Scientific) following the supplier’s guidelines.
Primary patient samples were obtained from newly diagnosed or relapsed patients (supplemental Table 2) after informed consent approval of the local ethics committee and were cultured either in Stemline II Hematopoietic Stem Cell Expansion Medium (Sigma-Aldrich) or in Mononuclear Cell Medium (PromoCell). CML and BCR-ABL1+ BCP-ALL samples were sorted for CD34+CD38+/− using the CD34+CD38− Cell Isolation Kit, human (Miltenyi Biotec).
Viability assay
Inhibitors were printed on white 96-well or 384-well plates (Thermo Fisher Scientific) with their increasing concentration (50 nM to 25 µM) along with respective controls by using a digital dispenser (D300e; Tecan, Männedorf, Switzerland). Cell viability was monitored after 72 hours using CellTitre-Glo luminescent assay (Promega, Madison, WI) using a microplate reader (Spark, Tecan). The 50% inhibitory concentration (IC50) for compounds (all inhibitors were bought from MedChemExpress) were determined by plotting raw data (normalized to controls) using sigmoid dose curve and nonlinear regression (GraphPad Prism, San Diego, CA).
Proliferation assay
Cell proliferation was examined after treatment with respective compounds using an automated cell counter, which uses trypan exclusion method (Vi-CELL XR, Beckman Coulter). Proliferation was measured after every 24-hour interval.
Cell cycle assay
AX- or NB-treated cells (48 hours) were fixed with chilled (70%) ethanol for 24 hours to allow the access of propidium iodide (PI) to the DNA. Fixed cells were treated with ribonuclease to digest RNA and later incubated with 200 µL PI (50 µg/mL stock) for 10 minutes at 37°C and immediately subjected to fluorescence-activated cell sorter (FACS) analysis.
Annexin V staining
To evaluate apoptosis, cells treated with respective compounds or control for 48 hours were stained with Annexin V and PI and later subjected to FACS following the supplier’s guidelines (Invitrogen, Carlsbad, CA).
Caspase-3/7-Glo assay
Cells were treated with respective compounds or control in white 96-well or 384-well plates. Enzymatic activity of caspase-3/7 was then examined by caspase-3/7–dependent Glo assay (absorbance at 405 nm) following the manufacturer’s instructions (Promega) using a microplate reader (Spark, Tecan).
FACS
FACS was performed on FACSCalibur (Becton Dickinson, Heidelberg, Germany) using fluorochrome-coupled monoclonal antibodies along with the following matched isotype controls: anti-CD34 (8G12; BD Biosciences), anti-CD11b (Bear1), anti-CD14 (RMO52), anti-CD13 (Beckman Coulter), and anti-CD33 (Miltenyi Biotec)
Colony-forming unit assay
Colony-forming unit assays were performed initially by treating cells in the liquid medium for 24 hour. Later, treated cells were seeded in a semisolid methylcellulose-based medium containing respective compounds or control.37 Colonies were counted after 14 days.
In vivo xenograft tumor model
A total of 5 × 10⁵ K-562-luciferase–expressing (stably transduced) cells mixed with Matrigel matrix (Corning) were injected subcutaneously in the dorsal flank of NSG (B6 NOD.Cg-Prkdcscid Il2rgtm1Wjl /SzJ) mice (005557; The Jackson Laboratory, Bar Harbor, ME). Engraftment was monitored by measuring luminescence 3 or 4 days after intraperitoneal injection of 150 µg/100 µL D-Luciferin Firefly sodium salt monohydrate (Biosynth, Staad, Switzerland) using the Caliper IVIS Lumina II Multispectral Imaging System (Perkin Elmer, Rodgau, Germany) and Living Image Software. AX (0.5 mg/kg dose) or vehicle (dimethyl sulfoxide [DMSO]) was administered starting from the day after the transplantation by peritumoral injection for 17 days (n = 5 per group). Mice were sacrificed on day 17, and excised tumors were weighed and subjected to WB analysis. No blinding experiment was performed. Animal husbandry and experiments were conducted in accordance with the German Animal Welfare Act at the Institute for Tumor Biology and Experimental Therapy, Georg-Speyer-Haus, Frankfurt, Germany.
Results
Design and synthesis of HSP90 CTD dimerization inhibitors
HSP90 is a homodimer, with each monomer consisting of three major functional domains, of which the C-terminal domain (CTD) mediates HSP90 dimerization (Figure 1A). The CTD dimerization interface is formed by a characteristic 4-helix bundle (Figure 1B).41 We recently resolved hot spots in the HSP90 CTD dimerization interface (I688, Y689, I692, and L696; Figure 1C) and identified the first peptidic inhibitors shown to bind to the CTD.33,34 Subsequently, we demonstrated that α-aminoxy peptides, a novel class of peptidomimetic foldamers, can fold into a unique 28-helical conformation.42 Molecular modeling studies revealed that this 28-helix can mimic the spatial arrangement of peptide side chains in α-helices.42 Herein, we found that side chains of an α-aminoxy hexapeptide can accurately mimic the HSP90 dimerization hot spots (Figure 1C). Based on this knowledge, we designed 2 tailor-made potential HSP90 CTD dimerization inhibitors (α-aminoxy hexapeptides 1 (later referred to as AX) and 2, Figure 1D). A combination of solution- and solid-phase supported methods was used to synthesize 1 (AX) and 2 (Figure 1D; supplemental Note 1). Our investigation of the conformational properties by 2-dimensional nuclear magnetic resonance spectroscopy (supplemental Figures 1 and 2) and CD spectroscopy (supplemental Figure 3) confirmed that 1 (AX) and 2 are able to fold into the desired 28-helical conformation indicating that they can adopt the required secondary structure to mimic the HSP90 CTD dimerization hot spots.
Design and synthesis of HSP90 CTD dimerization inhibitors. (A) Crystal structure of the HSP90 dimer from Saccharomyces cerevisiae (Protein Data Bank [PDB] accession number 2CG956 ), shown as a transparent surface with cartoon representation. One monomer is colored in white and one in red, with 3 domains (N terminal, middle, and C terminal) colored in different shades of red. (B) Dimeric CTD from human HSP90 (PDB accession number 3Q6M57 ). Both subunits are colored differently. Helices H4, H4′, and H5, H5′ form the CTD dimerization interface. Dashed lines show where the middle domains would be located. (C) Overlay of a hexameric α-aminoxy peptide with all-methyl side chains (blue sticks) onto Cβ atoms of hot spot amino acids I688, Y689, I692, and L69634 (gray sticks) on helix H5′ (sequence P681 to D699) shown in transparent cartoon representation, with backbone atoms shown as black lines. The right panel shows the structures rotated by 90° such that the helix C terminus is oriented toward the viewer. Cβ reference atoms of hot spot amino acids are depicted as magenta spheres and Cβ atoms of the α-aminoxy peptide as orange spheres. (D) Solid-phase synthesis of α-aminoxy hexapeptides 1 (AX) and 2. Reagents and conditions: a), (i) 20% piperidine in N,N-dimethylformamide (DMF), room temperature, 2 × 15 min; (ii) Phth-NOLeu-NOLeu-OH, BOP, HOBt, N-ethylmorpholine (NEM) in DMF, room temperature, 24 hours; b) 5% hydrazine hydrate in MeOH, 2 × 15 min; (ii) Phth-NOIle-NOIle-OH, BOP, HOBt, NEM in DMF, room temperature, 24 hours; c) (i) 5% hydrazine hydrate in MeOH, 2 × 15 min; (ii) Cbz-NOPhe-NOPhe-OH, BOP, HOBt, NEM in DMF, room temperature, 24 hours; (iii) trifluoroacetic acid/triethylsilane (98:2, v:v), room temperature, 1.5 hours; d) (i) 5% hydrazine hydrate in MeOH, 2 × 15 min; (ii) Phth-NOPhe-OH, BOP, HOBt, NEM in DMF, room temperature, 24 hours; e) 5% hydrazine hydrate in MeOH, 2 × 15 min; (ii) Cbz-NOTyr(t-Bu)-OH, BOP, HOBt, NEM in DMF, room temperature, 24 hours; (iii) trifluoroacetic acid/triethylsilane (98:2, v:v), room temperature, 1.5 hours. PEG AM resin, polyethylene glycol aminomethyl-polystyrene resin.
Design and synthesis of HSP90 CTD dimerization inhibitors. (A) Crystal structure of the HSP90 dimer from Saccharomyces cerevisiae (Protein Data Bank [PDB] accession number 2CG956 ), shown as a transparent surface with cartoon representation. One monomer is colored in white and one in red, with 3 domains (N terminal, middle, and C terminal) colored in different shades of red. (B) Dimeric CTD from human HSP90 (PDB accession number 3Q6M57 ). Both subunits are colored differently. Helices H4, H4′, and H5, H5′ form the CTD dimerization interface. Dashed lines show where the middle domains would be located. (C) Overlay of a hexameric α-aminoxy peptide with all-methyl side chains (blue sticks) onto Cβ atoms of hot spot amino acids I688, Y689, I692, and L69634 (gray sticks) on helix H5′ (sequence P681 to D699) shown in transparent cartoon representation, with backbone atoms shown as black lines. The right panel shows the structures rotated by 90° such that the helix C terminus is oriented toward the viewer. Cβ reference atoms of hot spot amino acids are depicted as magenta spheres and Cβ atoms of the α-aminoxy peptide as orange spheres. (D) Solid-phase synthesis of α-aminoxy hexapeptides 1 (AX) and 2. Reagents and conditions: a), (i) 20% piperidine in N,N-dimethylformamide (DMF), room temperature, 2 × 15 min; (ii) Phth-NOLeu-NOLeu-OH, BOP, HOBt, N-ethylmorpholine (NEM) in DMF, room temperature, 24 hours; b) 5% hydrazine hydrate in MeOH, 2 × 15 min; (ii) Phth-NOIle-NOIle-OH, BOP, HOBt, NEM in DMF, room temperature, 24 hours; c) (i) 5% hydrazine hydrate in MeOH, 2 × 15 min; (ii) Cbz-NOPhe-NOPhe-OH, BOP, HOBt, NEM in DMF, room temperature, 24 hours; (iii) trifluoroacetic acid/triethylsilane (98:2, v:v), room temperature, 1.5 hours; d) (i) 5% hydrazine hydrate in MeOH, 2 × 15 min; (ii) Phth-NOPhe-OH, BOP, HOBt, NEM in DMF, room temperature, 24 hours; e) 5% hydrazine hydrate in MeOH, 2 × 15 min; (ii) Cbz-NOTyr(t-Bu)-OH, BOP, HOBt, NEM in DMF, room temperature, 24 hours; (iii) trifluoroacetic acid/triethylsilane (98:2, v:v), room temperature, 1.5 hours. PEG AM resin, polyethylene glycol aminomethyl-polystyrene resin.
AX inhibits HSP90 dimer formation and specifically binds to the CTD of HSP90
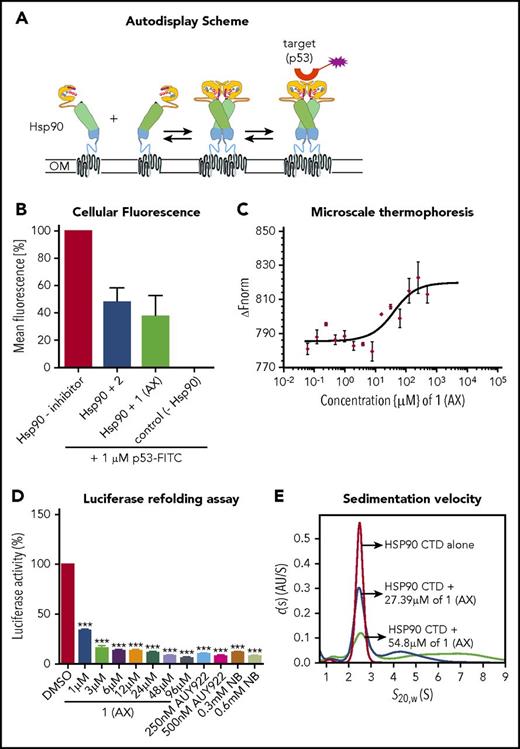
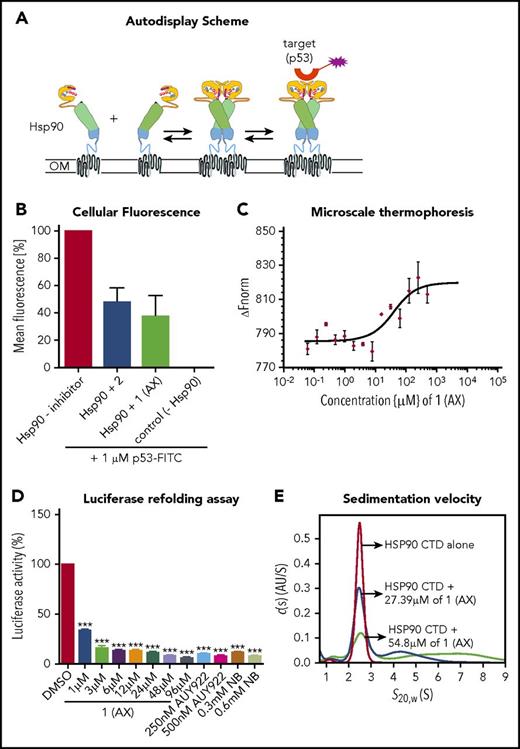
To elucidate the biological properties of 1 (AX) and 2, we first showed by means of a dimerization assay based on the autodisplay technology33 that 1 (AX) and 2 inhibit HSP90 dimer formation (Figure 2A-B). Furthermore, binding of 1 (AX) and 2 to the CTD of HSP90 was revealed by MST measurements with the purified, recombinant, NT-647 labeled CTD of HSP90 (1 (AX): Kd = 27.4 μM; 2: Kd = 44.2 μM; Figure 2C; supplemental Figure 4A).
Selective binding of compound 1 (AX) and 2 to the HSP90 C terminus. (A) Scheme of the HSP90 dimerization assay using Autodisplay. HSP90 is displayed on the surface of E coli cells via the Autodisplay technique. The motility of the anchoring domain within the outer membrane of E coli facilitates the dimerization of Hsp90. Dimerized HSP90 on the surface of E coli is capable of binding to fluorescein isothiocyanate (FITC)–labeled p53. This leads to an increase of cellular fluorescence, which can then be detected via flow cytometry. Blocking the dimerization of surface displayed Hsp90 inhibits the binding of FITC-labeled p53 to HSP90 and thus leads to a decrease of cellular fluorescence.33 (B) Inhibition of dimerization of on E coli cells displayed HSP90 measured via flow cytometry. Experiments were performed 3 times independently (n = 3), and error bars denote the standard deviation. Incubation of E coli BL21 (DE3) cells displaying HSP90 with 1 µM FITC-labeled p53 leads to a high cellular fluorescence, indicating dimerization of HSP90, whereas no cellular fluorescence was detectable in E coli cells without displaying HSP90 (control cells). Preincubation of cells with surface displayed HSP90 with 50 µM of 1 (AX) and 2, respectively, leads to a loss in cellular fluorescence, indicating a lowered binding affinity of FITC-labeled p53 to surface-displayed HSP90. (C) Determination of the apparent Kd value of the NT-647–labeled C-terminal domain of HSP90 and 1 (AX) via MST. A constant amount of the 50 nM–labeled C-terminal domain of HSP90 was used (n = 3). The resulting mean values were determined and used in the Kd fit formula. This yielded an apparent Kd of 27.39 µM for 1 (AX). (D) A cell-based HSP90-dependent luciferase assay was performed on stably expressing K562-luciferase cells. The extent of thermally denatured luciferase refolding (3 minutes at 50°C) in the presence of 1 (AX), NB, and AUY922 was monitored after 180 minutes. (E) Influence of 1 (AX) on the size distribution of HSP90 CTD revealed by sedimentation velocity analysis. 20 μM HSP90 CTD alone (purple), 20 μM HSP90 CTD plus 27.4 μM 1 (AX) (blue), and 20 μM HSP90 CTD plus 54.8 μM 1 (AX) (cyan) were analyzed at 50 000 rpm at 20°C, and the continuous c(s) model was applied to evaluate the data. The s-values were standardized to s20,w-values. Columns depict the mean of 3 independent experiments (n = 3). Significance analyses of normally distributed data with variance similar between groups used paired, 2-tailed Student t test. *P < .05, **P < .005, ***P < .001.
Selective binding of compound 1 (AX) and 2 to the HSP90 C terminus. (A) Scheme of the HSP90 dimerization assay using Autodisplay. HSP90 is displayed on the surface of E coli cells via the Autodisplay technique. The motility of the anchoring domain within the outer membrane of E coli facilitates the dimerization of Hsp90. Dimerized HSP90 on the surface of E coli is capable of binding to fluorescein isothiocyanate (FITC)–labeled p53. This leads to an increase of cellular fluorescence, which can then be detected via flow cytometry. Blocking the dimerization of surface displayed Hsp90 inhibits the binding of FITC-labeled p53 to HSP90 and thus leads to a decrease of cellular fluorescence.33 (B) Inhibition of dimerization of on E coli cells displayed HSP90 measured via flow cytometry. Experiments were performed 3 times independently (n = 3), and error bars denote the standard deviation. Incubation of E coli BL21 (DE3) cells displaying HSP90 with 1 µM FITC-labeled p53 leads to a high cellular fluorescence, indicating dimerization of HSP90, whereas no cellular fluorescence was detectable in E coli cells without displaying HSP90 (control cells). Preincubation of cells with surface displayed HSP90 with 50 µM of 1 (AX) and 2, respectively, leads to a loss in cellular fluorescence, indicating a lowered binding affinity of FITC-labeled p53 to surface-displayed HSP90. (C) Determination of the apparent Kd value of the NT-647–labeled C-terminal domain of HSP90 and 1 (AX) via MST. A constant amount of the 50 nM–labeled C-terminal domain of HSP90 was used (n = 3). The resulting mean values were determined and used in the Kd fit formula. This yielded an apparent Kd of 27.39 µM for 1 (AX). (D) A cell-based HSP90-dependent luciferase assay was performed on stably expressing K562-luciferase cells. The extent of thermally denatured luciferase refolding (3 minutes at 50°C) in the presence of 1 (AX), NB, and AUY922 was monitored after 180 minutes. (E) Influence of 1 (AX) on the size distribution of HSP90 CTD revealed by sedimentation velocity analysis. 20 μM HSP90 CTD alone (purple), 20 μM HSP90 CTD plus 27.4 μM 1 (AX) (blue), and 20 μM HSP90 CTD plus 54.8 μM 1 (AX) (cyan) were analyzed at 50 000 rpm at 20°C, and the continuous c(s) model was applied to evaluate the data. The s-values were standardized to s20,w-values. Columns depict the mean of 3 independent experiments (n = 3). Significance analyses of normally distributed data with variance similar between groups used paired, 2-tailed Student t test. *P < .05, **P < .005, ***P < .001.
A cell-based luciferase refolding assay24 using K562 cells revealed a dose-dependent reduction in the luciferase activity after application of 1 (AX) or 2 comparable to NB (CTD HSP90 inhibitor) and AUY922 (NTD HSP90 inhibitor) (Figure 2D; supplemental Figure 4B). Hence, 1 (AX) (IC50: 5.72 ± 0.31 µM [K562]; 7.1 ± 1.7 µM [HL60]) was selected for further experiments due to the higher efficacy in autodisplay, MST, the luciferase refolding assay, and the viability assay compared with 2 (IC50: 16.8 ± 0.11 µM [K562]; 17.4 ± 0.4 µM [HL60]) (supplemental Figure 4C). We proved specific binding of AX to HSP90 complexes by native gel analysis, resulting in a more potent disruption of HSP90α and HSP90β (also HSP40 and HSP27) complexes (including their monomers/dimers) at cytotoxic concentrations (supplemental Figure 5A) than NB and AUY922. In contrast, treatment with AUY922 resulted in an elevated expression of HSR-associated protein complexes (including their monomers/dimers) of HSP40 and HSP27 (supplemental Figure 5A). AX protected recombinant HSP90α protein from degradation against thermolysin digestion, an assay commonly used to quantify DARTS24 (supplemental Figure 5B). Immunoblotting was performed under reducing (+dithiothreitol) and nonreducing (−dithiothreitol) conditions, which revealed that AX acts on HSP90 oligomers, in contrast to NB but in concordance with AUY922 (supplemental Figure 5C). Sedimentation velocity analysis revealed that AX influences the size distribution of HSP90 CTD, in that AX is able to either dissociate oligomeric species of or suppress HSP90 CTD oligomerization (Figure 2E; supplemental Note 2).
In summary, these results reveal that AX specifically binds to the CTD of HSP90 and inhibits its dimerization.
AX is predicted to bind to the HSP90 CTD dimerization interface and mimic hot spot residues on helix H5′
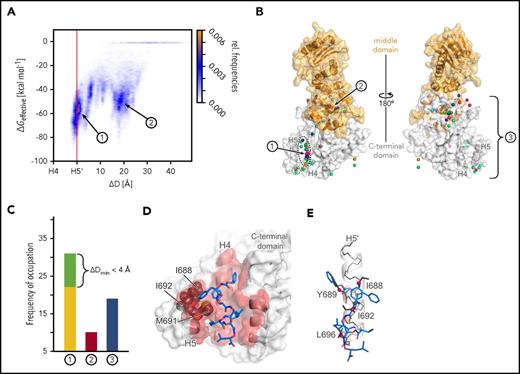
To provide a binding mode model of AX at the HSP90 CTD, we performed 60 MD simulations of at least 400 nanosecond length of free diffusion of AX in the presence of the CTD (supplemental Figure 7 and supplemental Note 3). In 22 simulations, AX binds between helices H4 and H5 in the dimerization interface (site 1 in Figure 3A; supplemental Figure 7). In the remaining cases, AX either binds to a hydrophobic site occupied by the middle domain in full-length HSP90 (site 2 in Figure 3A-B; supplemental Figures 7 and 8) or gets trapped in locations scattered across the CTD (site 3 in Figure 3B-C; supplemental Figures 7 and 9). Effective binding energy calculations corroborate these results in that the most favorable energies are found for AX at site 1 (Figure 3A; supplemental Figures 10 and 11). The conformations of AX at site 1 revealed side chains partially aligned with side chains of hot spot residues of helix H5′ (Figure 3D-E). The side chain that distinguishes AX from 2 (Figure 1D) binds to a hydrophobic groove formed by I688, I692, and M691 (Figure 3D), where the additional polar hydroxyl group in 2 would be disfavorable, which may explain the lower apparent Kd of 2. Taken together, the computational results suggest that AX binds to the HSP90 CTD dimerization interface and mimics hot spot residues on helix H5′.34
Results of MD simulations of free diffusion of AX. (A) Relative frequencies of ligand pose (see color scale) as a function of the relative distance between the center of mass of AX and helix H4 (ΔD) and computed effective energies of binding (ΔGeffective). (B) Locations of the center of mass of AX (spheres) after 60 MD simulations of 400 nanosecond length each, with each simulation result colored differently. The black dashed line highlights all conformations that are bound to dimerization interface 1 with ΔDmin ≤ 0 Å, and the green dashed line highlights those with ΔDmin < 4 Å. The protein structure is shown as surface representation with the middle domain (not present during MD simulations) in orange and the CTD in white. In the panel, the structure is rotated by 180° around the y-axis. (C) Frequency of occupation of binding sites 1 (yellow), close to 1 (green; see definition in the main text), 2 (red), or 3 (blue) by AX across 60 MD simulations. (D) Binding mode model of AX. A representative conformation of AX bound to the CTD, extracted from the MD trajectory. Residues I688, I692, and M691 (gray spheres) bind to the side chain that distinguishes AX from 2. (E) An overlay of AX onto helix H5′ (Figure 1B-C) extracted from the crystal structure (PDB accession number 3Q6M57 ). In panels D and E, AX is depicted as blue sticks; hot spot amino acids I688, Y689, I692, and L69634 as gray sticks with Cβ atoms as magenta spheres; helix H5′ as a white cartoon with black backbone atoms; and the CTD in the left panel as surface representation, with all residues within 3 Å of AX colored in red. In panels A-C, 1, 2, and 3 denote the binding sites of AX, where 3 represents all binding sites besides 1 and 2.
Results of MD simulations of free diffusion of AX. (A) Relative frequencies of ligand pose (see color scale) as a function of the relative distance between the center of mass of AX and helix H4 (ΔD) and computed effective energies of binding (ΔGeffective). (B) Locations of the center of mass of AX (spheres) after 60 MD simulations of 400 nanosecond length each, with each simulation result colored differently. The black dashed line highlights all conformations that are bound to dimerization interface 1 with ΔDmin ≤ 0 Å, and the green dashed line highlights those with ΔDmin < 4 Å. The protein structure is shown as surface representation with the middle domain (not present during MD simulations) in orange and the CTD in white. In the panel, the structure is rotated by 180° around the y-axis. (C) Frequency of occupation of binding sites 1 (yellow), close to 1 (green; see definition in the main text), 2 (red), or 3 (blue) by AX across 60 MD simulations. (D) Binding mode model of AX. A representative conformation of AX bound to the CTD, extracted from the MD trajectory. Residues I688, I692, and M691 (gray spheres) bind to the side chain that distinguishes AX from 2. (E) An overlay of AX onto helix H5′ (Figure 1B-C) extracted from the crystal structure (PDB accession number 3Q6M57 ). In panels D and E, AX is depicted as blue sticks; hot spot amino acids I688, Y689, I692, and L69634 as gray sticks with Cβ atoms as magenta spheres; helix H5′ as a white cartoon with black backbone atoms; and the CTD in the left panel as surface representation, with all residues within 3 Å of AX colored in red. In panels A-C, 1, 2, and 3 denote the binding sites of AX, where 3 represents all binding sites besides 1 and 2.
AX destabilizes BCR-ABL1 without inducing HSR in vitro and in vivo
HSP90 expression is high in BCR-ABL1+/− leukemia cell lines such as HL60, K562, and Mutz-2 (supplemental Figure 12A). Later, we determined the average IC50 for AX in selected leukemic cell lines (Table 1). Upon 48-hour exposure to AX, K562 and KCL22 cells downregulated BCR-ABL1 levels as well as downstream signaling pathways such as STAT5a and CRKL, as evaluated by WB analysis (supplemental Figure 12B). AX additionally reduced pAKT-S473, pS6 expression, and expression of client proteins associated with HSP90 chaperone activity, involving t-AKT, t-STAT5a, t-CRKL, cMYC, and BCL2 (supplemental Figure 12B).
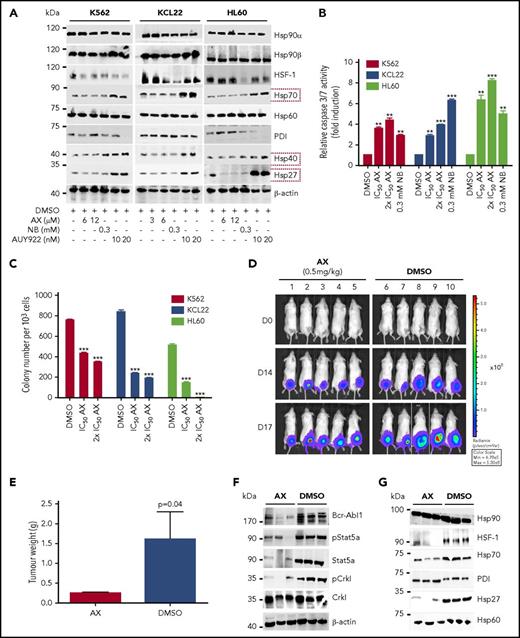
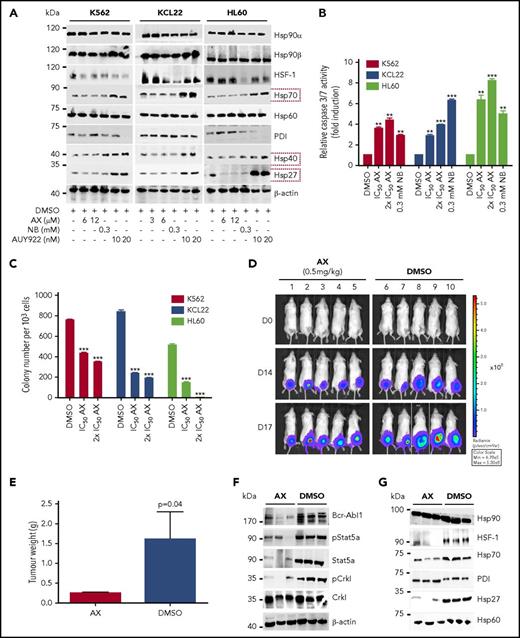
Furthermore, AX triggered the degradation of HSP90 client proteins without elevating the expression of HSPs (HSP70, HSP40, and HSP27) involved in the HSR, in contrast to AUY922 (Figure 4A; supplemental Figure 5A). We observed inhibition of cell proliferation (supplemental Figure 12C) and induction of both late apoptotic (Annexin+PI+) and necrotic (Annexin−PI+) cells after the exposure to AX at its IC50 concentration (Table 1) in K562, HL60, and KCL22 cell lines (supplemental Figure 12D). Caspase-3/7 enzyme–dependent apoptosis assays with an induction of approximately three- to fivefold of apoptotic cells in K562, HL60, Mutz-2 (data not shown), and KCL22 corroborated the observations from cell proliferation studies, similarly to exposure with NB (Figure 4B). K562 cells were dose-dependently arrested in G1 phase, and we observed a reduction in G2/M phase after exposure to AX (supplemental Figure 12E). Furthermore, AX facilitated early differentiation in a liquid medium, as measured by expression of myelomonocytic antigens markers involving CD13 and CD38 in K562 cells and CD11b in HL60 cells (supplemental Figure 12F). Moreover, 48-hour exposure of AX to K562, HL60, Mutz-2 (data not shown), and KCL22 significantly reduced their colony-forming capacity (Figure 4C) in accordance to NB, whereas AX was effective at micromolar concentrations ∼100-fold below those of NB in the millimolar range. We additionally transplanted K562-Luc (stably expressing the luciferase reporter gene) in an in vivo xenograft model and treated the tumor locally with AX (0.5 mg/kg dose) for 17 days. We obtained a significant reduction in tumor weight (Figure 4D-E), indicating that AX has an antioncogenic potential in vivo. BCR-ABL1 protein and its downstream signaling pathways (STAT5a and CRKL) (Figure 4F) were downregulated, and HSR was not initiated in the excised tumors (Figure 4G).
AX is a potent inhibitor in leukemic cell lines without inducing any HSR. (A) K562, KCL22, and HL60 were treated with the indicated (cytotoxic) concentration of AX, NB and AUY922 for 48 hours, and protein lysates were later subjected to immunoblot analysis. AX and NB (C-terminal HSP90 inhibitors) do not induce expression of HSP70, HSP40, and HSP27, whereas AUY922 (an N-terminal HSP90 inhibitor) demonstrates HSR induction by triggering their expression. HSP60 (primarily present in mitochondria) and PDI (primarily present in endoplasmic reticulum) served as controls for the HSR in the cytoplasm, in response to inhibition of HSP90 dimerization via the CTD. (B) K562, KCL22, and HL60 (Mutz-2; data not shown) were treated with AX for 48 hours, and enzymatic activity of caspase-3/7 was later examined by caspase-3/7–dependent Glo assay (absorbance at 405 nm). (C) K562, HL60, KCL22 cells were seeded in methylcellulose medium containing respective compounds at indicated concentration after treatment in liquid medium for 24 hours. Colonies were counted after 14 days. (D) 5 × 10⁵ luciferase-expressing K562 cells were subcutaneously transplanted into NSG mice. Starting the day after transplantation, animals were treated by peritumoral injection (15 µg) of compound AX (0.5 mg/kg dose) or solvent only (DMSO). One control DMSO-treated mouse was sacrificed earlier (on day 16) because of large tumor size. Luminescence was monitored every 3 or 4 days after intraperitoneal injection of 100 µL luciferin, and the final analysis was performed on day 17 (n = 5 mice per group). (E) AX reduced tumor burden with respect to tumor weight 0.24 ± 0.01 g vs vehicle 1.6 ± 0.6 g (P = .04; 1-tailed t test). (F) Immunoblot analysis of tumor samples derived from mice treated with AX revealed downregulation of BCR-ABL1 kinase activity and its associated downstream signaling pathways involving Stat5a and Crkl. (G) Immunoblot analysis of tumor samples derived from mice after treatment with AX. Samples displayed no HSR, as evaluated by expression of HSF-1, HSP70, and HSP27; PDI and HSP60 were used as controls. Columns depict the mean of 3 independent experiments (n = 3). Significance analyses of normally distributed data with variance similar between groups used paired, 2-tailed Student t test. *P < .05, **P < .005, ***P < .001.
AX is a potent inhibitor in leukemic cell lines without inducing any HSR. (A) K562, KCL22, and HL60 were treated with the indicated (cytotoxic) concentration of AX, NB and AUY922 for 48 hours, and protein lysates were later subjected to immunoblot analysis. AX and NB (C-terminal HSP90 inhibitors) do not induce expression of HSP70, HSP40, and HSP27, whereas AUY922 (an N-terminal HSP90 inhibitor) demonstrates HSR induction by triggering their expression. HSP60 (primarily present in mitochondria) and PDI (primarily present in endoplasmic reticulum) served as controls for the HSR in the cytoplasm, in response to inhibition of HSP90 dimerization via the CTD. (B) K562, KCL22, and HL60 (Mutz-2; data not shown) were treated with AX for 48 hours, and enzymatic activity of caspase-3/7 was later examined by caspase-3/7–dependent Glo assay (absorbance at 405 nm). (C) K562, HL60, KCL22 cells were seeded in methylcellulose medium containing respective compounds at indicated concentration after treatment in liquid medium for 24 hours. Colonies were counted after 14 days. (D) 5 × 10⁵ luciferase-expressing K562 cells were subcutaneously transplanted into NSG mice. Starting the day after transplantation, animals were treated by peritumoral injection (15 µg) of compound AX (0.5 mg/kg dose) or solvent only (DMSO). One control DMSO-treated mouse was sacrificed earlier (on day 16) because of large tumor size. Luminescence was monitored every 3 or 4 days after intraperitoneal injection of 100 µL luciferin, and the final analysis was performed on day 17 (n = 5 mice per group). (E) AX reduced tumor burden with respect to tumor weight 0.24 ± 0.01 g vs vehicle 1.6 ± 0.6 g (P = .04; 1-tailed t test). (F) Immunoblot analysis of tumor samples derived from mice treated with AX revealed downregulation of BCR-ABL1 kinase activity and its associated downstream signaling pathways involving Stat5a and Crkl. (G) Immunoblot analysis of tumor samples derived from mice after treatment with AX. Samples displayed no HSR, as evaluated by expression of HSF-1, HSP70, and HSP27; PDI and HSP60 were used as controls. Columns depict the mean of 3 independent experiments (n = 3). Significance analyses of normally distributed data with variance similar between groups used paired, 2-tailed Student t test. *P < .05, **P < .005, ***P < .001.
In summary, these data confirm a potent anti–BCR-ABL1 effect of AX in the absence of HSR induction and at low cytotoxic concentrations in vitro and in vivo.
AX is effective in TKI-resistant leukemic cell line models
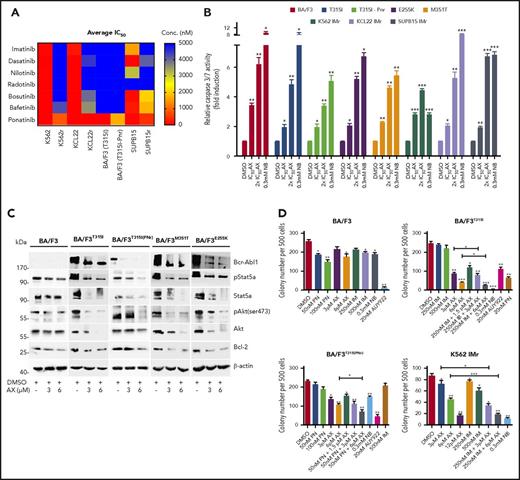
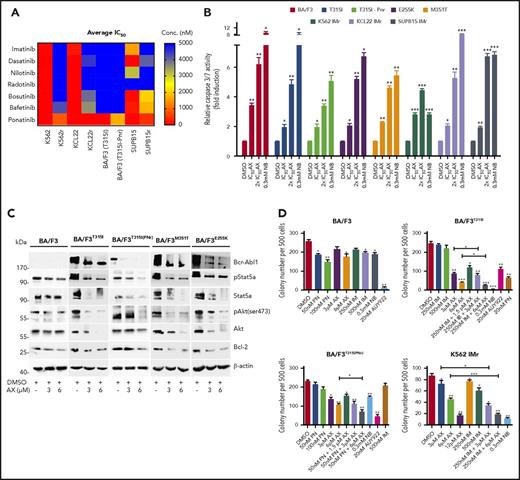
BCR-ABL1T315I, E255K, and M351T are the clinically relevant mutations leading to constitutive ABL1 kinase activity and a severe TKI-resistance profile. The effect of AX is superior to that of IM and other second- and third-generation TKIs (including PN) in murine BA/F3 cell line models encompassing BCR-ABL1T315I, T315I (PNr), E255K, and M351T mutants (supplemental Figure 13A; Figure 5A). In these cell line models, AX reduced cell viability (IC50 ∼3-4 µM) (Table 1) and proliferation (supplemental Figure 13B) and induced apoptosis (Figure 5B) in a manner similar to NB (0.3 mM). Additionally, after application of AX, BCR-ABL1 oncoprotein was destabilized, and downstream signaling pathways (AKT, STAT5a, and BCL-2) were blocked with increasing concentrations of AX, which is comparable to the results from TKI-sensitive leukemic cell lines and in vivo xenograft model (Figure 5C). To evaluate the effect of AX in combination with IM, colony-forming assays were performed in which AX was administered alone or coadministered (at lower doses) with IM. Coadministration of AX with IM further reduced the colony-forming capacity of BCR-ABL1T315I and T315I (PNr) cells when compared with treatment with AX alone, NB, AUY922, and PN, which were taken as controls (Figure 5D). Furthermore, we have generated human BCR-ABL1+ IM resistant cell lines, including K562 IMr, KCL22 IMr, and SUP-B15 IMr.40 These cell lines were also found to be resistant to second- and third-generation TKIs when compared with their normal counterparts (Figure 5A). In analogy to murine BA/F3 cell line models and respective sensitive cell lines, AX reduced the viability of human IM-resistant cell lines at nearly similar IC50 concentrations (Table 1) and in addition inhibited proliferation, induced apoptosis, destabilized BCR-ABL1 oncoproteins, blocked downstream signaling, and further reduced colony-forming ability when used in combination with IM as compared with AX treatment alone (Figure 5D; supplemental Figures 14-16).
Efficacy of AX in TKI-resistant leukemic cell line models. (A) IM-resistant K562, KCL22, SUP-B15, and BA/F3-expressing BCR-ABL1T315I, T315I (PNr) along with their respective normal cell lines were treated with second- and third-generation TKIs (dasatinib, nilotinib, radotinib, bosutinib, befetinib, and ponatinib) at 7 different concentrations (ranging from 50 nM to 25 µM) for 72 hours. Later, the average IC50 was determined and plotted on a heat map. (B) BA/F3 cells expressing BCR-ABL1T315I, T315I (PNr), M351T, and E255K mutants, K562 IMr, KCL22 IMr, and SUP-B15 IMr cells were treated with the indicated concentration of AX (48 hours) and later enzymatic activity of caspase-3/7 were examined by caspase-3/7 dependent-Glo assay (absorbance at 405 nm). (C) Likewise, in human leukemia cell lines, AX causes downregulation of BCR-ABL1 and subsequently its associated downstream signaling pathways, including Stat5a, Akt, and Bcl-2 in BA/F3 cells expressing BCR-ABL1T315I, T315I (PNr), M351T, and E255K mutants. (D) Normal BA/F3 cells, BA/F3-expressing BCR-ABL1T315I and T3151 (PNr) mutants, and K562 IMr cells were seeded in methylcellulose medium containing respective compounds at indicated concentration after treatment in liquid medium for 24 hours. Colonies were counted after 14 days. Significance analysis of normally distributed data with variance similar between groups used paired, 2-tailed Student t test. *P < .05, **P < .005, ***P < .001.
Efficacy of AX in TKI-resistant leukemic cell line models. (A) IM-resistant K562, KCL22, SUP-B15, and BA/F3-expressing BCR-ABL1T315I, T315I (PNr) along with their respective normal cell lines were treated with second- and third-generation TKIs (dasatinib, nilotinib, radotinib, bosutinib, befetinib, and ponatinib) at 7 different concentrations (ranging from 50 nM to 25 µM) for 72 hours. Later, the average IC50 was determined and plotted on a heat map. (B) BA/F3 cells expressing BCR-ABL1T315I, T315I (PNr), M351T, and E255K mutants, K562 IMr, KCL22 IMr, and SUP-B15 IMr cells were treated with the indicated concentration of AX (48 hours) and later enzymatic activity of caspase-3/7 were examined by caspase-3/7 dependent-Glo assay (absorbance at 405 nm). (C) Likewise, in human leukemia cell lines, AX causes downregulation of BCR-ABL1 and subsequently its associated downstream signaling pathways, including Stat5a, Akt, and Bcl-2 in BA/F3 cells expressing BCR-ABL1T315I, T315I (PNr), M351T, and E255K mutants. (D) Normal BA/F3 cells, BA/F3-expressing BCR-ABL1T315I and T3151 (PNr) mutants, and K562 IMr cells were seeded in methylcellulose medium containing respective compounds at indicated concentration after treatment in liquid medium for 24 hours. Colonies were counted after 14 days. Significance analysis of normally distributed data with variance similar between groups used paired, 2-tailed Student t test. *P < .05, **P < .005, ***P < .001.
AX suppresses human LSCs and acts in a reasonable therapeutic window
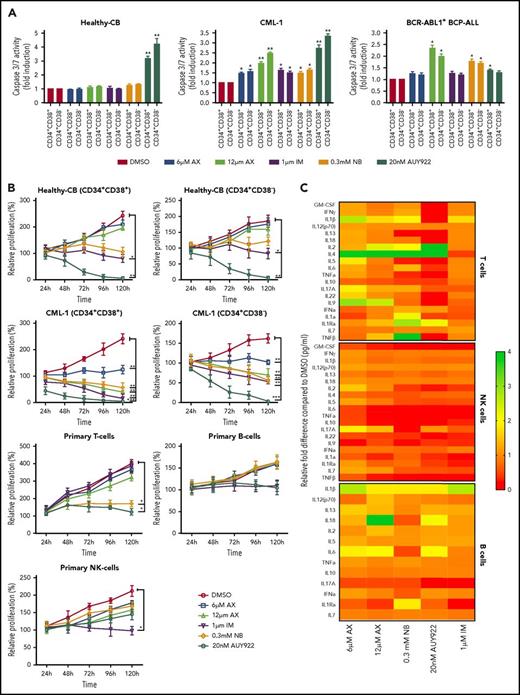
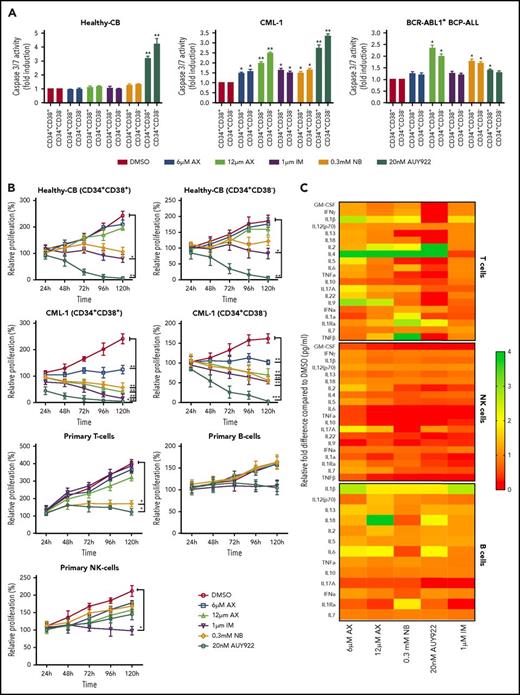
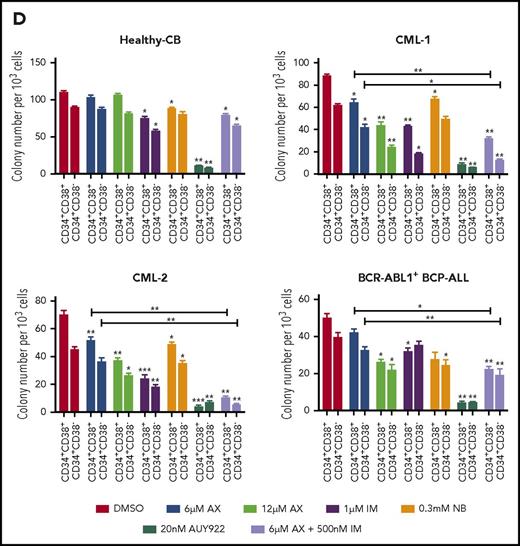
The major challenge in treating CML and other stem cell diseases is the elimination of LSCs to establish sustained TFR.43,44 We therefore have cell sorted 2 patient-derived CML samples taken from diagnosis without prior treatment (clinical data provided in supplemental Table 2) and 1 relapse BCR-ABL1+ BCP-ALL sample for CD34+CD38− as markers for CML/BCP-ALL LSCs. AX did not differentiate between CD34+CD38+ and CD34+CD38− subpopulations and significantly inhibited cell growth and induced apoptosis in these leukemic fractions as compared with healthy-CB-derived CD34+CD38+ or CD34+CD38− counterparts, where IM, NB, and AUY922 were used as a control (Figure 6A-B; supplemental Figure 17A-B). The clinical value of AX depends on its therapeutic window. In this regard, we have evaluated the average IC50 (20.94 ± 3.07 µM) (supplemental Figure 18A) similar to leukemic cell lines and assessed the cell viability using trypan exclusion method in healthy-CB MNCs (supplemental Figure 18B) after exposure to AX. The cytotoxic effect of AX was significantly less pronounced on healthy fraction than on leukemia cell line models (Table 1). Unlike in leukemic cell lines, AX did not induce early differentiation of CB-CD34+ cells in liquid medium (supplemental Figure 18C) and did not affect the cell proliferation of different healthy blood fractions, including, T, NK, and B cells (Figure 6b). Cytokine profiling (25 cytokines) was performed from the supernatants obtained from these healthy blood cell fractions after treatment with AX (Figure 6C; supplemental Table 3). As compared with AUY922, there was a modest change in the cytokine profile with AX, especially in T cells, with the exception for IL-17a in NK cells and IL-6 in B cells (Figure 6C; supplemental Table 3). Moreover, AX specifically inhibited the colony-forming capacity of the CML (n = 3) and BCP-ALL (n = 1) patient-derived CD34+CD38+ and CD34+CD38− fraction as compared with their healthy-CB-derived counterparts (Figure 6D; supplemental Figure 17C). The coadministration of AX along with IM further blocked the colony formation of both CD34+CD38+ and CD34+CD38− leukemic fractions (Figure 6D). Like in leukemic cell lines, AX did not inflict any HSR (supplemental Figure 19A) and induced early differentiation in CMLCD34+ in liquid medium (supplemental Figure 19B).
AX suppresses human LSCs and acts in a reasonable therapeutic window. (A) One BCR-ABL1+ CML patient sample and a relapse BCP-ALL patient sample, along with a healthy human-CB-derived CD34+CD38+/− (sorted by MACS) sample, were treated with increasing concentrations of AX or controls (NB, AUY922, or IM). Later, the enzymatic activity of caspase-3/7 was examined using a caspase-3/7–dependent Glo assay after 5 days of treatment. (B) Primary patient samples along with healthy control cells (including primary B, T, and NK cells) were treated with the indicated concentration of AX or controls (NB, AUY922, or IM), and viable cells were counted after every 24-hour interval for 5 days. AX specifically targets leukemic samples (both the leukemic bulk and leukemic stem cell fractions) contrary to healthy control cells. (C) Supernatants were collected from primary T, NK, and B cells after 48-hour treatment with respective compound and then evaluated for the detection of 25 different human cytokines. Heat maps depict the fold difference relative to the control (DMSO) in picograms per milliliter. Some cytokines were omitted from the analysis because their concentration was below the detection limit. (D) CD34+CD38+/− cells from 2 BCR-ABL1+ CML (CML-1 and CML-2) patient samples and 1 TKI-resistant BCR-ABL1+ BCR-ALL patient sample, along with healthy CB controls, were seeded in methylcellulose medium containing respective compounds at the indicated concentration after treatment in liquid medium for 24 hours. Colonies were counted after 14 days (n = 5). Significance analysis of normally distributed data with variance similar between groups used a paired, 2-tailed Student t test. *P < .05, **P < .005, ***P < .001. IFNa, interferon α; GM-CSF, granulocyte-macrophage colony-stimulating factor; TNFa, tumor necrosis factor α.
AX suppresses human LSCs and acts in a reasonable therapeutic window. (A) One BCR-ABL1+ CML patient sample and a relapse BCP-ALL patient sample, along with a healthy human-CB-derived CD34+CD38+/− (sorted by MACS) sample, were treated with increasing concentrations of AX or controls (NB, AUY922, or IM). Later, the enzymatic activity of caspase-3/7 was examined using a caspase-3/7–dependent Glo assay after 5 days of treatment. (B) Primary patient samples along with healthy control cells (including primary B, T, and NK cells) were treated with the indicated concentration of AX or controls (NB, AUY922, or IM), and viable cells were counted after every 24-hour interval for 5 days. AX specifically targets leukemic samples (both the leukemic bulk and leukemic stem cell fractions) contrary to healthy control cells. (C) Supernatants were collected from primary T, NK, and B cells after 48-hour treatment with respective compound and then evaluated for the detection of 25 different human cytokines. Heat maps depict the fold difference relative to the control (DMSO) in picograms per milliliter. Some cytokines were omitted from the analysis because their concentration was below the detection limit. (D) CD34+CD38+/− cells from 2 BCR-ABL1+ CML (CML-1 and CML-2) patient samples and 1 TKI-resistant BCR-ABL1+ BCR-ALL patient sample, along with healthy CB controls, were seeded in methylcellulose medium containing respective compounds at the indicated concentration after treatment in liquid medium for 24 hours. Colonies were counted after 14 days (n = 5). Significance analysis of normally distributed data with variance similar between groups used a paired, 2-tailed Student t test. *P < .05, **P < .005, ***P < .001. IFNa, interferon α; GM-CSF, granulocyte-macrophage colony-stimulating factor; TNFa, tumor necrosis factor α.
As HSP90 is involved in chaperoning several other oncoproteins besides BCR-ABL1,4,45 which is involved in several other leukemia subtypes, we evaluated the effect of AX on BCR-ABL1− leukemia involving, FLT3 ITD+ AML (n = 2), Ph-like ALL (n = 1), and CLL (n = 1) clinical samples. Likewise, in BCR-ABL1+ CML samples, AX inhibited growth and induced apoptosis in FLT3-ITD+ AML and reduced colony formation in all 4 patient samples (Figure 6D; supplemental Figures 20 and 21).
Discussion
The involvement in a plethora of oncogenic pathways has positioned HSP90 as a prominent therapeutic target. Malignant cells are particularly sensitive to HSP90 inhibition.14,46 Over the last decade, ∼15 different inhibitors targeting the adenosine triphosphate binding pocket in HSP90’s N terminus have been assessed in >40 different clinical trials; however, the entire class of these inhibitors instigates an HSR.8,14,15,18-22,24,47-49 Ocular toxicity is a major concern with HSP90 inhibitors; for instance, in a phase 1 clinical trial, the maximum tolerated dose of AUY922 induced night blindness in 20% of patients, and ∼7% of the patients developed grade ≥3 eye disorders (supplemental Table 1).45,50 These reports suggest that the nonselectivity of N-terminal HSP90 inhibitors leads to toxicity and to induction of the HSR, which could be why N-terminal HSP90 inhibitors fail in advanced clinical trials.8,14,45 Functional assays have shown that the silencing of HSF-1, HSP70, and HSP27 in addition to HSP90 considerably enhances the cytotoxic effect of HSP90 inhibitors against malignant cells.18,20,21 Accordingly, some HSP90 C-terminal inhibitors have been developed that appear not to induce any HSR; however, they have not yet entered clinical trials.15,23,24,51,52 None of these inhibitors have been reported to act as protein–protein interaction inhibitors that interfere with CTD dimerization.23,51,53,54 Here, we developed the α-aminoxy hexapeptide AX, which blocks HSP90 function by specifically binding to the CTD of HSP90 and then either dissociating oligomeric species or suppressing HSP90 CTD oligomerization, which ultimately leads to inhibition of HSP90 dimer formation.
The CTD is essential for the dimerization of HSP90 and therefore crucial for HSP90 function.41 Targeting protein–protein interactions is generally considered challenging due to the size, hydrophobicity, and lack of deep binding pockets at the protein–protein interfaces.55 Based on our MD simulation, AX binds to the HSP90 CTD dimerization interface and mimics hot spot residues on helix H5′. Thus, the mode of action of AX differs from all other known HSP90 inhibitors, which makes AX the first-in-class HSP90 C-terminal dimerization inhibitor. The absence of HSR upon administration of AX is in agreement with previous reports that the modulation of HSP90 function via the C terminus does not trigger an HSR response.15,23,24,51,52
We evaluated AX in CML and showed that it targets BCR-ABL1–expressing precursor cells, which are dependent on BCR-ABL1 expression, and CML LSCs, which are independent of BCR-ABL1 expression and therefore not targetable by TKIs. We showed that this mechanism also applies to highly resistant BCP-ALL, including BCR-ABL1+ BCP-ALL, in which AX is equally effective. Especially in Ph-like BCP-ALL, inhibition of HSP90 by AX is of major importance because of its poor response to TKI treatment and its 3-times-higher frequency compared with BCR-ABL1+ BCP-ALL, especially in young adults. Thus, in the future, AX or its analogs might also be applied to other leukemia entities that still have an intolerably poor prognosis, such as BCR-ABL1+ BCP-ALL, Ph-like BCP-ALL, and FLT3-ITD+ AML. Moreover, AX constitutes a promising compound in many solid tumor entities, which are characterized by expression of HSP90 client proteins (eg, AKT, HER2, BRAF, and EGFR) with key functions in multiple myelomas and solid carcinomas (supplemental Table 4).
The online version of this article contains a data supplement.
The publication costs of this article were defrayed in part by page charge payment. Therefore, and solely to indicate this fact, this article is hereby marked “advertisement” in accordance with 18 USC section 1734.
Acknowledgments
The authors thank all members of their groups for useful discussions and critical reading of the manuscript. Kathleen Mohs is acknowledged for her technical assistance during animal experiments.
J.H. is supported by the German Cancer Aid (Project 110997 and Translational Oncology Program 70112951), the German Jose Carreras Leukemia Foundation (DJCLS 02R/2016), the Kinderkrebsstiftung (2016/17), the Deutsches Konsortium für Translationale Krebsforschung (DKTK) Joint funding (Targeting MYC L*10), and the Elterninitiative Kinderkrebsklinik. F.K.H. acknowledges financial support from the Fonds der Chemischen Industrie and the Strategischer Forschungsfonds of Heinrich Heine University (HHU) (SFF - F 2012/79-17). T. Kurz, H.G., G.G., and M.U.K. are supported by funds from the Strategischer Forschungsfonds of HHU. Computational support and infrastructure were provided by the Centre for Information and Media Technology at HHU Düsseldorf (Germany). We are grateful to the John von Neumann Institute for Computing (NIC) and the Jülich Supercomputing Centre for computing time on the supercomputer JURECA (NIC project HKF 7 (H.G., B.F.). Financial support by Deutsche Forschungsgemeinschaft through funds to purchase the hybrid computer cluster used in this study (INST 208/704-1 FUGG) (H.G.) is gratefully acknowledged. The Deutsche Forschungsgemeinschaft is acknowledged for funds used to purchase the UHR-TOF maXis 4G, Bruker Daltonics, Bremen HRMS instrument used in this research. V.M. is supported by the Düsseldorf School of Oncology (funded by the Comprehensive Cancer Centre Düsseldorf/Deutsche Krebshilfe and the Medical Faculty of the Heinrich Heine University Düsseldorf). The Georg-Speyer-Haus is funded jointly by the German Federal Ministry of Health and the Ministry of Higher Education, Research and the Arts of the State of Hessen. A.B. is supported by the German Children’s Cancer Foundation and the Federal Ministry of Education and Research (Bonn, Germany).
Authorship
Contribution: H.G., T. Kurz, F.K.H., and J.H. contributed to conception and design of the project and supervision of the study; D.D., B.B., S.B., H.A., B.F., T.Z., T. Kröger, S.L., A.J.R.M., H.K., S.S., F.V.O., M.O., F.L., and V.M. acquired data; S.B., T.E., G.K., A.K., D.D., B.F., A.B., A.H., F.B., M.G., G.G., M.R., M.U.K., T. Kurz, H.G., F.K.H., and J.H. developed methodology; S.B., D.D., B.F., B.B., S.L., A.J.R.M., M.U.K., S.S., A.B., A.H., G.G., L.N.-S., J.J., T. Kurz, H.G., F.K.H., and J.H. were responsible for analysis and interpretation of data; and S.B., D.D., B.F., S.L., M.U.K., G.G., L.N.-S., J.J., T. Kurz, H.G., F.K.H., and J.H. wrote, reviewed, and/or revised the manuscript.
Conflict-of-interest disclosure: The authors declare no competing financial interests.
Correspondence: Julia Hauer, Department of Pediatric Oncology, Hematology and Clinical Immunology, Medical Faculty, Heinrich Heine University Düsseldorf, Düsseldorf, Germany; e-mail: julia.hauer@med.uni-duesseldorf.de; and Finn K. Hansen, Pharmaceutical/Medicinal Chemistry, Institute of Pharmacy, Leipzig University, Leipzig, Germany; e-mail: finn.hansen@uni-leipzig.de.
References
Author notes
F.K.H. and J.H. contributed equally to this study.

![Figure 1. Design and synthesis of HSP90 CTD dimerization inhibitors. (A) Crystal structure of the HSP90 dimer from Saccharomyces cerevisiae (Protein Data Bank [PDB] accession number 2CG956), shown as a transparent surface with cartoon representation. One monomer is colored in white and one in red, with 3 domains (N terminal, middle, and C terminal) colored in different shades of red. (B) Dimeric CTD from human HSP90 (PDB accession number 3Q6M57). Both subunits are colored differently. Helices H4, H4′, and H5, H5′ form the CTD dimerization interface. Dashed lines show where the middle domains would be located. (C) Overlay of a hexameric α-aminoxy peptide with all-methyl side chains (blue sticks) onto Cβ atoms of hot spot amino acids I688, Y689, I692, and L69634 (gray sticks) on helix H5′ (sequence P681 to D699) shown in transparent cartoon representation, with backbone atoms shown as black lines. The right panel shows the structures rotated by 90° such that the helix C terminus is oriented toward the viewer. Cβ reference atoms of hot spot amino acids are depicted as magenta spheres and Cβ atoms of the α-aminoxy peptide as orange spheres. (D) Solid-phase synthesis of α-aminoxy hexapeptides 1 (AX) and 2. Reagents and conditions: a), (i) 20% piperidine in N,N-dimethylformamide (DMF), room temperature, 2 × 15 min; (ii) Phth-NOLeu-NOLeu-OH, BOP, HOBt, N-ethylmorpholine (NEM) in DMF, room temperature, 24 hours; b) 5% hydrazine hydrate in MeOH, 2 × 15 min; (ii) Phth-NOIle-NOIle-OH, BOP, HOBt, NEM in DMF, room temperature, 24 hours; c) (i) 5% hydrazine hydrate in MeOH, 2 × 15 min; (ii) Cbz-NOPhe-NOPhe-OH, BOP, HOBt, NEM in DMF, room temperature, 24 hours; (iii) trifluoroacetic acid/triethylsilane (98:2, v:v), room temperature, 1.5 hours; d) (i) 5% hydrazine hydrate in MeOH, 2 × 15 min; (ii) Phth-NOPhe-OH, BOP, HOBt, NEM in DMF, room temperature, 24 hours; e) 5% hydrazine hydrate in MeOH, 2 × 15 min; (ii) Cbz-NOTyr(t-Bu)-OH, BOP, HOBt, NEM in DMF, room temperature, 24 hours; (iii) trifluoroacetic acid/triethylsilane (98:2, v:v), room temperature, 1.5 hours. PEG AM resin, polyethylene glycol aminomethyl-polystyrene resin.](https://ash.silverchair-cdn.com/ash/content_public/journal/blood/132/3/10.1182_blood-2017-10-810986/4/m_blood810986f1.jpeg?Expires=1769282207&Signature=cVeuWq83Qcq8ho58NbAq1S8p8WmZdFeLwJJsxTKQ1U4~aHOyUaD~-I2QGyYhC-jXEUqfZhktjUSmyR41-Z6J4khUZxCY6-hMaHV3bE~FmniG-nwWJbJMUhZ62K3bIRH7rum1cckrUuG8y2CjXP47lLk9tqaDVT-ZuLzKgrhvN~NJh1Iw6I5CGwwJM3fSctV5NOXIU4S1xf9LDKXirjcSDRrncxBAHwDmByKYhdZxmr2x6EvRk3UP9H6H1waiVvs6-zB90e0eiad2zJb-oTdat6KyWkUt3-4hNOxtD21Nf16kmT6W78kAdv6VLFQ4w~28rjOil48D3bQkhP25KlCF9Q__&Key-Pair-Id=APKAIE5G5CRDK6RD3PGA)


![Figure 1. Design and synthesis of HSP90 CTD dimerization inhibitors. (A) Crystal structure of the HSP90 dimer from Saccharomyces cerevisiae (Protein Data Bank [PDB] accession number 2CG956), shown as a transparent surface with cartoon representation. One monomer is colored in white and one in red, with 3 domains (N terminal, middle, and C terminal) colored in different shades of red. (B) Dimeric CTD from human HSP90 (PDB accession number 3Q6M57). Both subunits are colored differently. Helices H4, H4′, and H5, H5′ form the CTD dimerization interface. Dashed lines show where the middle domains would be located. (C) Overlay of a hexameric α-aminoxy peptide with all-methyl side chains (blue sticks) onto Cβ atoms of hot spot amino acids I688, Y689, I692, and L69634 (gray sticks) on helix H5′ (sequence P681 to D699) shown in transparent cartoon representation, with backbone atoms shown as black lines. The right panel shows the structures rotated by 90° such that the helix C terminus is oriented toward the viewer. Cβ reference atoms of hot spot amino acids are depicted as magenta spheres and Cβ atoms of the α-aminoxy peptide as orange spheres. (D) Solid-phase synthesis of α-aminoxy hexapeptides 1 (AX) and 2. Reagents and conditions: a), (i) 20% piperidine in N,N-dimethylformamide (DMF), room temperature, 2 × 15 min; (ii) Phth-NOLeu-NOLeu-OH, BOP, HOBt, N-ethylmorpholine (NEM) in DMF, room temperature, 24 hours; b) 5% hydrazine hydrate in MeOH, 2 × 15 min; (ii) Phth-NOIle-NOIle-OH, BOP, HOBt, NEM in DMF, room temperature, 24 hours; c) (i) 5% hydrazine hydrate in MeOH, 2 × 15 min; (ii) Cbz-NOPhe-NOPhe-OH, BOP, HOBt, NEM in DMF, room temperature, 24 hours; (iii) trifluoroacetic acid/triethylsilane (98:2, v:v), room temperature, 1.5 hours; d) (i) 5% hydrazine hydrate in MeOH, 2 × 15 min; (ii) Phth-NOPhe-OH, BOP, HOBt, NEM in DMF, room temperature, 24 hours; e) 5% hydrazine hydrate in MeOH, 2 × 15 min; (ii) Cbz-NOTyr(t-Bu)-OH, BOP, HOBt, NEM in DMF, room temperature, 24 hours; (iii) trifluoroacetic acid/triethylsilane (98:2, v:v), room temperature, 1.5 hours. PEG AM resin, polyethylene glycol aminomethyl-polystyrene resin.](https://ash.silverchair-cdn.com/ash/content_public/journal/blood/132/3/10.1182_blood-2017-10-810986/4/m_blood810986f1.jpeg?Expires=1769282208&Signature=5FX743ykGOHNLHiF9ybKda2DCV4G0973tJlT9zqs0z8X0yEs~OxgU79MCIor3Mb3eW~mildskDfvJBgtUWVUfWiy~wbMPS1IP4i2LYG2aJ6gPBMnV-drPkC7tF-ZBgWTG6UR-Xks-bTxsSpwqY2e3Z0w4PrvuHRaK8qoe1gMsQhA0jz-5TCZ4XWZVYQvYcx4TRMv1ITM3OYuMdMC42e9Ho6AsxEt5wPUVsNYC6ww43U7h7ZpOIGlT1semdJawS4fjTlVdjtcrENy9KyGBdZoOQiSH79-xseYPUdybMTMbSVGwAmEgXE4zStqGHxws4GRsY5jLHpIqKeScCuo~EAobw__&Key-Pair-Id=APKAIE5G5CRDK6RD3PGA)
